Mizuho U.S. Utility Summit 2021 - November 30, 2021 - AEP.com
←
→
Page content transcription
If your browser does not render page correctly, please read the page content below

Mizuho U.S. Utility
  Summit 2021
    November 30, 2021
“Safe Harbor” Statement Under the Private Securities Litigation
   Reform Act of 1995
    This presentation contains forward-looking statements within the meaning of Section 21E of the Securities Exchange Act of 1934. Although AEP and each of its
    Registrant Subsidiaries believe that their expectations are based on reasonable assumptions, any such statements may be influenced by factors that could cause
    actual outcomes and results to be materially different from those projected. Among the factors that could cause actual results to differ materially from those in the
    forward-looking statements are: changes in economic conditions, electric market demand and demographic patterns in AEP service territories, the impact of
    pandemics, including COVID-19, and any associated disruption of AEP’s business operations due to impacts on economic or market conditions, costs of
    compliance with vaccination or testing mandates to AEP, electricity usage, employees including employee unwillingness to comply with potential vaccination
    mandates, customers, service providers, vendors and suppliers, inflationary or deflationary interest rate trends, volatility in the financial markets, particularly
    developments affecting the availability or cost of capital to finance new capital projects and refinance existing debt, the availability and cost of funds to finance
    working capital and capital needs, particularly during periods when the time lag between incurring costs and recovery is long and the costs are material,
    decreased demand for electricity, weather conditions, including storms and drought conditions, and the ability to recover significant storm restoration costs, the
    cost of fuel and its transportation, the creditworthiness and performance of fuel suppliers and transporters and the cost of storing and disposing of used fuel,
    including coal ash and spent nuclear fuel, the availability of fuel and necessary generation capacity and performance of generation plants, the ability to recover
    fuel and other energy costs through regulated or competitive electric rates, the ability to build or acquire renewable generation, transmission lines and facilities
    (including the ability to obtain any necessary regulatory approvals and permits) when needed at acceptable prices and terms, including favorable tax treatment,
    and to recover those costs, new legislation, litigation and government regulation, including changes to tax laws and regulations, oversight of nuclear generation,
    energy commodity trading and new or heightened requirements for reduced emissions of sulfur, nitrogen, mercury, carbon, soot or particulate matter and other
    substances that could impact the continued operation, cost recovery and/or profitability of generation plants and related assets, evolving public perception of the
    risks associated with fuels used before, during and after the generation of electricity, including coal ash and nuclear fuel, timing and resolution of pending and
    future rate cases, negotiations and other regulatory decisions, including rate or other recovery of new investments in generation, distribution and transmission
    service and environmental compliance, resolution of litigation, the ability to constrain operation and maintenance costs, prices and demand for power generated
    and sold at wholesale, changes in technology, particularly with respect to energy storage and new, developing, alternative or distributed sources of generation,
    the ability to recover through rates any remaining unrecovered investment in generation units that may be retired before the end of their previously projected
    useful lives, volatility and changes in markets for coal and other energy-related commodities, particularly changes in the price of natural gas, changes in utility
    regulation and the allocation of costs within regional transmission organizations, including ERCOT, PJM and SPP, changes in the creditworthiness of the
    counterparties with contractual arrangements, including participants in the energy trading market, actions of rating agencies, including changes in the ratings of
    debt, the impact of volatility in the capital markets on the value of the investments held by the pension, other postretirement benefit plans, captive insurance entity
    and nuclear decommissioning trust and the impact of such volatility on future funding requirements, accounting standards periodically issued by accounting
    standard-setting bodies, and other risks and unforeseen events, including wars, the effects of terrorism (including increased security costs), embargoes, naturally
    occurring and human-caused fires, cyber security threats and other catastrophic events, the ability to attract and retain requisite work force and key personnel.

     Darcy Reese, Vice President                                                Tom Scott, Director
        Investor Relations                                                         Investor Relations
        614-716-2614                                                               614-716-2686
        dlreese@aep.com                                                            twscott@aep.com
                                                                                                                                                                      2
MIZUHO U.S. UTILITY SUMMIT 2021 • AEP.COM
Pure Play Regulated Utility

   16,700 EMPLOYEES

   25GW OWNED GENERATION

   5.5M CUSTOMERS, 11 STATES
                                                                                                               40,000 TRANSMISSION MILES
    $86B TOTAL ASSETS
                                                                                                            224,000 DISTRIBUTION MILES

                                                                                                                                      $50B RATE BASE

                                                                                     $42B CURRENT MARKET CAPITALIZATION

 Statistics as of September 30, 2021 except for rate base as of December 31, 2020 and market capitalization as of November 26, 2021

                                                                                                                                               3
MIZUHO U.S. UTILITY SUMMIT 2021 • AEP.COM
AEP’s Strategic Vision and Execution
     Execute Strategy                               Top Priorities

      Affordable                                         • Be an industry leader in cost efficiency
      Relentless pursuit of affordable energy            • Grow our business while keeping rates at or below regional average
      solutions                                          • Ensure cost competitiveness with leading technologies

      Customer and Community
      Centric Growth                                     • Advance electrification of the economy
                                                         • Support and build thriving communities through economic development and job growth
      Aggressively expand investments
      and service offerings                              • Diversify our asset base and service offerings

      Clean                                              • Transform all parts of our business to align with AEP emission reduction goals
      Lead the transformation to a clean                 • Improve the reliability and resiliency of the grid to facilitate a clean energy economy for
      energy economy through electrification
      and zero carbon resources                            our communities

      Innovate and Achieve                               • Achieve 5%-7% per year earnings per share growth and maintain at least a BBB
      Continue to raise the bar in operational             Stable/Baa2 Stable credit rating
      excellence and empower teams to integrate          • Empower our teams to continually innovate solutions in all aspects of our business
      technologies, analytics and risk mitigation        • Be best in class in cost and operational excellence through our continuous
      tools for the benefit of our customers and
      communities                                          improvement foundation of Achieving Excellence

      Engage                                            • Achieve Zero Harm
      Equip our workforce and improve our               • Be a great place to work
      employee experience

                                                                                                                                                4
MIZUHO U.S. UTILITY SUMMIT 2021 • AEP.COM
AEP KEY THEMES
  ● Strong Return Proposition with Proven Track
      Record of EPS Performance and Dividend
      Growth

  ● Commitment to ESG

  ● Generation Transformation with Balance Sheet
      Focus

  ● Flexible Capital Investment Pipeline

  ● Dedication to Customer Affordability

MIZUHO U.S. UTILITY SUMMIT 2021 • AEP.COM
Strong Return Proposition
Total Shareholder Return 2022 Operating Earnings Guidance Range
8% - 10% $4.85 - $5.05
2021 EPS 2022 EPS
Dividend Yield EPS Growth Original 6% EPS KY Sale Midpoint
Midpoint
3% + 5% - 7% + Growth + Accretion =
$4.65 $4.95
Steady Growth
Consistent Dividends
Low Risk, Regulated Assets
Investment Pipeline
Incentive Compensation Tied to EPS Results
6
MIZUHO U.S. UTILITY SUMMIT 2021 • AEP.COM
Proven Track Record of EPS Performance

    2010

    2011                                                                                                                      Over a Decade of Meeting
                                                                                                                               or Exceeding Original
    2012
                                                                                                                                   EPS Guidance
    2013

    2014

    2015

    2016

    2017

    2018

    2019

    2020
             1
    2021

                                                                                                                                   KEY
                                                                                                                                       ACTUAL RESULT

    Note: Chart is representative of actual operating EPS in comparison to original operating EPS guidance range.

    1   2021 original operating EPS guidance was $4.55-$4.75. In October 2021, guidance was narrowed to             LOW-END      MID-POINT      HIGH-END
        $4.65-$4.75, raising the midpoint to $4.70.

                                                                                                                                                           7
MIZUHO U.S. UTILITY SUMMIT 2021 • AEP.COM
Strong Dividend Growth
$3.50
$3.00 $3.12
$2.84
$3.00
$2.71 Targeted payout
$2.39 $2.53 ratio 60-70% of
$2.50
$2.15
$2.27 operating earnings
$2.03
$1.85 $1.88 $1.95
$2.00
$1.71 Over 111 years of
consecutive
$1.50
quarterly
$1.00
dividends
$0.50
Targeted dividend
growth in line with
$- earnings
2010 2011 2012 2013 2014 2015 2016 2017 2018 2019 2020 2021 2022E*
4%-6% Earnings Growth Rate 5%-7% Earnings Growth Rate
EPS Growth + Dividend Yield = 8% to 10% Annual Return Opportunity
* Subject to Board approval
8
MIZUHO U.S. UTILITY SUMMIT 2021 • AEP.COM
Commitment to ESG

         Environmental                                                      Social                           Governance

     •    Accelerated carbon emission reduction                          • Diversity and inclusion vision   • 12 directors, 11 independent,
          goals: 80% by 2030, net zero by 2050
                                                                         • Focused on economic and          • 50% diverse
     •    ~$9B spent on environmental controls                             business development in our
                                                                                                            • Average tenure of 8 years
          since 2000                                                       service territories
                                                                                                            • Annual shareholder
     •    47% reduction in coal capacity as a                            • Donated ~$39M in 2020 to
                                                                                                              engagement on strategy and
          percent of total capacity by 2030                                support more than 1,200
                                                                                                              ESG matters with lead
                                                                           community organizations
     • 2020 coal capacity = 14% of rate base                                                                  independent director
                                                                         • Launched a $5M Delivering on       participation
     • 2020 coal revenue = 13% of total
                                                                           the Dream: Social and Racial
       revenue                                                                                              • Environmental reports
                                                                           Justice grant program in 2021
                                                                                                              provided at every Board
     • Clean energy transition tied to long-
                                                                         • Zero Harm                          meeting
       term incentive compensation

         CO2          SO2             NOx              Hg
         74%          98%             96%             98%

    Note: See “Environmental, Social and Governance” section for further information
                                                                                                                                          9
MIZUHO U.S. UTILITY SUMMIT 2021 • AEP.COM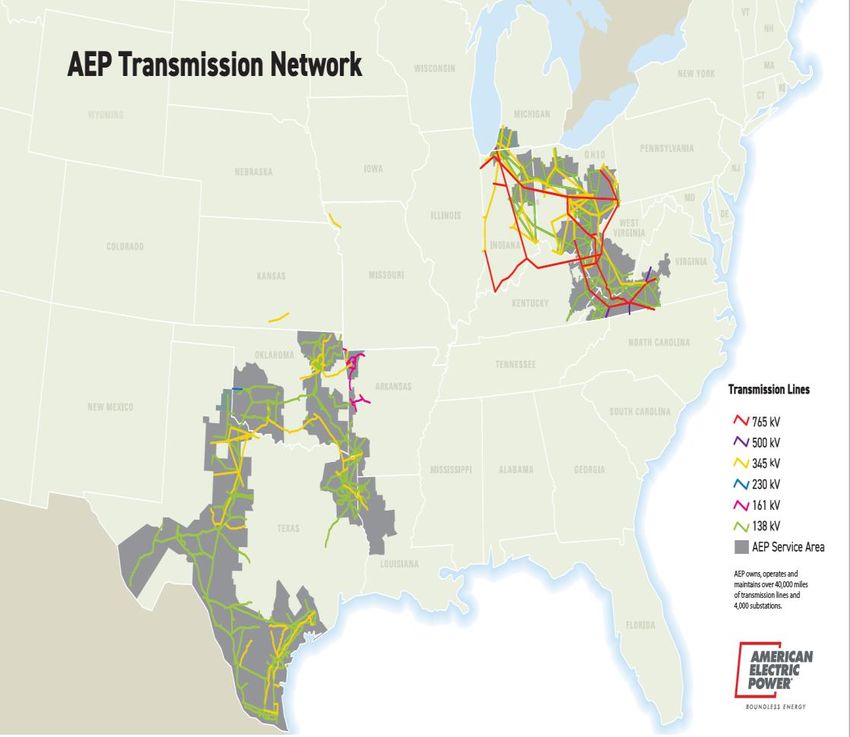
Transforming Our Generation Fleet
                           80%

                                            70%
                           70%
                                    66%

                           60%

                                                                                                                                                                           50%
                           50%
                                                   43%
    Net Maximum Capacity

                           40%

                           30%                                                           27%

                                                           19%            22% 19%                22%                                                               19%
                           20%

                           10%                                                                                  7% 6%          7%      6%            4% 4%                                               4%      3%
                                                                                                                                                                                          1% 1%
                           0%
                                    1999    2005    2021    2030          1999    2005    2021    2030         1999    2005    2021    2030         1999    2005    2021    2030          1999    2005   2021    2030

                                              Coal                           Natural Gas                              Nuclear                       Hydro, Wind,                       Energy Efficiency /
                                                                                                                                                  Solar and Pumped                     Demand Response

                                               47%                            No Change                                    1%
                                                                                                                                                               46%                                   2%

                           Capacity includes both owned and PPA generation. Energy Efficiency / Demand Response represents avoided capacity rather than physical assets.

                           2021 data as of 11/1/2021 includes current capacity of KPCo. In October 2021, AEP entered into an agreement to sell its Kentucky operations to Algonquin Power & Utilities.
                           The sale is expected to close in Q2-22 pending regulatory approvals. 2030 includes forecasted additions and retirements, and excludes previously identified projected
                           resource additions for KPCo.

                           2030 coal capacity includes Amos, Mountaineer and Mitchell plants as the WVPSC approved ELG investment to keep optionality for these plants to operate post
                           2028. 2030 coal capacity also includes SWEPCO’s Turk and Flint Creek plants.

                                                                                                                                                                                                                10
MIZUHO U.S. UTILITY SUMMIT 2021 • AEP.COM
Retirement Progress and Plans
2010 Reduce coal generation by approximately 5,600 MW by 2030 and decrease coal net
~24,800 MW1 book value through retirements and depreciation. Creates opportunities to own
replacement wind, solar and natural gas resources.
2020
~12,100 MW1,2
2030E
2028E ~6,500 MW
~7,100 MW
2010 – 2020 2021-2030 Planned
Retirements/Sales Retirements
5,574 MW
Year Plant Capacity Year Plant Capacity Year Plant Capacity Reduction
2011 Sporn 5 450 MW 2015 Tanners Creek 1-4 995 MW 2021 Dolet Hills 257 MW in
2012 Conesville 3 165 MW 2016 Big Sandy 1 278 MW 2023 Pirkey 580 MW
Coal
2014 Beckjord 53 MW 2016 Clinch River 1 & 2 470 MW 2026 Northeastern 3 469 MW
Capacity
2015 Big Sandy 2 800 MW 2016 Northeastern 4 470 MW 2028 Rockport 1 1,310 MW
from 2020
2015 Clinch River 3 235 MW 2016 Welsh 2 528 MW 2028 Rockport 2 1,310 MW
46%
2015 Glen Lyn 5 & 6 335 MW 2017 Gavin 1 & 2 2,640 MW 2028 Welsh 1,053 MW
2015 Kammer 1-3 630 MW 2017 Zimmer 330 MW 2028 Cardinal 1 595 MW
2015 Kanawha River 1 & 2 400 MW 2018 Stuart 1-4 600 MW
2015 Muskingum River 1-5 1,440 MW 2019 Conesville 5 & 6 820 MW
2015 Picway 5 100 MW 2020 Conesville 4 651 MW
2015 Sporn 1-4 600 MW 2020 Oklaunion 460 MW
1 Total includes owned coal units and the Rockport 2 lease
2 Includes 2012 Turk Plant addition
11
MIZUHO U.S. UTILITY SUMMIT 2021 • AEP.COMExecuting on Our Regulated Renewables Opportunity
Wind Additions
Included in
2022 – 2030 2022-2026
Company 1,2
(MW) Capital Plan
APCo 1,800
(MW / billions)
803 $ 1.3
~0.5 GW ~15 GW ~16 GW
North Central Wind 2022-2030 Regulated Renewable
I&M 800 400 $ 0.4
In-Service in 2021 Opportunity by 2030
PSO1 3,053 1,604 $ 2.1
SWEPCO1 3,546 1,845 $ 2.5
Total1 9,199 4,652 $ 6.3
Solar Additions
Included in We are executing on our regulated
2022 – 2030 2022-2026
Company
(MW) Capital Plan renewables plan, introducing
(MW / billions) 1,2
APCo
I&M
660
900
292
195
$ 0.5
$ 0.6
$8.2B
PSO
into the 2022-2026 capital investment forecast
3,600 461 $ 0.6
SWEPCO 300 200 $ 0.2
Total 5,460 1,148 $ 1.9 Investment opportunity is dynamic and AEP
operating companies will continue to develop
Total IRPs over the near and long-term in collaboration
14,659 MW 5,800 MW $ 8.2B
Renewables with stakeholders.
Note: Projected regulated resource additions current as of 9/30/2021. Resource plans also project 2.3 GW of natural gas additions through 2030 (1 GW I&M / 0.3 GW PSO / 1 GW SWEPCO).
1 Includes 999 MW / $1.3B investment in North Central Wind Traverse project
2 Investments in renewables will be subject to regulatory approvals
12
MIZUHO U.S. UTILITY SUMMIT 2021 • AEP.COMFlexible Capital Investment Pipeline
Regulated Contracted
Renewables Transmission Distribution Renewables Other
$8.2 Billion $12.9 Billion $10.4 Billion $1.7 Billion $4.8 Billion
Regulated Renewable Transmission Distribution Contracted Generation and
Capex in Plan Capex in Plan Capex in Plan Renewables IT/Workplace
Capex in Plan Services
Capex in Plan
$38B Our flexible and extended organic pipeline of transmission and distribution
investments, and regulated renewable opportunities provide the ability to
strategically shift capital and deliver on our 5% -7% EPS growth commitment.
2022- 2026 Capital Forecast
Customer
Rate and
Headroom
Reductions Responsible Management of Capital Investments
Large
ESG
Benefits
Organic Largest transmission Among the largest distribution
Growth
Opportunity system in the U.S systems in the U.S.
Credit Increase
Positive Earnings
Quality
13
MIZUHO U.S. UTILITY SUMMIT 2021 • AEP.COMDedicated to Keeping Customer Rates Affordable
Current Future
Customer Total Bill Transformation
Fuel Significant fuel costs replaced with capital investment
Reduced fixed O&M profiles of generation resource
Tax credits passed back to customers
Capital
Capital Capital
Facilitating electrification reducing total customer costs
Economic development to spread costs
O&M O&M
O&M
AEP’s efforts will transform customer bills and control while keeping rates affordable and
maintaining reliable service for customers
Note: On a system average, rates expected to go up approximately 4% annually over the forecasted period (a 1% decline from previous estimates).
14
MIZUHO U.S. UTILITY SUMMIT 2021 • AEP.COMPOSITIONING FOR THE FUTURE ● 2022-2026 Capital Forecast ● 2022-2026 Cash Flows and Financial Metrics ● Rate Base Growth ● Efficient Cost Recovery Mechanisms MIZUHO U.S. UTILITY SUMMIT 2021 • AEP.COM
2022-2026 Capital Forecast of $38B
                                      Regulated                   IT/Workplace Services
                               Fossil/Hydro Generation                 $2.5B • 7%
                                      $1.0B • 3% Nuclear Generation
                       Regulated
                Environmental Generation               $0.3B • 1%
                       $0.6B • 1%

              Regulated
            New Generation
              $0.4B • 1%

        Contracted
        Renewables
         $1.7B • 4%                                                                                        The ability to quickly redeploy
                                                                                      Distribution
                                                                                                           transmission and distribution
                                                                                      $10.4B • 27%
                                                                                                              investment ensures we
                                                                                                            maintain capital spend while
                                    Regulated Renewables
                                                                                                              mitigating customer bill
                                         $8.2B • 22%
                                                                                                                        impact
                                                                                     Transmission
                                                                                      $7.3B • 19%

                                                         AEP Transmission
                                                              Holdco
                                                           $5.6B • 15%

                        100%
             of capital allocated to                     $23.3B / 61%                                $9.9B / 26%
           regulated businesses and                        allocated to wires                  allocated to renewables
             contracted renewables

                         Capital forecast emphasizes investment in wires and
                                 renewables with balance sheet focus

                                                                                                                                      16
MIZUHO U.S. UTILITY SUMMIT 2021 • AEP.COM
2022-2026 Capital Forecast by Subsidiary
$ in millions, excludes AFUDC 2022E 2023E 2024E 2025E 2026E Total
Appalachian Power Company $ 1,093 $ 1,767 $ 943 $ 1,899 $ 993 $ 6,695
Wheeling Power Company $ 63 $ 63 $ 29 $ 30 $ 34 $ 219
Kingsport Power Company $ 25 $ 37 $ 35 $ 36 $ 35 $ 168
Indiana Michigan Power Company $ 608 $ 537 $ 694 $ 989 $ 1,006 $ 3,834
AEP Ohio $ 787 $ 849 $ 800 $ 738 $ 673 $ 3,847
Public Service Company of Oklahoma $ 977 $ 487 $ 1,413 $ 1,069 $ 927 $ 4,873
Southwestern Electric Power Company $ 1,187 $ 534 $ 1,743 $ 453 $ 1,116 $ 5,033
AEP Texas Company $ 1,151 $ 1,181 $ 1,190 $ 1,153 $ 1,119 $ 5,794
AEP Generating Company $ 74 $ 23 $7 $ 18 $ 12 $ 134
AEP Transmission Holdco $ 1,345 $ 1,163 $ 1,096 $ 1,023 $ 996 $ 5,623
Generation & Marketing $ 397 $ 323 $ 330 $ 276 $ 339 $1,665
Other $ 38 $ 36 $ 33 $ 19 $ 19 $ 145
Total Capital and Equity Contributions $ 7,745 $ 7,000 $ 8,313 $ 7,703 $ 7,269 $ 38,030
Note: Capital plans are continuously optimized which may result in redeployment between functions and companies
17
MIZUHO U.S. UTILITY SUMMIT 2021 • AEP.COMCapital Allocation Shift to Wires and Renewable Generation
2011 Regulated 2022-2026 Regulated
Capital Capital Forecast
7%
35% 33% 31%
24%
32% 38%
Generation Transmission Distribution Generation Renewable Generation
Transmission Distribution
Note: For comparative purposes, 2011 excludes all Kentucky-related capital
18
MIZUHO U.S. UTILITY SUMMIT 2021 • AEP.COM2022-2026 Cash Flows and Financial Metrics
$ in millions 2022E 2023E 2024E 2025E 2026E
Cash from Operations $ 5,700 $ 6,000 $ 6,500 $ 6,900 $ 7,400
Net Cash Proceeds from Sale of Kentucky
1,400 - - - -
Operations1
Capital and JV Equity Contributions2 (7,800) (7,000) (8,300) (7,700) (7,300)
Other Investing Activities (200) (400) (400) (400) (400)
Common Dividends3 (1,600) (1,600) (1,700) (1,700) (1,700)
Required Capital $ (2,500) $ (3,000) $ (3,900) $ (2,900) $ (2,000)
Financing
Required Capital $ (2,500) $ (3,000) $ (3,900) $ (2,900) $ (2,000)
Debt Maturities (Senior Notes, PCRBs) (3,000) (2,400) (500) (1,800) (1,400)
Securitization Amortizations (100) (200) (200) (100) (100)
Equity Units Conversion 805 850 - - -
Equity Issuances – Includes DRP - 100 600 700 700
Debt Capital Market Needs (New) $ (4,795) $ (4,650) $ (4,000) $ (4,100) $ (2,800)
Financial Metrics
Debt to Capitalization (GAAP) Approximately 60%
FFO/Total Debt (Moody’s) 13.5% - 15.0% Range
1 Cash proceeds to Parent of $1.4B are net of Kentucky indebtedness, tax and transaction costs and adjusted for residual pay-down of Parent debt.
2 Capital investments in 2022 include approximately $1.3B for North Central Wind’s Traverse project.
3 Common dividends increased to $0.78 per share Q4-21; $3.12/share 2022-2026 (dividends per share remain constant until approved by Board of Directors). Dividends
evaluated by Board of Directors each quarter; stated target payout ratio range is 60%-70% of operating earnings. Targeted dividend growth in line with earnings.
Note: Actual cash flows will vary by company and jurisdiction based on regulatory outcomes.
19
MIZUHO U.S. UTILITY SUMMIT 2021 • AEP.COM7.3% CAGR in Rate Base Growth
Cumulative Change from 2020 Base
$16
$25.6B
$15
2020 RATE BASE PROXY
$22.3B $13.7
$14 Vertically Integrated Utilities $25.3B
$13
T&D Utilities $13.8B $18.3B $11.7
$12
$11 Transcos/Transource $9.2B
$10 TOTAL $48.3B $9.2
$9 $13.4B
$8 $7.4
$7 $9.4B $6.2 $6.5
$6 $5.5
$5.7B $4.5
$5 $4.4 $4.2 $4.1
$4 $3.6
$2.9 $2.8 $3.0
$3 $2.2
$2 $1.5 $1.3
$1
$0
2021E 2022E 2023E 2024E 2025E 2026E
Vertically Integrated Utilities T&D Utilities Transcos/Transource
5%-7% EPS growth is predicated on regulated rate base growth
Note: For comparative purposes, 2020 rate base proxy excludes all Kentucky-related rate base of approximately $2 billion
20
MIZUHO U.S. UTILITY SUMMIT 2021 • AEP.COMEfficient Cost Recovery Mechanisms
Renewables Historic Trackers
Recovery1 28%
22% Approximately 85% of
2022-2026 regulated
capital plan recovered
through reduced lag
Base Rates Forward Rates
mechanisms
15% 7%
Forward Trackers
28%
1 Recovery of renewable investments will occur using a combination of reduced lag mechanisms including trackers, forward test years, near-term retention
of PTCs and timed rate cases
21
MIZUHO U.S. UTILITY SUMMIT 2021 • AEP.COMFINANCIAL INFORMATION ● Regulated Returns and Authorized Equity Layers ● 2022 Operating Earnings Guidance ● 2022 Key Guidance Sensitivities and Assumptions ● Regulatory Timeline of Kentucky Sale ● Current Rate Case Activity ● Untracked O&M and O&M Optimization ● Normalized Load Trends ● Pension and OPEB Estimates ● Operational and Financing Structure ● 2022 Debt Issuances and Maturities ● Credit Ratings MIZUHO U.S. UTILITY SUMMIT 2021 • AEP.COM
Regulated Returns and Authorized Equity Layers
  Twelve Months Ended 9/30/2021 Earned ROE’s                                                             Authorized Equity Layers
  (non-GAAP operating earnings, not weather normalized)                                                  (in whole percentages)
   14%
                                                                                                            Operating
                                                                                                                            9/30/17   9/30/21   Improvement
                                                                                                            Company
   12%
                                                                                                         AEP Ohio2           48%       54%          6%
                                                                                                 11.2%
                                                     10.3%                                               APCo – VA           43%       50%          7%
   10%
                    9.3%                                                                                 APCo – WV           47%       50%          3%

       8%                                                                   8.2%         8.2%            PSO2                44%       53%          9%
                               7.3%                              7.6%
                                           6.9%                                                          SWEPCO – AR2        46%       51%          5%
       6%
                                                                                                         SWEPCO –LA2         47%       51%          4%

                                                                                                         AEP Texas           40%       43%          3%
       4%
                                                                                                         AEP Transmission    50%       55%          5%

       2%

       0%
                     AEP       APCo1      KPCo1          I&M1    PSO1     SWEPCO1         AEP     AEP
                    OHIO1                                                                TEXAS   TRANS

                                                                                                                           Improving
                                                                                                                        Authorized Equity
   2022 Forecasted Regulated ROE is 9.3%
                                                                                                                        Layers Over Time
   1
       Base rate cases pending/order recently received
   2
       9/30/2021 data represents equity layers as requested in pending base rate cases

   Sphere size based on each company’s relative equity balance

                                                                                                                                                    23
MIZUHO U.S. UTILITY SUMMIT 2021 • AEP.COM
2022 Operating Earnings Guidance
0.15 (0.05) $4.95/sh
0.01 (0.01) 2022 EPS
Midpoint
$4.70/sh 0.15
2021 EPS
Revised
Midpoint
Rate Changes $0.43 Rate Changes $0.20 Invest Growth $0.12 Renewables $0.01 Investment Gain $(0.05)
Retail Load $(0.07) Retail Load $0.05 True-up $(0.11) Generation $(0.03) Interest Inc/Exp $0.02
Weather $(0.06) Weather $(0.01) Other/Financing $(0.05) Wholesale $0.02 Other/Financing $0.02
Off-system Sales $(0.04) Trans Revenue $0.09 Kentucky Annual Retail $0.05
$(0.01)
Comparison1
Trans Revenue $0.09 Other Revenue $0.02 Interest Exp $(0.05)
Other Revenue $0.02 O&M $(0.02) Other/Financing $0.01
O&M $(0.05) Depreciation $(0.09)
Depreciation $(0.12) Other Taxes $(0.06)
Other Taxes $(0.04) Interest Exp $(0.02)
Def Fuel Other/Financing $(0.01)
$0.07
Carrying Chgs
Other/Financing $(0.02)
Kentucky Annual
$(0.06)
Comparison1
Vertically Integrated Transmission and AEP Transmission Generation & Corporate
2021E 2022E
Utilities Distribution Utilities Holdco Marketing and Other
2022E $2.41 $1.26 $1.27 $0.29 $(0.28) $4.95
1
Represents the net impact to earnings of Kentucky operations being included in AEP consolidated results for 12 months in 2021 vs. 4 months in 2022. Expected accretion from Kentucky sale transaction
included in 2022 operating earnings guidance.
24
MIZUHO U.S. UTILITY SUMMIT 2021 • AEP.COM2022 Key Guidance Sensitivities and Assumptions
Sensitivity EPS Assumptions
Retail Sales VIU T&D 2022 Regulated
Connected Load
(Billed and Accrued)
Residential 1.0% +/- 0.027 0.010
Residential 57,523 GWh
Commercial 1.0% +/- 0.013 0.003 Commercial 47,152 GWh
Industrial 58,649 GWh
Industrial 1.0% +/- 0.011 0.000
O&M Expense
1.0% +/- 0.04
(excludes O&M with offsets) Rate Changes: $369M; $164M secured
Interest Expense Average Shares Outstanding: 511.9M
25 bps +/- 0.02
(floating debt)
Interest Expense
25 bps +/- 0.01
(new issuances)
Regulated ROE 10 bps +/- 0.05
A $6.5M change in pretax earnings equals $0.01 per share
Note: AFUDC earnings move inversely to interest expense from rate changes. Sensitivities and assumptions herein include Kentucky operations through April 2022.
25
MIZUHO U.S. UTILITY SUMMIT 2021 • AEP.COMRegulatory Timeline of Kentucky Sale
In October 2021, AEP entered into an agreement to sell its Kentucky operations to Algonquin Power & Utilities for
an enterprise value of $2.846B. The sale is expected to close in Q2-22 pending regulatory approvals.
Nov Dec Jan Feb March April May
AEP Filings 2021 2021 2022 2022 2022 2022 2022
Mitchell Operating Agreement
Approvals
(Operations/Ownership)
FERC 60 days
Kentucky Public Service
No Statutory Timeline1
Commission (KPSC)
West Virginia Public Service
Commission No Statutory Timeline1
Kentucky Sale Transfer
Hart-Scott-Rodino Review 30 – 60 Days
FERC 203 Application 180 days
KPSC Application for
Approval of Transfer and Control 120 days
Note: Additionally, needs clearance from the Committee on Foreign Investment in the United States (90-120 days).
1
Commissions are seeking a timely update of the Operating Agreement
26
MIZUHO U.S. UTILITY SUMMIT 2021 • AEP.COMCurrent Rate Case Activity
AEP Ohio APCo - Virginia
Docket # 20-0585-EL-AIR Docket # PUR-2020-00015
Filing Date 6/1/2020 Filing Date 3/31/2020
Requested Revenue Increase $402M Requested Rate Base $2.5B
Requested Rate Base $3.105B Requested ROE 9.9%
Requested ROE 10.15% Cap Structure 50%D / 50%E
Cap Structure 45.6%D / 54.4%E $65M
Gross Revenue Increase
(Less $27M D&A)
Net Revenue Increase $41M1
Net Revenue Increase $38M
Test Year 11/30/2020
Test Year 12/31/2019
Settlement Summary
Commission Order Summary2
Settlement Filed 3/12/2021
Order Received 11/24/2020
Commission Order 11/17/2021
Effective Date 1/23/2021
Effective Date 12/1/2021
ROE 9.2%
Revenue Increase $295M
Cap Structure 50%D / 50%E
Rate Base $3.088B
$0M
ROE 9.7% Gross Revenue Increase
(Less $25.5M D&A)
Cap Structure 45.6%D / 54.4%E
Net Revenue Decrease $25.5M
Net Revenue Decrease $64M1 2 APCo immediately filed an appeal of the commission order with the
1 Approximately $60M of the filed vs. settled difference reflects the Virginia Supreme Court. While the court declined to expedite the
discontinuation of EE/DSM programs and movement of certain items appeal schedule and grant interim rates, the appeal remains on the
from base rates to riders; no earnings impact. normal timeline with a result expected in 2022.
27
MIZUHO U.S. UTILITY SUMMIT 2021 • AEP.COMCurrent Rate Case Activity
I&M - Indiana PSO
Docket # 45576 Docket # 202100055
Filing Date 7/1/2021 Filing Date 4/30/2021
Requested Rate Base $5.2B Requested Rate Base $3.293B
Requested ROE 10.0% Requested ROE 10.0%
Cap Structure 49.1%D / 50.9%E Cap Structure 47.0%D / 53.0%E
$104M $172M4
Gross Revenue Increase Gross Revenue Increase
(Less $7M D&A) (Less $57M D&A)
Net Revenue Increase $97M Original Net Revenue Increase $115M
Test Year 2022 Forecasted 6-Month Post Test Year Net Revenue
$70M5
Increase
Test Year 12/31/2020
Settlement Summary Pending Commission Approval
Settlement Filed1 11/16/2021
Settlement Summary Pending Commission Approval
Settlement Hearing 12/17/2021
Settlement Filed6 9/30/2021
ROE 9.7%
Hearing 10/5/2021
Cap Structure 50%D / 50%E
ROE 9.4%
Net Revenue Increase2,3 $61M
Cap Structure 47.0%D / 53.0%E
Expected Commission Order Q2-22
Net Revenue Increase $51M
1 Joint stipulation and settlement agreement reached with all parties but one
who is not opposing the settlement. Expected Commission Order Q4-21
2 Does not include $145M of Rockport Unit 2 costs moving from base rates 4 Does not include $71M of current riders moving to base rates.
to riders through the end of the Rockport Unit 2 lease term in December
2022; no earnings impact. 5 The change in net revenue ask is the result of a 6-month post test year adjustment
that included an additional $32M of current riders moving to base rates and $13M of
3 Revenue increases are recognized on a phased-in basis. The result is a rebuttal testimony adjustments.
$3M net increase beginning in Q2-22 and a $61M net increase beginning
6 Joint stipulation and settlement agreement reached with many parties to the case.
in January 2023.
28
MIZUHO U.S. UTILITY SUMMIT 2021 • AEP.COMCurrent Rate Case Activity
SWEPCO – Arkansas1 SWEPCO - Louisiana SWEPCO - Texas
Docket # 21-070-U Docket # U-35441 Docket # 51415
Filing Date 7/23/2021 Filing Date 12/18/2020 Filing Date 10/13/2020
Requested Rate Base $1.56B Requested Rate Base $2.1B Requested Rate Base $2.0B
Requested ROE 10.35% Requested ROE 10.35% Requested ROE 10.35%
Cap Structure 48.7%D / 51.3%E Cap Structure 49.2%D / 50.8%E Cap Structure 50.6%D / 49.4%E
$85M $114M $90M4
Gross Revenue Increase Gross Revenue Increase Gross Revenue Increase
(Less $29M D&A) (Less $41M D&A) (Less $17M D&A)
Net Revenue Increase $56M Net Revenue Increase $73M Net Revenue Increase $73M
Test Year 4/30/20212 Test Year 12/31/20193 Test Year 3/31/2020
Procedural Schedule Procedural Schedule Procedural Schedule
Intervenor Testimony 12/7/2021 Hearing 1/18/2022 Expected Commission
Q4-215
Order
Rebuttal Testimony 1/13/2022 Expected Commission
Q2/Q3-22
Hearing 3/15/2022 Order 4 Does not include $15M of current riders moving to base
3 Includes proposed pro-forma adjustment to plant in- rates.
Expected Commission
Q2-22 service through 12/31/2020.
Order 5 Commission voted to adopt PFD with certain modifications
1 during the 11/18/21 open meeting.
This filing provides notice of re-election for rate
regulation under a formula rate review mechanism.
2 Includes adjustments for reasonably known and
measurable changes through 4/30/2022, including
North Central Wind.
29
MIZUHO U.S. UTILITY SUMMIT 2021 • AEP.COMUntracked O&M
(in billions)
$4.0
$3.5
$3.0
$3.0 O&M focuses on
$3.0 $2.9 $3.0
$2.9 bending the O&M
$2.5 $2.7 $2.7 $2.7
$2.7
$2.5
$2.6 curve down
$2.0
O&M actual spend
represents adjusted
$1.5
spend throughout
$1.0
each year as needed
$0.5
$-
2012A 2013A 2014A 2015A 2016A 2017A 2018A 2019A 2020A 2021E 2022E
Untracked O&M Actuals/2021-2022 Bending the Curve Trajectory
Estimate Inflation @ 2%
Note: For comparative purposes, historical and projected O&M excludes Kentucky-related O&M expenses
30
MIZUHO U.S. UTILITY SUMMIT 2021 • AEP.COMO&M Optimization
Initiatives Actions
• Employee based O&M prioritization and optimization effort
• Driven down costs in 2020 and beyond, initial results imbedded in budgets
Achieving Excellence
• 2022 Program – new O&M savings ideas, evaluation of further study ideas and Future of Work opportunities
Program
• Future of Work – Optimization of Value Streams (end-to-end work flow) across the organization leveraging design thinking and technology
resources to develop the future state
• Distribution – Drive enhanced reliability which will lead to reduced O&M cost associated with storm restoration in the long term
• Supply chain – Optimize the material requisition process to improve material lead times, reducing stock outs and increasing crew productivity
Lean Management System
resulting in reduced O&M cost
Implementation/
• Fleet operations – Focus on reducing the number of vehicle platforms/options acquired and optimizing the acquisition process to reduce
Continuous Process
acquisition and maintenance costs
Improvement
• Generation (system productivity) – Fleet wide team-based focus on the reduction of waste associated with targeted plant systems, e.g. coal
handling, scrubbers
• Workforce optimization – Employee/contractor mix
Data Analytics • Hot socket model – Using AMI data to preemptively identify meters at risk
• Revenue protection – Detecting meter tampering
• Scrap metal billing and management
• Service Corp billing allocation factors
Automation
• No-bill workflow assignment process
• Customer workflow scheduling
Digital Tools • Generation Monitoring and Diagnostic Center – Predictive capabilities that save O&M and capital
• Storm damage assessment
• Real estate and land surveys
Use of Drones • Transmission facility inspections, construction monitoring and documentation
• Telecommunication tower inspections
• Cooling tower and boiler inspections
• Accounting and tax initiative
Outsourcing • Rapid application and information support
• Lockbox for customer payments by check
Workforce Planning • Approximately 4,000 employees will retire or leave in the next 5 years
• Reducing cost through procurement category management – Continuing to mature our Category Management program and aggressively
Strategic Sourcing
using strategic sourcing opportunities to optimize the value AEP receives from the $6B spent annually on goods and services
31
MIZUHO U.S. UTILITY SUMMIT 2021 • AEP.COMWeather Normalized Billed Retail Load Trends
AEP Normalized Residential GWh Sales AEP Normalized Commercial GWh Sales
% Change vs. Prior Year % Change vs. Prior Year
6% 6%
3.8%
3.2%
3% 3%
0.7%
0% 0%
0.0% -0.5% -0.2%
-0.8% -0.7%
-3% -3%
-2.5%
-4.2%
-6% -6%
-9% -9%
2018A 2019A 2020A 2021E 2022E 2018A 2019A 2020A 2021E 2022E
AEP Industrial GWh Sales AEP Normalized Retail GWh Sales
% Change vs. Prior Year % Change vs. Prior Year
6% 5.1% 6%
4.4%
3% 2.1% 3% 2.3%
1.5%
0.8%
0% 0%
-0.2%
-0.8%
-3% -3% -2.0%
-6% -5.3% -6%
-9% -9%
2018A 2019A 2020A 2021E 2022E 2018A 2019A 2020A 2021E 2022E
Note: 2021 estimates represent 9 months weather normalized actual results plus 3 month forecasted values. 2021/2022 comparisons may
change based on actual 2021 results. For comparative purposes, historical and projected load excludes Kentucky Power Company.
32
MIZUHO U.S. UTILITY SUMMIT 2021 • AEP.COMPension and OPEB Estimates
Qualified Pension Funding
Assumptions 2021E 2022E1
101% 99% 97% 102% 104% 104% 104%
96%
Pension Discount Rate 2.50% 3.15%
OPEB Discount Rate 2.55% 3.16%
Assumed Long Term Rate of
4.75% 4.75%
Return on Pension Assets
Assumed Long Term Rate
4.75% 4.75%
of Return on OPEB Assets
Pension/OPEB Funding $11M $135M
Pension/OPEB Cost2 $16M $22M
2016 2017 2018 2019 2020 Q1-21 Q2-21 Q3-21
Pension/OPEB Pre-tax Expense3 $(42M) $(35M)
1 The sale of Kentucky operations is not expected to materially impact 2022 assumptions
2 Pre-tax expense and pre-capitalization • YTD pension and OPEB returns were up at 2.3% and 4.7%, respectively, as
3 Recorded in O&M and Non-Service Cost Components of Net Periodic Benefit Cost on the income
strong equity returns were offset by fixed income losses, as yields increased
statement
since the beginning of the year.
• We expect combined pension and OPEB costs (pre-tax and including
capitalized portion) to increase from 2021 to 2022 due to lower than expected
actual returns in 2021, but the actual cost difference between 2021 and 2022
continues to be subject to potential changes in investment results, interest rates
and actuarial assumptions.
• Pension expense for regulated subsidiaries is recovered through base rates.
33
MIZUHO U.S. UTILITY SUMMIT 2021 • AEP.COMAEP Operational and Financing Structure
American Electric Power, Inc.
AEP Transmission Competitive
Regulated Utilities
Holding Company Operations
Appalachian Power Indiana Michigan AEP Transmission AEP Energy Supply
Joint Ventures
Company Power Company Company
Kentucky Power Public Service Company AEP Appalachian AEP Energy
Company1 of Oklahoma Transco
Southwestern Electric
AEP Ohio AEP Kentucky Transco1 AEP Energy Partners
Power Company
Wheeling Power Kingsport Power AEP Generation
AEP Ohio Transco
Company Company Resources
AEP Texas AEP Generating
AEP Oklahoma Transco AEP OnSite Partners
Company
AEP Indiana Michigan
AEP Renewables
Transco
Uses a combination of external LT financing and commercial paper
program
AEP West Virginia
Uses a combination of external and internal LT financing and money pool Transco
Uses internal LT financing and money pool
Uses a combination of external and internal LT financing
Note: Does not represent legal structure
1 In October 2021, AEP entered into an agreement to sell its Kentucky operations to Algonquin Power & Utilities. The sale is expected to close in Q2-22 pending regulatory approvals
34
MIZUHO U.S. UTILITY SUMMIT 2021 • AEP.COM2022 Debt Issuance and Maturities Overview
($ in millions)
$1,400
$1,200
$1,000
$800
$600
$400
$200
$- 1
AEP, Inc. AEG AEP Texas APCo/WPCo AEP Ohio PSO SWEPCO Transco
2022 Maturities 2022 Expected Issuances
Note: Pending close of sale of Kentucky operations in Q2-22, AEP proceeds will be net of Kentucky’s outstanding indebtedness. Additionally, any residual
proceeds may be used to reduce a small portion of other outstanding debt.
1 In November 2021, SWEPCO announced plans to redeem $275 million of 3.55% Senior Notes due in 2022
35
MIZUHO U.S. UTILITY SUMMIT 2021 • AEP.COMCredit Ratings
Current Ratings for AEP, Inc. and Subsidiaries (as of 11/15/2021)
Moody’s S&P Fitch
Senior Senior Senior
Company Unsecured Outlook Unsecured Outlook Unsecured Outlook
American Electric Power Company,
Inc. Baa2 S BBB+ N BBB S
AEP, Inc. Short Term Rating P2 S A2 N NR NR
AEP Texas Inc. Baa2 S A- N BBB+ S
AEP Transmission Company, LLC A2 S A- N A S
Appalachian Power Company1 Baa1 S A- N A- S
Indiana Michigan Power Company1 A3 S A- N A- S
Kentucky Power Company Baa3 S BBB+ N BBB+ S
AEP Ohio A3 N A- N A N
Public Service Company of
Oklahoma Baa1 S A- N A- S
Southwestern Electric Power
Company Baa2 S A- N BBB+ S
Transource Energy2 A2 S NR NR NR NR
1 In conjunction with the unenhanced VRDN remarketings, APCo and I&M both received short term credit ratings of A-2/P2 from S&P/Moody’s
2 NR stands for Not Rated
36
MIZUHO U.S. UTILITY SUMMIT 2021 • AEP.COMENVIRONMENTAL, SOCIAL AND GOVERNANCE ● ESG Leadership: Transparency and Performance ● Emission Reduction Goals ● Investing to Reduce Emissions ● Committed to Being a Top ESG Employer ● Board and Leadership Composition MIZUHO U.S. UTILITY SUMMIT 2021 • AEP.COM
ESG Leadership: Transparency and Performance

                                                        Rating: A
                                                   Average to Relative High
                                                        Performance

                                                ESG Risk Rating: 30.7
                                                        Scale of 0 – 40+
                                            Rank 21st percentile in subindustry group

                                                        Rating: 52
                                                     Scale of 0 to 100
                                              Ranked 3rd of 69 in industry group

                                                         Rating: C
                                                     Scale of D- to A+
                                              Ranked 5th decile in industry group

                                                  R-FactorTM Score: 69
                                                       Scale of 0 to 100
                                            Outperformer in industry (U.S. and global)

                                                                                        38
MIZUHO U.S. UTILITY SUMMIT 2021 • AEP.COM
Carbon Emission Reduction Goals
AEP’s Environmental, Social and Governance (ESG)
Reporting:
80% Corporate Accountability Report
Climate Impact Analysis Report (a TCFD report)
ESG Data Center (featuring 250+ ESG metrics)
by 2030 EEI ESG Sustainability Report
Net Zero Sustainability Accounting Standards Board (SASB)
CDP Survey Responses
GRI Report
by 2050 AEP also responds to investor-related surveys, including
MSCI and Sustainalytics
(both from a 2000 baseline)
Strategy to Achieve
Investments in renewable energy within and outside of our traditional
service territory
Technology deployment (e.g., energy storage)
Modernization of the grid with significant investments in transmission
and distribution
Increased use of natural gas
Optimization of our existing generating fleet
Electrification
39
MIZUHO U.S. UTILITY SUMMIT 2021 • AEP.COMInvesting to Reduce Emissions
Investment in Environmental Controls
Total
$ in millions
$9 Billion
$1,366 (Estimated)
$1,400
$1,200
$994
$1,000 $887
$811
$800
$599
$600 $540
$457 $424
$364 $340 $384
$400 $275 $304
$217 $241
$187 $136 $167
$200 $102 $116 $102 $134
$0
Total AEP System – Annual CO2 Emissions in million metric tons
200
167
153 154 158
146 146 145 151 151
150 135 136
132 2000-2020
122 123
115 Actual
102
100 93
72 69
58
CO2 74%
44
50
0
2000 2001 2002 2003 2004 2005 2006 2007 2008 2009 2010 2011 2012 2013 2014 2015 2016 2017 2018 2019 2020
Direct CO2 emission from AEP’s ownership share of generation as reported under Title IV of the 1990 Clean Air Act
40
MIZUHO U.S. UTILITY SUMMIT 2021 • AEP.COMInvesting to Reduce Emissions
98%
SO2
1990-2020
Actual
96%
NOx
2001-2020 98%
Actual Hg
41
MIZUHO U.S. UTILITY SUMMIT 2021 • AEP.COMCommitted to Being a Top ESG Employer
Recognizes companies that set the standard Benchmarking tool for businesses to report
in commitment to their stakeholders disability policies and practices
Recognizes organizations
with engaged workplace
cultures Annual measure of how
Recognizes companies that are equitably large businesses
trailblazers in their commitment to treat LGBTQ employees,
gender reporting and advancing Other Awards/Recognition consumers and investors
women’s equality - Newsweek’s Most Responsible Companies
- Fortune’s World’s Most Admired Companies
- JUST Capital’s Top 100 U.S. Companies Supporting
Healthy Communities and Families
- Forbes America’s Best Employers for Women
- Site Selection Magazine’s Top Utilities for Economic
Development
42
MIZUHO U.S. UTILITY SUMMIT 2021 • AEP.COMBoard and Leadership Composition
Russell 3000 companies who have 3 or more
women on their board of directors
43
MIZUHO U.S. UTILITY SUMMIT 2021 • AEP.COMGENERATION TRANSFORMATION • Delivering Clean Energy Resources • Regulated Renewables Opportunity • Regulated Renewable Requests for Proposals • North Central Wind Overview MIZUHO U.S. UTILITY SUMMIT 2021 • AEP.COM
Delivering Clean Energy Resources

      AEP's September 30, 2021 Renewable Portfolio (in MW)
                                                  Owned      PPA     Total
      Hydro, Wind, Solar and Pumped Storage
                                                   MW        MW      MW
      AEP Ohio                                       -       209      209

      Appalachian Power Company                     785      575     1,360

      Indiana Michigan Power Company                 56      450      506

      Public Service Company of Oklahoma            222     1,137    1,359

      Southwestern Electric Power Company           264      469      733

      Competitive Wind, Solar and Hydro            1,681     101     1,782

      Total                                        3,008    2,941    5,949

                            ~16,300 MW
                            Renewable Generation Interconnected Across the
                            U.S. via AEP’S Transmission System Today

                                                                             45
MIZUHO U.S. UTILITY SUMMIT 2021 • AEP.COM
Regulated Renewables Opportunity
~8 GW of planned Capacity need plus Total regulated renewable
retirements and expiring economic energy opportunity of ~16 GW by
PPAs over the next 10 years opportunity 2030
Regulated Generation Retirement and PPA
Expirations (MW) 2022-2030
1,129
~8 GW of planned
569 retirements and
1
expiring PPAs from
1,213 4,722
2022-2030 driving
capacity needs
Coal Natural Gas Natural Gas PPAs Wind PPAs
Opportunity Completed In Process Planned
~0.5 GW in-service in
RFPs have been issued Additional RFPs
~16 GW renewable 2021 with additional ~1
at APCo, PSO and planned in 2022 for I&M
opportunity by 2030 GW (NCW – Traverse)
SWEPCO and APCo
nearing completion
1 Does not include retirement of the 595 MW Cardinal Unit 1 in 2028 which is part of AEP’s unregulated generation fleet
46
MIZUHO U.S. UTILITY SUMMIT 2021 • AEP.COMRegulated Renewable Requests for Proposals
“Up To” RFP Regulatory Projected
Resource Type
MW Capacity Issuance Date Applications In-Service Date
Solar 5 January 2020 Q4-21 Q2-23
Solar 50 June 2020 Q4-21 – Q1-22 Q2-23
YE-23 – YE-25
Wind and Solar 300 February 2021 Q1-22 – Q4-22
Wind 3,000
June 2021 Q2-22 – Q2-23 YE-24 – YE-25
Solar / Storage 300
Wind 2,800
November 2021 Q2-22 – Q2-23 YE-24 – YE-25
Solar / Storage 1,350
Expected
Wind / Solar / Storage (TBD) Q1-23 – Q4-23 YE-25
Q1-22
Expected
Wind / Solar / Storage (TBD) Q1-23 – Q4-23 YE-25
Q1-22
Near-Term Integrated Resource Plan (IRP) Updates
IRPs set the stage for
new regulated
December 2021 renewable resource
Indiana
October 2021
November 2021 December 2021 additions
Virginia Clean Economy Act Arkansas
Oklahoma February 2022
(VCEA) Compliance Plan
Michigan
47
MIZUHO U.S. UTILITY SUMMIT 2021 • AEP.COMNorth Central Wind Overview
PSO and SWEPCO
Regulated Wind Investment
Total Rate Base Investment ~$2 billion (1,485 MW)
Estimated Commercial
Name MW
Investment Date
Apr. 14, 2021
Sundance 199 $300M
(100% PTC)
North Central Wind
North Central Wind - Maverick Sept. 10, 2021
Maverick 287 $400M
(80% PTC)
Jan. 2022 to
Traverse 999 $1,300M Apr. 2022
Approved MW Allocation (80% PTC)
Jurisdiction (Docket #) MW % of Project Net Capacity Factor 44%
PSO (PUD 2019-00048) 675 45.5% Customer Savings ~$3 billion (30-year nominal $)
SWEPCO – AR (19-035-U) 268 18.1% Developer Invenergy
Turbine Supplier GE
SWEPCO – LA (U-35324) 464 31.2%
Note: Facilities acquired on a fixed cost, turn-key basis at completion
SWEPCO - FERC 78 5.2%
Total: 1,485 100%
48
MIZUHO U.S. UTILITY SUMMIT 2021 • AEP.COMTRANSMISSION TRANSFORMATION ● Transmission Strategy ● Five-Year Capital Plan ● Investments in Asset Renewals ● Stable Cost Recovery Framework ● Transmission Customer and Shareholder Value ● Well Positioned to Capture New Investment ● Competitive and Off-footprint Investment ● Holdco Legal Entity Structure MIZUHO U.S. UTILITY SUMMIT 2021 • AEP.COM
AEP Transmission Strategy
AEP Transmission’s strategy is to modernize and enhance the reliability, security and efficiency of
the transmission network to provide our customers the grid of the future
Delivering significant
Diverse 5-year capital customer benefits:
investment portfolio of Disciplined execution:
Higher reliability and
$12.9 billion across resilience Low cost, high value
AEP’s broad solutions
geographic footprint Lower energy costs
High speed delivery
of 15 states and 3 Enabling public policies
regional energy and customer demand Technological
markets for clean energy innovation
Economic development
Stable Cost Recovery Framework
Deliver Value to Customers and Communities While Providing Predictable Earnings
Growth
50
MIZUHO U.S. UTILITY SUMMIT 2021 • AEP.COMFive-Year Transmission Capital Plan
2022-2026 Transmission Investment Categories
AEP’s transmission
$563
investment is well positioned
$1,231 From 2022 through 2026, to grow with renewable
Asset Replacement ~50% of AEP’s transmission
Customer Service capital investment will be
expansion while improving
$12.9
Local Reliability
Billion $6,909
deployed to modernize the reliability and meeting
$3,802 transmission grid and enhance
RTO Driven
reliability and resilience customer needs
Telecommunication
$392
Costs Supported by AEP Customers Costs Supported More Broadly
Asset Replacement Local Reliability Customer Service Telecom / Technology RTO-Driven Interconnection-Driven
• Asset renewal • Standards-driven • Upgrades to connect • Asset health monitoring, • Upgrades needed to • Projects to directly
investments based on projects to address new customers and cyber-security address RTO standards connect renewables and
condition, performance thermal and voltage enhanced service requirements and related to thermal other generation to the
Drivers
and risk to reduce violations, and improve requests enhanced situational voltage overloads and grid
customer outages and operational flexibility awareness for grid contingency conditions
• Facilitates local
interruption times operations
economic development • Opportunities driven by
enabling access to
renewable generation
51
MIZUHO U.S. UTILITY SUMMIT 2021 • AEP.COMInvestments in Asset Renewal Strengthen and Enable the Grid of the Future
AEP T-Line Age Profile
(Line Mile Age based on oldest conductor age) • $2.7 billion of annual on-system capital investment is
Life Expectancy Avg Age required to replace and enhance all assets beyond life
1,200
70 years 45.9 years expectancy over the next 10 years.
1,000
800
600
• Asset renewal projects are prioritized based on
400
performance, condition and risk.
200
0
AEP Transmission Line Circuit
1912
1916
1920
1924
1928
1932
1936
1940
1944
1948
1952
1956
1960
1964
1968
1972
1976
1980
1984
1988
1992
1996
2000
2004
2008
2012
2016
2020
Transformers
Assets Miles Breakers
Life Expectancy (Years) 70 60 50
AEP Transmission Transformer Age Profile
60 Current Quantity Over Life
6,107 208 808
Life Expectancy Avg Age Expectancy
50
60 years 32.2 years
40
Quantity That Will Exceed Life
30
4,513 165 329
Expectancy in Next 10 Years
20
10
Total Replacement Need Over
0
10,620 373 1,137
Next 10 Years
1912
1916
1920
1924
1928
1932
1936
1940
1944
1948
1952
1956
1960
1964
1968
1972
1976
1980
1984
1988
1992
1996
2000
2004
2008
2012
2016
2020
% of AEP System 30% 30% 12%
AEP Circuit Breaker Age Profile
800
Life Expectancy Avg Age Line Circuit
700
50 years 16.6 years Average Age (years) Transformers
600 Miles Breakers
500
400 2016 Year-End 52.5 36.1 22.9
300
200 2021 Year-End 45.9 32.2 16.6
100
0
1912
1916
1920
1924
1928
1932
1936
1940
1944
1948
1952
1956
1960
1964
1968
1972
1976
1980
1984
1988
1992
1996
2000
2004
2008
2012
2016
2020
Beyond Life Expectancy Range
52
MIZUHO U.S. UTILITY SUMMIT 2021 • AEP.COMStable Cost Recovery Framework
PJM SPP ERCOT
9.85% Base + 10.0% Base ROE +
ROE 9.4%
Stable and 0.50% RTO adder 0.50% RTO adder
transparent Forward Looking
Allowed two updates
wholesale cost Rates
Yes Yes per year
(not forward looking)
recovery for
Equity Structure Capped at 55% No Cap Capped at 42.5%
transmission
Rate Approval Date May 2019 June 2019 April 2020
FULL PARTIAL (T/R) PENDING/FORMULA OR
TRACKER/RIDER (T/R) RECOVERY BASE CASE
RECOVERY
~88% of
transmission
TN
capital investment TX WV OK
is recovered LA
AR
OH
through state
tracker/rider IN
MI
mechanisms VA
KY
Note: Arkansas retail formula not currently being utilized
53
MIZUHO U.S. UTILITY SUMMIT 2021 • AEP.COMDelivering Significant Customer and Shareholder Value
Shareholder Benefits Customer Benefits
AEPTHC Target Earnings
2022-2024
CUMULATIVE CAPITAL
INVESTMENT ($ BILLION) Reducing Enabling efficient economic dispatch
1.46-1.49 of generation in each of our regions
EPS
CONTRIBUTION 1.31-1.34 1.38-1.41 customer costs
1
$/SHARE 1.26-1.29
1.05 1.03
Facilitating the fast and reliable
Driving down interconnection of renewables to the
emissions grid to meet customer demand and
0.75
0.72 public policy goals for clean energy
Keeping the economy productive and
Improving connected by powering
reliability and communications networks and
electronics with reduced outages and
security a storm-hardened system
Supporting economic development
Creating through construction projects that
deliver community benefits including:
economic Jobs
benefits State and local taxes
AEPTHC’s 2017 – 2024 EPS growth projected Economic stimulus
at a CAGR of 10.8%
Note: Historical and 2021 estimated EPS includes 12 months of Kentucky Transco earnings. 2022
estimated EPS includes only 4 months of Kentucky Transco earnings.
1 Operating EPS decrease due to over collections in 2021 and related true-up in 2022.
54
MIZUHO U.S. UTILITY SUMMIT 2021 • AEP.COMWell Positioned to Capture Potential New Transmission Investment
Necessary to Link Clean Resource Rich Areas to Customers
Increased flows across regional seams will link clean,
resource-rich areas to customers and AEP is well-situated
to deliver competitive or non-competitive transmission
AEP’s Competitive Advantage solutions
Scale, Influence and Largest transmission owner in
Purchasing Power the U.S.
Investment Robust asset renewal program
Opportunities in Grid with technology upgrades (i.e.
of Future BOLDTM, 765kV)
Geographically diverse and
Strategically Located located on multiple market
seams
Established
Competitive Entity Transource is active in four
with Proven Track RTOs
Record
Savings to customers and
Culture of Innovation advantage in competitive
solutions
*Transource is AEP’s competitive-
regulated transmission company
Note: Portion of large-scale transmission investment may be subject to competitive bidding rules per current FERC policy
55
MIZUHO U.S. UTILITY SUMMIT 2021 • AEP.COMCompetitive and Off-footprint Transmission Investments
AEP is the largest developer of competitive and off-footprint transmission in the U.S. and is well
positioned to provide innovative solutions for future grid investment opportunities
Total Competitive
ROE and
AEP Joint Venture and Off-footprint AEP Ownership
Capital Structure
Company Investment ($ in millions)
(Debt/Equity)
($ in millions)
9.6% ROE
ETT1 $ 3,500 $ 1,750
60% / 40%
10.83% ROE
Transource2 $ 501 $ 433
44% / 56%
12.8% ROE
Prairie Wind $ 158 $ 40
45% / 55%
10.5% ROE
Pioneer $ 191 $ 96
50% / 50%
Total $ 4,350 $ 2,319
1 ETT investment includes legacy AEP investments contributed to the venture.
2 Transource investment includes Transource Missouri, Transource West Virginia and the estimated project cost of the
awarded project in Oklahoma. Due to the recent suspension of the IEC project in September 2021, IEC investment is not
included in the total estimate at completion. PJM will reevaluate the need for the IEC at the end of 2021 during its annual
reevaluation process.
56
MIZUHO U.S. UTILITY SUMMIT 2021 • AEP.COMAEP Transmission Holdco Legal Entity Structure
AEP Transmission Company, LLC (“AEP Transco”) is wholly-owned
American Electric Power, Inc. by AEP Transmission Holding Company, LLC (“AEP Transmission
Holdco”)
AEP Transmission Holding Co. LLC AEP Transmission Holdco is a wholly-owned subsidiary of American
Electric Power Company, Inc. (“AEP”), one of the largest utility
(“AEP Transmission Holdco”) holding companies in the U.S.
AEP Transmission Company, LLC Pioneer Electric Transource Electric Grid Assurance
(“AEP Transco”)1 Transmission, Transmission Energy, LLC Transmission
LLC America, LLC Texas, LLC
AEP Indiana Michigan AEP Appalachian $184M Net Plant Prairie Wind Transource
$3,204M
Transmission Co., Inc. Transmission Co., Inc. Transmission, Missouri, LLC
Net Plant
$3,271M Net Plant $98M Net Plant LLC
Transource West
AEP Kentucky AEP Oklahoma $134M Net Plant Virginia, LLC
Transmission Co., Inc. Transmission Co., Inc.
$165M Net Plant $1,312M Net Plant Transource
Maryland, LLC
AEP Ohio AEP West Virginia Joint Venture
Transmission Co., Inc. Transmission Co., Inc. Transource
$4,847M Net Plant $1,936M Net Plant Pennsylvania,
LLC
Total $11,629M Net Plant
$479M Net Plant
Joint Venture net plant balances are inclusive of non-affiliate share
Net plant totals as of 9/30/2021
1 Debt issued at AEP Transco level for transmission companies
57
MIZUHO U.S. UTILITY SUMMIT 2021 • AEP.COMUTILITY TRANSFORMATION
● Robust Distribution Capital Investment
Opportunities
● Grid Transformation
● Key Legislative Initiatives
● Technology and Innovation
MIZUHO U.S. UTILITY SUMMIT 2021 • AEP.COMRobust Distribution Capital Investment Opportunities
2022 – 2026 Distribution Capex Forecast Distribution Spend Categories
Capital
Investment Category Category Description Investment
(in billions)
8% Capacity Expansion,
Asset renewal and reliability investments
including pole, conductor, cutout, station
Reliability and $ 6.0
23% Modernization
transformer and breaker replacements and
capacity additions
13%
Investments for new service, upgrades,
Customer Requests $ 1.6
relocations
Implementation of automated technology
including distribution supervisory control and
$10.4 Billion Automation and data acquisition, smart switches and
$ 1.3
Technology reclosers, volt var optimization and sensors.
Investments include telecommunication and
system components
22% 21% Restoration and Sparing Storm restoration and spare equipment $ 0.5
Advanced Metering Advanced metering technology for the
$ 0.4
Infrastructure (AMI) remaining AEP customers
12% Investment in fiber assets to provide middle
Rural Broadband mile broadband to rural communities and for $ 0.3
company use
Investments in LED outdoor and streetlights
Green Technology $ 0.3
and electric vehicle charging infrastructure
AEP Texas APCo I&M
Total $ 10.4
AEP Ohio PSO SWEPCO
59
MIZUHO U.S. UTILITY SUMMIT 2021 • AEP.COMYou can also read