Monitoring coral bleaching using a colour reference card
←
→
Page content transcription
If your browser does not render page correctly, please read the page content below
Coral Reefs (2006)
DOI 10.1007/s00338-006-0123-8

 R EP O RT

U. E. Siebeck Æ N. J. Marshall Æ A. Klüter
Ove Hoegh-Guldberg

Monitoring coral bleaching using a colour reference card

Received: 8 August 2005 / Accepted: 27 April 2006
 Springer-Verlag 2006

Abstract Assessment of the extent of coral bleaching has        ont pigmentation (Brown 1997). Since 1979, large scale
become an important part of studies that aim to                 events (affecting tens to thousands of km2) have affected
understand the condition of coral reefs. In this study a        coral reefs with increasing frequency and severity
reference card that uses differences in coral colour was         (Hoegh-Guldberg 1999). Recent bleaching events (e.g.
developed as an inexpensive, rapid and non-invasive             1997–1998 and 2002) have damaged corals across large
method for the assessment of bleaching. The card uses a         areas of the world’s tropical oceans, with rates of mor-
6 point brightness/saturation scale within four colour          tality in some regions at some times exceeding 50% (e.g.
hues to record changes in bleaching state. Changes on           Western Indian Ocean, Wilkinson et al. 1999). Coral
the scale of 2 units or more reflect a change in symbiont        bleaching is triggered by a number of stressful events
density and chlorophyll a content, and therefore the            including warmer than normal temperatures (Coles and
bleaching state of the coral. When used by non-specialist       Jokiel 1977; Hoegh-Guldberg and Smith 1989; Glynn
observers in the field (here on an intertidal reef flat),         and D’Croz 1990; Goreau and Hayes 1994; Brown 1997;
there was an inter-observer error of ± 1 colour score.          Hoegh-Guldberg 1999). This association with elevated
This technique improves on existing subjective assess-          sea temperatures together with the fact that mass coral
ment of bleaching state by visual observation and offers         bleaching only appears in the scientific literature after
the potential for rapid, wide-area assessment of chang-         1979, suggest that these events are a response to the
ing coral condition.                                            current warming of the world’s oceans resulting from
                                                                anthropogenic climate change. Projections of future
Keywords Coral bleaching Æ Coral colour Æ                       change in sea temperature indicate that mass coral
Coral condition assessment Æ Reef condition Æ                   bleaching is likely to rise rapidly over the next
Global climate change Æ Monitoring                              30–50 years until it becomes an annual event (Hoegh-
                                                                Guldberg 1999). Under even modest predictive scenar-
                                                                ios, changes in the stress on coral reefs look likely to
Introduction                                                    cause the decline of coral communities worldwide.
                                                                    Assessing current and future rates of change in reef
Coral bleaching is characterised by the loss of dinofla-         condition is important to understanding how future
gellate symbionts (genus Symbiodinium) and/or symbi-            scenarios will affect coral reefs. Different methods have
                                                                been used to assess coral bleaching at varying scales.
Communicated by Ecology Editor P.J. Mumby                       Remote sensing techniques have proved useful since they
                                                                enable monitoring of large areas simultaneously (Dustan
U. E. Siebeck (&) Æ N. J. Marshall                              et al. 2000; Mumby et al. 2001; Hedley and Mumby
Vision Touch and Hearing Research Centre,
School of Biomedical Sciences, The University of Queensland,    2002). However, satellite or low altitude aerial images
St Lucia 4072 QLD, Australia                                    can be expensive, and are only really suitable in cir-
E-mail: u.siebeck@uq.edu.au                                     cumstances where the advantages of large spatial reso-
Tel.: +61-7-33654070                                            lution outweigh the large errors associated with the
Fax: +61-7-33654522                                             technique (Andréfouët et al. 2002; Hedley and Mumby
A. Klüter                                                      2002). Visual and video transects undertaken by swim-
Australian Institute of Marine Science, Townsville, Australia   ming or during manta tows are probably the most
                                                                widely used methods to assess the condition of individ-
O. Hoegh-Guldberg                                               ual reefs (Miller and Müller 1999). However, these
Centre for Marine Studies, University of Queensland,
St Lucia, Australia                                             methods are labour, equipment and time intensive, and
require trained field personnel. Other more detailed temperature was increased from ambient (28C) to 32C
investigations have involved measurement of photosyn- over 4 days (1C per day) and maintained there for a
thetic processes and related physiological parameters further day for four species (Pocillopora damicornis,
(e.g. Jones et al. 1998; Fitt et al. 2001). These methods Montipora digitata, Stylophora pistillata and Platygyra
are often used in combination with measures of symbi- daedalea) and for 3 more days for Acropora aspera. The
otic dinoflagellate density and chlorophyll a content of experimental set-up was similar to that used previously
the coral (e.g. Hoegh-Guldberg and Smith 1989). to simulate ‘‘natural’’ bleaching events (e.g. Hoegh-
Although this technique allows the physiological Guldberg and Smith 1989; Jones et al. 1998). Each day,
condition of individual coral colonies to be monitored all corals within the experiment were photographed to-
during stress, the need for specialist equipment and the gether with a colour standard, which consisted of five
time involved largely restricts this technique to the scale coloured areas (black, white, red, green and blue). One
of individual coral colonies. sample per species was removed daily for measurement
Observer based methods which rely on a subjective of symbiont density and chlorophyll a content.
assessment of coral colour are, by comparison, rapid Each sample was photographed at three different
and inexpensive but suffer from bias and differing exposures (+1, 0, 1) under identical illumination with
interpretation. For example, pale corals may be classi- an Olympus 4040 digital camera. The camera was set to
fied as ‘‘bleached’’ under some schemes while being manual so that the gain and white balance settings re-
accepted as ‘‘normal’’ under others. Methods based on mained constant. Photographs were analysed in Adobe
the simple categories ‘‘normal’’, ‘‘partially bleached’’, Photoshop V6 using the histogram function to deter-
‘‘bleached’’ and ‘‘dead’’ (e.g. Hoegh-Guldberg and mine the hue (reflected colour), saturation (proportion
Salvat 1995) may miss important information due to the of grey in the hue), and brightness (relative lightness and
limited number of categories. darkness) of the lightest part of five coral branches from
The present study first developed, and then evaluated each species at a constant distance from the tip (1–2 cm).
the usefulness of an observer based reference card con- An image from one of the three exposures was judged
sisting of four colour hues and a 6 point brightness/ suitable for use when the white colour standard was not
saturation scale to record visible differences in coral saturated (RGB values between 250 and 255), the RGB
colour, and thus, bleaching. The accuracy of the tech- values of the black standard were close to 0 and the
nique was assessed using conventional methods of RGB values for the red green and blue standards were
chlorophyll a analysis and symbiont density in a field similar (± 5 units). The purpose of the photographic
evaluation and also under controlled laboratory method was to provide reliable correlations between
bleaching. This was followed by a user trial to determine colour in standardised photographs and the colour of
the extent of observer bias and error. coral fragments at various stages of bleaching and
recovery, not absolute changes in real hue, saturation
and brightness (Endler 1990).
Materials and methods For the analysis of symbiont density and chlorophyll
a content, tissue was removed from the coral skeleton
Colour reference card development using a jet (WaterPikTM) of recirculated filtered seawater
(0.45 lm, Whatman Glass Microfibre filters GF/C). The
In order to develop a colour reference card which could slurry was then homogenized in a hand-held blender
be used across a wide range of coral species in different (ProMix duo, Krups Electronic Silver) for 45 s and the
symbiont/chlorophyll pigmentation states, a two-stage volume of the homogenate (between 50 and 100 ml)
approach was adopted. Firstly, a controlled laboratory recorded. Four aliquots of 10 ml were taken from the
bleaching was conducted to establish the relationship homogenate. One 10 ml aliquot was used immediately to
between colour and symbiont/chlorophyll content, using count the number of dinoflagellates using a Neubauer
five species of branching corals. Changes in pigmenta- Improved Haemocytometer with eight replicate counts
tion were recorded photographically and symbiont and for each aliquot. The total number of symbiotic dino-
chlorophyll were measured using conventional methods. flagellates per area was calculated using the volume of
Secondly, a photographic field survey of 200 corals was the homogenate and the coral surface area. Coral sur-
undertaken during a period of bleaching in order to face area was measured using the paraffin wax method
identify the most common colours associated with nor- of Stimson and Kinzie (1991). The other three (10 ml)
mally pigmented and bleached corals from a broad aliquots were frozen at 20C for later chlorophyll
range of species. a analysis using the methodology of Jeffrey and
Humphrey (1975). Aliquots (10 ml) were centrifuged at
3,500g for 15 min at 4C, the supernatant discarded, and
Controlled laboratory bleaching the pellet re-suspended in 5–10 ml of 100% acetone.
Chlorophyll a was extracted for 24 h in the dark at 4C.
Ten replicate branches from each of five different coral Samples were then centrifuged at 3,500g for 10 min
species were mounted on plasticine stubs and placed in at 4C and the optical density of the supernatant
a thermostatically controlled aquarium (±1C). The was measured at 630 and 663 nm on a Perkin Elmerspectrophotometer MBA 2000. Chlorophyll content was were not compared statistically, but rather only assessed
also standardized to surface area of the coral. qualitatively in the development of the card. Within each
of the four chosen colour categories (based on hue) from
the field measurements, it was therefore possible to
Field measurements of coral colour allocate a scale of decreasing brightness and increasing
saturation which represented an increase in symbiont
During a period of widespread bleaching, 200 corals density and chlorophyll a content. The final selection of
were photographed on the reef flat of Heron Island this scale was based on the requirement for each colour
(Great Barrier Reef) together with a colour standard. to be visually distinct. The resulting colour card had four
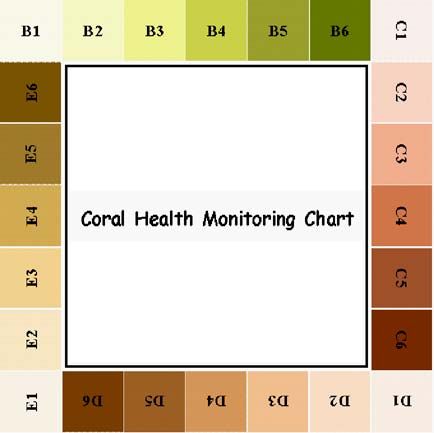
Corals were chosen to maximise the number of different colour hues with six gradations for each colour (Fig. 2).
colours as well as the number of brightness levels. For Each colour square on the card is identified by a letter
each coral, the brightest and darkest areas were selected indicating hue (b, c, d, e) and a number coding for
in the photograph and the average hue, brightness and brightness and saturation (1–6). Identical numbers
saturation were determined within a 25 · 25 pixel square therefore label colours with identical brightness and
as previously described. The resulting 400 colour values saturation levels. The card is used by finding the closest
were sorted according to hue and grouped into 4 colour match between one of the card colours and the coral.
categories (Photoshop hue levels: 8, 21, 31, and 50) to Since the principal change in coral colour observed
represent the range of hues found (hue 4–56). Blue and during the laboratory bleaching experiment was a result
purple colours were excluded since they are a result of of changes in brightness/saturation, the number scale
host pocilloporins rather than symbiotic dinoflagellates indicates the bleaching condition of the coral. However,
(Dove et al. 1995, 2001), and tend to remain for some slight hue changes can also occur when the coral skele-
time after the loss of the symbiotic dinoflagellates. ton or tissue contains green pigmentation (e.g. endolithic
algae) which is exposed as the symbionts are lost during
Combination of results to create colour reference card bleaching (Fine et al. 2004).
The thermal stress experiment showed that in bleached
corals, as symbiont density and chlorophyll a content Validation of the colour reference card
decreased, there was an accompanying increase in the
brightness of the corals, a decrease in saturation, but Accuracy of the technique to record symbiont density
almost no change in hue (Fig. 1). In the two species and chlorophyll a content
(Platygyra daedalea, Montipora digitata) where changes
in symbionts density or chlorophyll a were noticeably Because the purpose of the card is to record the pro-
less, the hue, saturation and brightness did not change. gression of corals from a healthy to a bleached state, and
Because of the lack of replicate samples these changes thus as a proxy for symbiont density and/or chlorophyll
a Acropora aspera Pocillopora damicornis Stylophora pistillata Platygyra daedalea Montipora digitata
colour scale (0-255)
250 brightness
saturation
200 hue
150
100
50
1 2 3 4 5 1 2 3 1 2 3 1 2 3 1 2 3
b 100 symbionts
80 chlorophyll a
% remaining
60
40
20
0
1 2 3 4 5 1 2 3 1 2 3 1 2 3 1 2 3
time (days)
Fig. 1 Laboratory bleaching experiment; a changes in brightness, and for hue 360 on the standard colour wheel. b Changes in
saturation, and hue values derived from photographic analysis. The symbiont density and chlorophyll a content
scale vale of 255 is equivalent to 100% saturation or brightness,Fig. 2 The Coral Colour Hue: 50
Reference Card developed for
standardizing changes in coral
colour. The hues are given for
the four different colour
categories arranged in groups
around the sides of the chart.
Brightness and saturation values
are given for one hue only since
they are identical for the same
numerical colour score for each
of the other hues
Hue: 8
Hue: 31
H: 21 H: 21 H: 21 H: 21 H: 21 Hue: 21
S: 255 S: 196 S: 196 S: 161 S: 151 Saturation: 148
B: 60 B: 95 B: 150 B: 190 B: 220 Brightness: 236
a content, it was necessary to determine the accuracy of the same coral. In the first trial, 33 students used the
the technique. The first stage involved a field study un- colour card to assess 6 branches of A. aspera which had
der similar conditions to those intended during use of been collected from the Heron Island reef flat. The
the card. assessments were made outside the laboratory in natural
In March 2002, at a time when corals were bleaching sunlight with the corals presented in individual white
on the Heron Island reef flat, 15 randomly selected containers filled with fresh seawater. In every case, each
colonies of branching Acropora spp. were marked using student independently determined the colour of the coral
numbered tags. Eight of the tagged colonies appeared branches 3 cm from the tip. The second trial was
very light in colour (colour score of 2 or less; ‘‘pale conducted under field conditions at low tide on the
group’’) while the remaining seven showed no signs of exposed reef flat, when 20 students recorded the colours
bleaching at the time of selection (‘‘dark group’’). Tissue of 6 marked colonies (3 branching and 3 massive).
samples were taken in March 2002 during the bleaching
event and again in May and June as the corals recovered
their colour. On each occasion, a small branch (3–6 cm Results
in length) was cut from each colony, and the colour
recorded using the colour card prior to measurement of Validation of the colour reference card
symbiont density and chlorophyll a content.
The second stag of the validation involved a repeat of Accuracy of technique to record symbiont density
the earlier laboratory bleaching experiment using only a and chlorophyll a content
single species (Acropora aspera). Symbiont density and
the colour card value were measured immediately fol- In March 2002 the pale group of corals had significantly
lowing collection and during the experiment when the fewer symbionts and lower chlorophyll a content than the
corals were judged exactly to match one of the colour dark corals (Mann Whitney: symbionts P = 0.0003,
scores (1–6). Three replicate branches were analysed for chlorophyll a P = 0.0059) (Fig. 3a). This was reflected in
each score value. a low colour score of 1.9 ± 0.14 (mean ± SE) for the
pale group compared to 4.9 ± 0.13 for the dark group
(Mann Whitney P < 0.0003). By May and June the pale
Observer validation corals regained colouration and there were no longer any
differences in any of the parameters. Analysing the same
Since the colour card is intended to be used by multiple data, there was a clear positive relationship between
untrained observers in differing field conditions, it was colour score and symbiont density (coefficient of de-
also necessary to evaluate the degree of variability termination r2 = 0.63, P < 0.0001) (Fig. 3b), but this
between observers in realistic conditions, each measuring relationship was much weaker for chlorophyll aa colour score symbiont density chlorophyll content
chlorophyll a µg cm-2
6
cells cm-2 (x106)
3 25
colour score
5 20
4 2 15
3
10
2 1
1 5
0 0 0
March May June March May June March May June
pale in March dark in March
b 5 40
chlorophyll a µg cm-2
4
cells cm-2 (x106)
30
3
20
2
10
1
0 0
1 2 3 4 5 6 1 2 3 4 5 6
colour score colour score
c 30
y= 4.79 x - 4.8
r2 = 0.93
cells cm-2 (x106)
20
10
0
1 2 3 4 5 6
colour score
Fig. 3 a Colour measurements, symbiont density, and chlorophyll each case data of 3 replicate measurements of the same 15
a content for 15 coral colonies sampled in March, May and June branching coral are shown. c Symbiont density and colour score in
2002 (mean ± SE). b Symbiont density and chlorophyll a content Acropora aspera during laboratory bleaching. Initial colour scores
as a function of the colour score. Box plot center = mean, outer of the dark branches and three replicate measurements for each
limit = 75% percentile, and range is shown by the whiskers. In colour score during progressive bleaching are shown
(r2 = 0.36, P < 0.0001). For symbiont density an between symbiont density and colour score (coefficient
ANOVA revealed a significant difference between colour of determination r2 = 0.93, P < 0.0001) (Fig. 3c) and
scores (F4,39 = 20.3, P < 0.001), but multiple post hoc it is possible that an improvement in performance can be
tests (Tukey tests) showed that a colour score difference of obtained by calibrating the reference card to each
at least 2 is consistently required to detect changes species. However, it is important to note that this
[between scores 2 and 4 (P = 0.01), 2 and 5 (P < 0.01), 2 experimental calibration artificially excluded intermediate
and 6 (P < 0.001), 4 and 6 (P < 0.001), and 5 and 6 colours which would be found in normal use.
(P < 0.001)]. A similar relationship also existed for
chlorophyll a (F4,39 = 13.22, P < 0.001) with differences Observer validation
between colour scores, 2 and 5 (P < 0.01), 2 and 6
(P < 0.001), 4 and 5 (P < 0.05), 4 and 6 (P < 0.01), and The field and laboratory observer trials demonstrated a
5 and 6 (P < 0.05,). Since only two samples were found variability of up to 3 colour scores between different
with a colour score of 3 and one with a colour score of 1, observers (Fig. 4a, b). In some cases this narrowed down
these scores had to be excluded from the analysis. to two scores, e.g. colour score 6 and 1 for the labora-
Results for the single species (A. aspera) laboratory tory trial, and score 2 for the field trial. The pooled
bleaching experiment showed an improved correlation standard deviation for the best case scenario (singlecoral species in the laboratory trial) was ± 0.5 scores, was 0.1 for the field measurements using 3 observers,
and in the worst case (field conditions, cloudy sky, rising doubling when the number of observers was increased to
tide, several species) ± 0.59. 6 (Fig. 4c).
Precision (standard error/mean) was then calculated
for subsets of 3, 6, 10 and 15 observers to evaluate the
change in variability with increased observer numbers. Discussion
The subsets were determined by randomly sampling the
data pool and the pooled standard deviation and stan- Bleaching, or the loss of symbionts and/or their pig-
dard error were then calculated for each subset. This mentation, is symptomatic of stress in reef-building
process was repeated ten times for each subset. Precision corals. Recent decades have seen an increase in both the
a Field
6 N=6 6 N=20
5 1 1 2 1 5 4 3 1 2 2
colour score
4 3 5 4 3 4 14 16 16 9 15
4
2 1 1 1 1 2 1 3 9 3
3 3
2 1 2 6
1 5 1 14
1 2 3 4 5 6 1 2 3 4 5 6
b Laboratory
6 N=6 4
6 N=33 1 20
5 1 3 4 2 13
5 9 15 16
colour score
4 5 3 2 3
4 22 17 16 16
3 3 3 2 1 17
2 2 3
1 6 1 30
1 2 3 4 5 6 1 2 3 4 5 6
coral sample coral sample
c Precision
0.15
field
precision se/x
0.1 lab
0.05
0
1 3 5 7 9 11 13 15
number of observers
Fig. 4 Variability between untrained observers. a Colour measure- observer measurements and means (grey; ± SD) for a sub sample
ments of six randomly selected coral colonies on the Heron Island of 6 and all 33 observers. c Change in precision (SE/mean) with
reef flat. Single observer measurements and means (grey; ± SD) increasing observer numbers for field and laboratory colour
for a sub sample of 6 and all 20 observers. Numbers indicate measurements. Precision calculations are made for 10 replicate
selection frequency of colour scores. b Colour measurements of 6 sub samples of 3, 6, 10 and 15 observers
Acropora aspera branches measured in the laboratory. Singlefrequency and intensity of mass bleaching events. Rapid, absolute measure of bleaching between species or be-
inexpensive and easy-to-use technologies can assist in tween locations. Additionally many species of coral are
understanding changes in reef condition that are now known to retract when subject to environmental stress,
occurring at global scales. The present study involved e.g. particularly on intertidal reef flats. In the more ex-
the development of one such tool, the colour reference treme cases such as Coeloseris mayerii, retraction during
card, for use in recording the bleaching status across a sub-aerial exposure can give rise to a marked ‘blanching’
broad spectrum of different coral species. of the coral surface which might be misinterpreted as
By analysing a large number of species in the field bleaching (Brown et al. 1994). Also, when using the card
and conducting an experimental bleaching of five spe- on branching corals care needs to be taken to adopt a
cies, it has been demonstrated that bleaching (as defined consistent sampling strategy. In this study colour mea-
by symbiont density and/or chlorophyll a content) surements were taken at a distance of about 3 cm from
principally involves change in colour brightness and the tip of branching corals to avoid the variations in
saturation of a coral, but not a change in hue. Slight colour that are frequently found in and around the axial
changes in hue, however, were also found in some coral polyp. Similar considerations may also apply to other
species during bleaching, possibly due to differences in coral morphologies where natural colour variation is an
skeletal colour, particularly at low symbiont concen- intrinsic feature.
trations when corals with white skeletons will have a Ensuring consistency of the method between different
different overall colour compared to corals with green users is also an important requirement. Multiple non-
skeletons due to the presence of endolithic algae (Fine specialist users obtained colour score values that fell
et al. 2004). It has been possible, therefore, to design a within a maximum range of three colour scores and
colour reference card using four hues to encompass although field conditions affected this (the standard
colour differences between species, whilst within each of deviation increased from ± 0.5 to ± 0.59 moving from
the hues, bleaching can be measured on a 6 point scale the laboratory to working on the reef flat at low tide) the
consequent upon changes in brightness and saturation. accuracy remained at ± 1 score because of the resolu-
It is important to define the accuracy of the technique tion of the scale. Also although the precision of the
when recording changes in coral colour using the 6 point technique can be improved by increasing the number of
scale in terms of changes in the bleaching state of the users, it is still not possible to improve the repeatability
coral. The logical yardstick for this involves the con- of observations beyond the ± 1 score value. It is
ventional measures of symbiont density and chlorophyll possible that with a finer scale (more than the present 6
a content. In multispecies use the changes in both sym- points) better results could be obtained but this would
biont density and chlorophyll content could be detected pose additional problems involving the ability to discern
by a separation of two colour scores, but not between smaller colour differences and may not be practicable.
adjacent scores. There was some evidence that this might This study has demonstrated that simple and cheap
be improved by calibrating the card to each individual techniques such as the colour reference card can improve
species but this would require further evaluation. the resolution of observer based measurements of coral
Two factors undoubtedly affect the accuracy of the bleaching compared to restricted categories such as
method namely that corals taken from the field may not ‘‘bleached’’, ‘‘partially bleached’’ and ‘‘healthy’’. The 6
match a colour category perfectly and are therefore as- point scale is also a direct indicator of coral symbiont
signed to the nearest category, and secondly, the diverse density and chlorophyll a content, albeit care must be
mix of species adds variability due to differences in tissue taken only to infer changes in bleaching state when
thickness and skeletal structure. The relationship colour differences are greater than 2 scale points.
between symbiont density and colour chart score was Although the technique cannot replace conventional
also weakest in the darkest corals indicating that at high measurements of bleaching, it has advantages of
symbiont densities the colour response has become sat- cheapness, speed, minimal training, and is non-invasive.
urated. The correlation of colour chart score to chlo- Potential uses are in wide area or long-term monitoring,
rophyll a was also weaker compared to correlations of possibly in conjunction with transect or quadrate sam-
symbiont density. This difference may be a consequence pling. Although it has not been tested underwater, the
of differences in the abundance of accessory pigments technique has the potential for use whilst snorkelling or
such as peridinin relative to chlorophyll a. That is, using SCUBA subject to further examination of ob-
colour may change due to peridinin concentrations server error in these circumstances.
which respond to changes in light and nutrient levels
Acknowledgments We thank Kylie Jennings, Kylie McPherson,
while chlorophyll a may remain constant (Iglesias-Prieto Collette Bagnato, David Logan, Craig Reid, Maria del Carmen
and Trench 1997). Gomez Cabrera, the staff of the Heron Island and Lizard Island
There are further caveats to the use of the technique. Research Stations, and Ian Osborn, the ranger on Green Island, for
For example, different species of corals will often have help and advice during this work. We thank the editors of Coral
different colour scores even when they are in a healthy Reefs for their constructive comments and discussion. This project
was supported by the Sustainable Tourism CRC, the Australian
condition. The colour card method is therefore more Research Council, The University of Queensland Vice Chancellor’s
appropriate for measuring changes in bleaching state in Strategic initiative fund and the Global Environmental Facility
the same species or colonies over time rather than as an Coral Reef Targeted Research project (http://www.gefcoral.org).The project was also generously sponsored by P&O, Daikyo, Goreau TJ, Hayes RM (1994) Coral bleaching and ocean ‘hot
Voyages Resorts and The Marine Teachers Association of spots’. Ambio 23:176–180
Queensland. We are grateful to the following organisations for help Hedley JD, Mumby PJ (2002) Biological and remote sensing per-
in distributing coral cards worldwide: Project Aware - PADI, Reef spectives of pigmentation in coral reef organisms. Adv Mar Biol
Check, GLOBE, NOAA. 43:277–317
Hoegh-Guldberg O (1999) Climate change, coral bleaching and the
future of the world’s coral reefs. Mar Freshw Res 50:839–866
Hoegh-Guldberg O, Smith GJ (1989) The effect of sudden changes
References in temperature, light and salinity on the population-density
and export of zooxanthellae from the Reef Corals Stylophora-
Andréfouët S, Berkelmans R, Odriozola L, Done T, Oliver J, Pistillata Esper and Seriatopora-Hystrix Dana. J Exp Mar Biol
Muller-Karger F (2002) Choosing the appropriate spatial res- Ecol 129:279–303
olution for monitoring coral bleaching events using remote Hoegh-Guldberg O, Salvat B (1995) Periodic mass bleaching of reef
sensing. Coral Reefs 21:147–154 corals along the outer reef slope in Moorea, French Polynesia.
Brown BE (1997) Coral bleaching: causes and consequences. Coral Mar Ecol Prog Ser 121:181–190
Reefs 16:S129–S138 Iglesias-Prieto R, Trench RK (1997) Acclimation and adaptation
Brown BE, Le Tissier MDA, Dunne RP (1994) Tissue retraction in to irradiance in symbiotic dinoflagellates. II. Response of
the scleractinian coral Coeloseris mayeri, its effect upon pig- chlorophyll-protein complexes to different photon-flux densi-
mentation, and preliminary implications for heat balance. Mar ties. Mar Biol 130:23–33
Ecol Prog Ser 105:209–218 Jeffrey SW, Humphrey GF (1975) New spectrophotometric equa-
Coles SL, Jokiel PL (1977) Effects of temperature on photosyn- tions for determining chlorophylls a, B, C1 and C2 in higher-
thesis and respiration in hermatypic corals. Mar Biol 43:209– plants, algae and natural phytoplankton. Biochemie und
216 Physiologie Pflanzen (BPP) 167:191–194
Dove SG, Takabayashi M, HoeghGuldberg O (1995) Isolation and Jones RJ, Hoegh-Guldberg O, Larkum AWD, Schreiber U (1998)
partial characterization of the pink and blue pigments of Temperature-induced bleaching of corals begins with impair-
pocilloporid and acroporid corals. Biol Bull 189:288–297 ment of the CO2 fixation mechanism in zooxanthellae. Plant
Dove SG, Hoegh-Guldberg O, Ranganathan S (2001) Major Cell Environ 21:1219–1230
colour patterns of reef-building corals are due to a family of Miller I, Müller R (1999) Validity and reproducibility of benthic
GFP-like proteins. Coral Reefs 19:197–204 cover estimates made during broadscale surveys of coral reefs
Dustan P, Chakrabarti S, Alling A (2000) Mapping and monitoring by manta tow. Coral Reefs 18:353–356
the health and vitality of coral reefs from satellite: a biospheric Mumby PJ, Chisholm JR, Clark CD, Hedley JD, Jaubert J (2001)
approach. Life Support Biosph Sci 7:149–159 Spectrographic imaging. A bird’s-eye view of the health of coral
Endler JA (1990) On the measurement and classification of colour reefs. Nature 413:36
in studies of animal colour patterns. Biol J Linn Soc 41:315–352 Stimson J, Kinzie RA (1991) The temporal pattern and rate of
Fine M, Steindler L, Loya Y (2004) Endolithic algae photoaccli- release of Zooxanthellae from the Reef Coral Pocillopora-
mate to increased irradiance during coral bleaching. Mar Damicornis (Linnaeus) under nitrogen-enrichment and control
Freshw Res 55:115–121 conditions. J Exp Mar Biol Ecol 153:63–74
Fitt WK, Brown BE, Warner ME, Dunne RP (2001) Coral Wilkinson C, Linden O, Cesar H, Hodgson G, Rubens J, Strong
bleaching: interpretation of thermal tolerance limits and ther- AE (1999) Ecological and socioeconomic impacts of 1998 coral
mal thresholds in tropical corals. Coral Reefs 20:51–65 mortality in the Indian Ocean: An ENSO impact and a warning
Glynn PW, D’Croz L (1990) Experimental-evidence for high-tem- of future change? Ambio 28:188–196
perature stress as the cause of El-Nino-coincident coral
mortality. Coral Reefs 8:181–191You can also read