MONTHLY INVESTOR PRESENTATION MARCH 2021 - ALTAGAS
←
→
Page content transcription
If your browser does not render page correctly, please read the page content below
Monthly Investor Presentation
March 2021

Forward-Looking Information
Forward Looking Information

This presentation contains forward-looking information (forward-looking statements). Words such as “guidance”, "may", "can", "would", "could", "should", "will", "intend", "plan", "anticipate", "believe", "aim", "seek", "propose", "contemplate", "estimate", "focus", "strive", "forecast", "expect", "project", "target", "potential",
"objective", "continue", "outlook", "vision", "opportunity" and similar expressions suggesting future events or future performance, as they relate to the Company or any affiliate of the Company, are intended to identify forward-looking statements. In particular, this presentation contains forward-looking statements with
respect to, among other things, business objectives, expected growth, results of operations, performance, business projects and opportunities and financial results. Specifically, such forward-looking statements included in this document include, but are not limited to, statements with respect to the following2021
Normalized EPS guidance of $1.45 - $1.55 per share; 2021 Normalized EBITDA guidance of $1.4 billion - $1.5 billion; self-funded $910 million 2021 capital program; anticipated contract type and counterparty credit quality in 2021; anticipated allocation of Utilities segment revenue between retail and commercial
customers in 2021; allocation of anticipated 2021 normalized EBITDA by segment and underlying drivers; 2021+ long-term vision and strategy; a targeted 130-150 bps improvement in WGL’s ROE over 2021; expected Utilities rate base growth through 2025; status and expected timing for decisions in pending rate
case settlements; expected allocation of utilities capital in 2021; anticipated export capacity; expected growth drivers for the Utilities and Midstream segments; estimated annual synergies of approximately $30 million within the combined platform with Petrogas; anticipated global demand for propane and butane
through 2030; Midstream and Utilities strategies; and advancement of AltaGas’ global export strategy. Such statements reflect AltaGas’ current expectations, estimates, and projections based on certain material factors and assumptions at the time the statement was made. Material assumptions include: dividend
levels; processing and fractionation volumes; number of ships and export levels from the Ferndale facility, current forward curves, effective tax rates, the U.S./Canadian dollar exchange rate, the impact of the COVID-19 pandemic, financing initiatives, propane price differentials, degree day variance from normal,
pension discount rate, the performance of the businesses underlying each sector, impacts of the hedging program, commodity prices, weather, frac spread, access to capital, timing and receipt of regulatory approvals, including pending rate cases, planned and unplanned plant outages, timing of in-service dates of
new projects and acquisition and divestiture activities, operational expenses, returns on investments, and dividend levels.

AltaGas’ forward-looking statements are subject to certain risks and uncertainties which could cause results or events to differ from current expectations, including, without limitation: risk related to COVID -19; health and safety risks; risks related to the integration of Petrogas; operating risks; regulatory risks; cyber
security, information, and control systems; litigation risk; climate-related risks, including carbon pricing; changes in law; political uncertainty and civil unrest; infrastructure risks; service interruptions; decommissioning, abandonment and reclamation costs; reputation risk; weather data; Indigenous land and rights
claims; crown duty to consult with Indigenous peoples; capital market and liquidity risks; general economic conditions; internal credit risk; foreign exchange risk; debt financing, refinancing, and debt service risk; interest rates; technical systems and processes incidents; dependence on certain partners; growth
strategy risk; construction and development; transportation of petroleum products; impact of competition in AltaGas' businesses; counterparty credit risk; market risk; composition risk; collateral; rep agreements; delays in U.S. Federal Government budget appropriations; market value of common shares and other
securities; variability of dividends; potential sales of additional shares; volume throughput; natural gas supply risk; risk management costs and limitations; underinsured and uninsured losses; commitments associated with regulatory approvals for the acquisition of WGL; securities class action suits and derivative
suits; electricity and resource adequacy prices; cost of providing retirement plan benefits; labor relations; key personnel; failure of service providers; compliance with Section 404(a) of Sarbanes-Oxley Act; and the other factors discussed under the heading "Risk Factors" in the Corporation’s Annual Information Form
for the year ended December 31, 2020 and set out in AltaGas’ other continuous disclosure documents. Many factors could cause AltaGas' or any particular business segment's actual results, performance or achievements to vary from those described in this press release, including, without limitation, those listed
above and the assumptions upon which they are based proving incorrect. These factors should not be construed as exhaustive. Should one or more of these risks or uncertainties materialize, or should assumptions underlying forward-looking statements prove incorrect, actual results may vary materially from those
described in this presentation as intended, planned, anticipated, believed, sought, proposed, estimated, forecasted, expected, projected or targeted and such forward-looking statements included in this presentation, should not be unduly relied upon. The impact of any one assumption, risk, uncertainty, or other
factor on a particular forward-looking statement cannot be determined with certainty because they are interdependent and AltaGas’ future decisions and actions will depend on management’s assessment of all information at the relevant time. Such statements speak only as of the date of this presentation. AltaGas
does not intend, and does not assume any obligation, to update these forward-looking statements except as required by law. The forward-looking statements contained in this presentation are expressly qualified by these cautionary statements.

Financial outlook information contained in this presentation about prospective financial performance, financial position, or cash flows is based on assumptions about future events, including economic conditions and proposed courses of action, based on AltaGas management's (Management) assessment of the
relevant information currently available. Readers are cautioned that such financial outlook information contained in this presentation should not be used for purposes other than for which it is disclosed herein.

Additional information relating to AltaGas, including its quarterly and annual MD&A and Consolidated Financial Statements, AIF, and press releases are available through AltaGas' website at www.altagas.ca or through SEDAR at www.sedar.com.

Non-GAAP Measures

This presentation contains references to certain financial measures that do not have a standardized meaning prescribed by US GAAP and may not be comparable to similar measures presented by other entities. The non-GAAP measures and their reconciliation to US GAAP financial measures are shown in AltaGas’
Management's Discussion and Analysis (MD&A) as at and for the period ended December 31, 2020. These non-GAAP measures provide additional information that management believes is meaningful regarding AltaGas' operational performance, liquidity and capacity to fund dividends, capital expenditures, and
other investing activities. Readers are cautioned that these non-GAAP measures should not be construed as alternatives to other measures of financial performance calculated in accordance with US GAAP.

EBITDA is a measure of AltaGas' operating profitability prior to how business activities are financed, assets are amortized, or earnings are taxed. EBITDA is calculated from the Consolidated Statements of Income using net income (loss) after taxes adjusted for pre tax depreciation and amortization, interest expense,
and income taxes. Normalized EBITDA includes additional adjustments for transaction costs (recoveries) related to acquisitions and dispositions, merger commitment costs (recoveries) due to a change in timing related to certain WGL merger commitments, unrealized losses (gains) on risk management contracts,
non-controlling interest of certain investments to which HLBV accounting is applied, losses on investments, gains on sale of assets, restructuring costs, dilution loss and other adjustments to equity income related to the acquisition of Petrogas, gain on re-measurement of previously held equity investment in AIJVLP,
COVID-19 related costs, provisions on assets, provisions on investments accounted for by the equity method, distributed generation asset related investment tax credits, foreign exchange losses (gains), and accretion expenses related to asset retirement obligations. In addition to the dilution loss, the other
adjustments to equity income primarily included amounts related to severance, transaction costs, and impairment losses related to the acquisition of Petrogas. COVID-19 related costs normalized in 2020 were primarily comprised of credit losses that were incremental and directly attributable to the COVID-19
pandemic and charges incurred to support remote work arrangements. AltaGas presents normalized EBITDA as a supplemental measure. Normalized EBITDA is used by Management to enhance the understanding of AltaGas' earnings over periods. The metric is frequently used by analysts and investors in the
evaluation of entities within the industry as it excludes items that can vary substantially between entities depending on the accounting policies chosen, the book value of assets, and the capital structure.

Normalized earnings per share or normalized EPS is calculated with reference to normalized net income. Normalized net income represents net income (loss) applicable to common shares adjusted for the after-tax impact of transaction costs (recoveries) related to acquisitions and dispositions, merger commitment
costs (recoveries) due to a change in timing related to certain WGL merger commitments, unrealized losses (gains) on risk management contracts, losses on investments, gains on sale of assets, provisions on assets, provisions on investments accounted for by the equity method, restructuring costs, dilution loss
and other adjustments to equity income related to the acquisition of Petrogas, gain on re-measurement of previously held equity investment in AIJVLP, COVID-19 related costs, gain on redemption of preferred shares, unitary tax adjustment related to the acquisition of WGL and U.S. asset sales, and statutory tax rate
change. Normalized net income is used by Management to enhance the comparability of AltaGas’ earnings, as it reflects the underlying performance of AltaGas’ business activities.

                                                                                                                                                                                                                                                                                                                                         2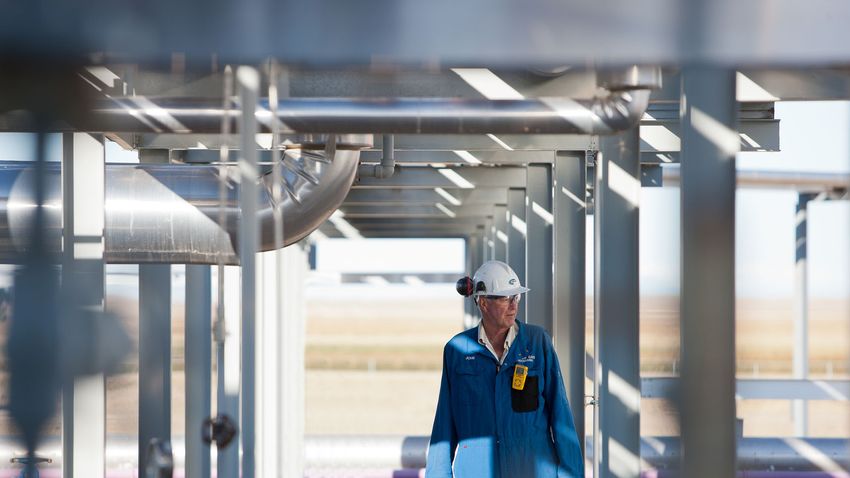
Who We Are
   Our               A Leading North American infrastructure company that connects NGLs and natural gas to
 Vision              domestic and global markets.

   Our               To improve quality of life by safely and reliably connecting customers to affordable sources
Mission              of energy for today and tomorrow.

    Our              Every day our team of approximately 3,000 people strong is guided by our core values.
 Values              These values are not negotiable. They are our fuel, foundation and focus.

                                                                      Our Foundational Principles:
                                                                      Access to reliable and affordable energy is fundamental in the pursuit of improved
                                                                      quality of life, reduced physical strains, improved access to education, and to fuel
                                                                      economic expansion. At AltaGas, we take our responsibility in delivering energy
                                                                      seriously. At our core, we are committed to maintaining safe and reliable
Work Safely,   Act With      Make       Achieve    Invest in our
                                                                      operations, delivering the critical energy our customers need, and honoring
   Think       Integrity   Informed     Results   People & Foster     the social and moral contract that we have with the communities we serve.
Responsibly                Decisions                 Diversity

                                                                                                                                                         3
Understanding Our Business
Who We Are: A leading North American energy What We Do: Operate a diversified, low-risk, high-growth Our Core
infrastructure company that connects NGLs and Utilities and Midstream business that is focused on delivering
natural gas to domestic and global markets. resilient and durable value for our stakeholders.
Values Work Safely, Act with Make Informed Achieve Invest in our People &
Think Responsibly Integrity Decisions Results Foster Diversity
Integrated Midstream Business – from wellhead to global markets
Contract Type5 Contract Type5
Gas Gathering NGL Extraction Transportation, Global
1 Wellhead 2 & Processing 3 & Fractionation 4 Storage & 5 Export 6 Markets
Rail Logistics
GAS NGLs C3 & C4 C3 & C4 C3 & C4
Midstream
§ Take-or-Pay & § A- and Above
Legend: ~4,700 rail cars, >6 MMBls >130,000 Bbls/d3 VLGC to Asia Cost-of-Service § BBB+ to BBB-
C5
1
2.25 Bcf/d Processing 64,000 Bbl/d2 Storage, >125 trucks, >250 § Fee-for-Service § BB+ to BB-
6 Facilities: North Pine, Export capability & Global Markets § Merchant – Hedged § B+ and Below
AltaGas 12 Facilities: Townsend, trailers: FSK rail/truck; Sarnia, 2 Terminals: RIPET, § Merchant -
Harmattan, EEEP,
Aitken Creek, Nig Creek, Strathcona & Griffith storage; Ferndale Unhedged
Midstream JEEP, PEEP, Younger
Harmattan, Gordondale, Townsend truck & rail; NGL pipelines, VLGC to Asia &
Activities
42
Blair Creek, EEEP, JEEP, treating & storage Global Markets
Third-party PEEP & Younger Sales: Local and U.S.
Markets
Fort Saskatchewan - Local Travel: 10-11 Days
vs. 25 U.S. GC %
Blending Midstream
Regulated Gas Distribution: US$4.3B Rate Base (High single digit growth - 2021 - 2025)
57%
Utilities
Storage and Transportation 1% Corporate/Other
180 miles of transmission pipe;
1 ~541,000 customers 37 Bcf of storage capacity
Other Services
1 • Leverage utility storage and Efficiency, Technology,
2 ~502,000 customers Transportation and Generation
Utilities
transportation resources to a
2 derive a profit through physical
3 ~166,000 customers and financial contracts (shared). 2021e Utility Revenues
5
3 Retail Energy Marketing
4 ~313,000 customers Sell natural gas and power directly § Residential
to residential, commercial, and § Commercial
4 industrial customers & Industrial
5 ~149,000 customers
Credit Ratings
~3,000 ~$21.5B $5.6B $13.8B 5.1% $1.45-$1.55 $1,400-$1,500M $910M
(ALA-TSX) Employees Total Assets Market Cap4 EV4 Dividend Yield4,6 2021E EPS5 2021E EBITDA5 2021E Capex5 Fitch: BBB (stable) DBRS: BBB(low/stable) S&P: BBB- (stable)
Notes: 1. Based on ALA working interest capacity in FG&P and extraction 2. Based on ALA 100% working interest facilities and ALA % capacity in non-operated facilities 3. Includes RIPET and Ferndale 4. As at February 25, 2021.
5. Based on 2021 guidance 6. Reflects dividend increase announced on December 10, 2020. See "Forward-looking Information.
4
Rate Regulated Utilities Provide Stability and Growth
~57% of 2021e normalized EBITDA1 from Utilities Segment

                                                                                                                            2021e Utility Revenues

                                                                                     1   Alaska:   ~147,000 customers
    1.7 million customers in stable
    and growing jurisdictions                                                        2   Michigan: ~307,000 customers            30%

    ~70% of Utilities revenue protected                                              3   Maryland: ~496,000 customers

                                                                                                   r
    § Fixed distribution charges                                                     4   DC:       ~164,000 customers                           70%
    § Decoupled rate structures

                                                                                                                             r
      in Maryland and Virginia                                                       5   Virginia: ~535,000 customers

                                                                                                                                 Residential
    Expect limited sensitivity
                                                                                                                                 Commercial & Industrial
    on unprotected revenue
    § Currently in lower demand                                                                                   3     2
      spring and summer
                                                                                                                  4
    § ~70% of revenue derived
      from residential customers                                                                              5

    § Uncollected revenue applied
      for in future rates

                  1. Non-GAAP financial measure; see discussion in the advisories.
                     See "Forward-looking Information”                                                                                                 5
Premier Midstream Business
Leveraging Core Export Strategy Structural Advantage to Markets in Asia

         Leverage core export strategy and access to
         premium global pricing to attract volumes

         ~70% from investment grade customers

         ~65% from take-or-pay contracts and fee-for-service

         ~70% of 2021 RIPET volumes hedged (includes tolling);
         plan continued active hedging in 2021

                        2021e Normalized EBITDA1
       Credit Quality                                          Contract Type
         8%                                                       17%
                                                                                            §   Take-or-Pay &
               19%                                                                              Cost-of-Service
 22%                     §   A- and Above                                                   §   Fee-for-Service
                         §   BBB+ to BBB-                                          48%      §   Merchant –
                         §   BB+ to BB-                      20%                                Expected to
                         §   B+ and Below                                                       be Hedged
                                                                                            §   Merchant –
                                                                    17%                         Less likely to
              51%
                                                                                                be Hedged

                                 1. Non-GAAP financial measure; see discussion in the advisories.
                                    See "Forward-looking Information”                                             6
Corporate Counterparty Credit

       ~87% of 2021e normalized EBITDA1 from
       Utilities and investment grade counterparties

       Credit Quality                                                               Counterparty Credit Risk Mitigants:

                                                                                        57% Utilities with ~1.7 million customers

                                                    Utility & A                         Diversified Midstream customer base

                             22%                    BBB                                 Letters of credit, parental guarantees
 65%
                                                    BB                                  Gas marketing and netting agreements
                                                    B+
                          9%                                                            Access to premium pricing in Asia
                  3%
                                                                                        Midstream customers located in
                                                                                        world-class Montney resource play

                 1. Non-GAAP financial measure; see discussion in the advisories.
                    See "Forward-looking Information”                                                                               7
Corporate Contract Mix
~79% of 2021e normalized EBITDA 1 from rate
Top 5 producers
regulated
2020e utilities and take or pay contracts
Contract Type
~86% of 2021e normalized EBITDA1 underpinned
6% Utilities by low-risk regulated and contracted assets (take-
8% or-pay and fee-for-service)
Take or Pay
7% Merchant normalized EBITDA largely underpinned
Fee for service by energy export strategy and demand pull from
Asia
57%
Merchant - Likely to be
21% Hedged ~35% of RIPET’s 2021e volumes are under long-
Merchant - Less likely term take or pay arrangements with an average
to be Hedged remaining term of ~7 years
1. Non-GAAP financial measure; see discussion in the advisories.
See "Forward-looking Information” 82020 Key Accomplishments
Strong execution and focus positions AltaGas for durable long-term value creation
Operational Priorities Financial Priorities
Utilities Achieved upper-end of previously stated 2020 Normalized
Closed the ROE gap at WGL by 150 bps, meeting our target EBITDA1 guidance range ($1.275 - $1.325 billion) and exceeded
previously stated 2020 Normalized EPS guidance range ($1.20 -
Successfully reduced leaks by >15% Y/Y and greatly improved $1.30)
the customer experience
Deployed ~$900 million self-funded capital program
Generated more timely recovery of expenses and returns on
capital deployed through operational discipline Executed ~$440 million of non-core asset sales
Delivered critical, clean and affordable natural gas in a safe and Refinanced 2020 debt maturities at lower interest rates
reliable manner, amidst the COVID-19 pandemic Continue to de-lever the capital structure, maintain investment
grade credit rating, and stagger, extend and de-risk AltaGas’
maturity profile
Midstream
Completed Townsend 2B (200 MMcf/d) and North Pine (10,000 Improved 2020 financial indicators
Bbl/d) expansions
Continued to ramp up and de-risk volumes at the RIPET export
facility achieving the 50,000 Bbl/d exit target, despite COVID-19
headwinds ~12% ~14%
Significantly advanced global energy export strategy through
increased operational ownership in Petrogas 2020 Run-rate
2020 Normalized EPS Growth
Normalized EBITDA Growth 2
Materially de-risked counterparty credit exposure and alignment
with industry-leading operators in NEBC
Notes: 1. Non-GAAP financial measure; see discussion in the advisories; 2. Represents growth in the core businesses net of the impact of $117 million in lost EBITDA in 2020 associated with 2019 asset sales.
See "Forward-looking Information“ 92021 Financial Guidance Highlights ($CAD unless otherwise noted)
Our corporate priorities are on delivering, de-levering,
de-risking, investing and executing across all business segments.
4% $1.45 - 1.55
$1.45-1.55 $1.4 -1.5B ~$910M
Anticipated Normalized
Annual Dividend Increase Anticipated Normalized Anticipated Normalized Planned Capital Program
EPS 1
EPS 1 EBITDA1
We’re building a diversified, low-risk, high-growth energy infrastructure business that is focused on
delivering resilient and durable value for our stakeholders. Our goal is compounding returns over time.
1. Non-GAAP measure; see discussion in the advisories
See "Forward-looking Information" 10Utilities
Utilities Strategy - Drive Operational Excellence
                                            Priorities

                                                Maintain safe and reliable infrastructure

                                                Enhance overall returns via complementary
           Utilities                            businesses and cost-reduction initiatives
         Distribution
                                                Attract and retain customers through
                                                exceptional customer service

                                                Improve asset management capabilities
     Leveraging our Core
     Distribution Footprint

                    Enhance the value proposition for our customers

                                                                                            12
WGL ROE Strategy
Path to earning our allowed returns at WGL
Strategy in place with a clear line of sight to reach allowed returns during 2021
Key initiatives to achieving allowed returns:
Anticipated Return On Equity
1. Capital Discipline: & Expected Timeline
§ Accelerated Replacement Programs ensure
timely recovery of invested capital ~9.4%
§ Drive returns through the execution of 150 bps
strategic projects ROE
2. Rate Cases: update rates to reflect current
plant and operating costs
§ DC rate case filed on January 13, 2020; Settlement
Agreement approved Feb 24, 2021; New rates to be
effective April 1, 2021. 1 Expected Early 2021 End
§ MD rate case filed on August 28, 2020; decision Timeframe 2021 2021
expected around end of Q1 2021
3. Cost Management:
§ Optimization and cost-reduction initiatives underway
§ Leak remediation program launched with expected
cost-savings realized through to year-end 2021 Current DC/MD Ra te Case Order Cost Reduction 2021e
Initiativ es
See "Forward-looking Information“ 13Utilities Segment Capital Spend
Disciplined approach to capital focused on strategic projects and Accelerated Replacement Programs
ARP programs are designed for improved safety and reliability, better customer
outcomes and environmental benefits. They also provide immediate returns and
increase capital efficiency.
2020e Utilities Capital1 2021e Utilities Capital
~US$510 million ~US$565 million
New
Business
New Business 13%
20%
ARP ARP
41% 46%
Maintenance
41%
Maintenance Increased utilization of ARPs Managing
39% maintenance
spending to align
with depreciation
1) 2020e Utilities Capital updated for most recent internal forecast
See "Forward-looking Information“ 14Summary of Recent Rate Case Filings
Focused on timely recovery of capital
Most Recent Equity
Revenue ROE
Rate Case Filed Thickness
SEMCO (Michigan) Filed May 31, 2019 Received: US$19.9MM Received: 9.87% Received: 54%1
WGL (Maryland) Filed August 28, 2020 Requested: US$28.4MM Requested: 10.45% Requested: 54.55%
CINGSA (Alaska) Filed in 2018 Received: US($9)MM Received: 10.25% Received: 53%
WGL (Virginia) Filed July 31, 2018 Received: US$13.2MM Received: 9.2% Received: 53.5%
WGL (DC) Filed January 13, 2020 Received: US$19.5MM Received: 9.25% Received: 52.1%
1. Represents SEMCO’s permanent equity capital, excludes effect of deferred income tax.
See "Forward-looking Information" 15Supportive Regulatory Environment for Utilities
2020 YE Allowed ROE
Utility Rate Base Customers and Equity Regulatory Update
($US) Thickness
§ Distribution rates approved under cost of service model.
§ Projected test year used for rate cases with 10 month limit to issue a rate order.
§ Rate case filed in May 2019 settled in November and approved in December.
SEMCO 9.87%
$719MM ~313,000 New rates effective January 1, 2020.
Michigan 54%1
§ Settlement terms include a rate increase of US$19.9 million, a renewed Main
Replacement Program (MRP) from 2021-2025, and a new Infrastructure
Reliability Improvement Program (IRIP) 2020-2025.
§ Distribution rates approved under cost of service model using historical
ENSTAR 11.875% test year and allows for known and measurable changes.
$256MM ~149,000
Alaska 51.81% § Rate Order approving rate increase issued on September 22, 2017.
Final rates effective November 1, 2017.
§ Distribution rates approved under cost of service model using historical
ENSTAR, 3 test year and allows for known and measurable changes.
CINGSA electric utilities 10.25% § Rate case filed in 2018 based on 2017 historical test year.
$66MM2
Alaska and 5 other 53.00% § Rate case decision issued in August 2019.
customers § Required to file next rate case by July 1, 2021 based on 2020 test year.
1. Reflects SEMCO permanent capital excluding effect of deferred income tax.
2. Reflects 65% ownership 16
See "Forward-looking Information"Supportive Regulatory Environment for Utilities
2020 YE Allowed ROE
Utility Rate Base Customers and Equity Regulatory Update
($US) Thickness
§ Distribution rates approved under cost of service model.
§ Rate case filed on July 31, 2018. On December 20, 2019 the Commission granted
Virginia 9.20% US$13.2 million rate increase which reflected the transfer of revenues associated with the
~540,000
53.5% US$102 million of SAVE investment from the SAVE rate rider to base rates; (ii) an ROE of
9.2%; (iii) the amortization of unprotected excess deferred income tax over eight years;
and (iv) the refund of US$25.5 million TCJA liability over a 12-month period as a sur-credit.
§ Distribution rates approved under cost of service model.
§ Rate case filed on August 28, 2020 to increase base rates by $28.4 million, including $5.8
million currently collected through its strategic infrastructure development and
enhancement, or STRIDE, rider. This results in a $22.6 million, or 3.95%, net overall non-
9.70% gas revenue increase being proposed.
Maryland ~500,000
$3.3B 53.5% § The proposed rate requested a 10.45% ROE with 54.55% equity thickness based on a
rate base valued at $1.225 billion for a test year ended March 31, 2020.
§ Rebuttal testimony filed December 8. Evidentiary hearing held January 7 to 11, 2021.
§ New rates from this application is expected to take effect around late March 2021.
§ Distribution rates approved under cost of service model.
§ Filed rate case on January 13, 2020 to increase base rates
§ Settlement agreement filed December 8, 2020 includes an increase in base rates by
Washington 9.25% US$19.5 million, including approximately US$9 million pertaining to a PROJECTpipes
~165,000
D.C. 52.1% surcharge that customers are currently paying in the form of a rate rider.
§ The settlement agreement also includes a 9.25% ROE with a 52.1% equity thickness
§ Settlement Agreement approved Feb 24, 2021. New rates to be effective April 1, 2021.
See "Forward-looking Information“
Notes: 1) Settlement Agreement filed December 8, 2020; awaiting Commission approval. 17Accelerated Replacement Program
Utility Location Program
§ 2019 rate case settlement provides for a renewed Mains Replacement Program for 2021-2025 with total
Michigan spending ~ $60 million and the introduction of a new Infrastructure Replacement Improvement Program
for 2020-2025 with total spending ~$55 million beginning in 2021.
§ Authorized to invest US$500M, including cost of removal over a five-year calendar period ending in 2022.
Virginia § Expect to incur approximately US$130 million SAVE capital expenditure in 2021.
Maryland § STRIDE renewal approved in 2018 to be US$350M over 5 years (2019-2023).
Washington § On December 11, 2020, the Commission approved a US$150 million, three-year PROJECTpipes 2
D.C. plan from 2021-2023.
> US$1B of Approved ARP Capital Projects in Place
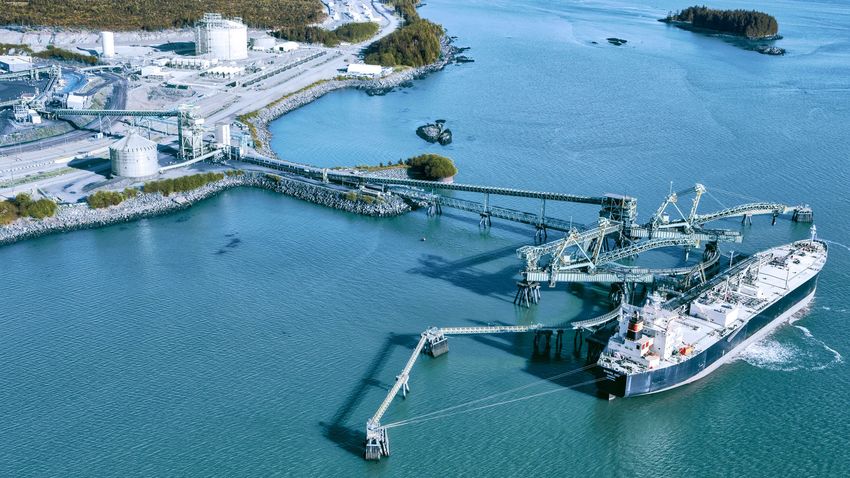
See "Forward-looking Information" 18Midstream
Our Midstream Strategy is Straightforward
Maximize utilization of existing assets and pursue capital efficient high-return expansions

                                                        Invest          §   Continue to build upon our export competency
              Midstream
                                                                        §   Diversify and grow our customer base to help
                                                                            mitigate counterparty risk
                                                        Grow
                                                                        §   Optimize existing rail infrastructure to gain
                                                                            scale and efficiencies
                Global
                Export                                 Leverage         §   Increase throughput at existing facilities while
                                                                            maintaining top-tier operating costs and
                                                                            environmental standards

                                                       Partner          §   Leverage and maintain strong relationships with
                                                                            First Nations, regulators and all partners
           Leveraging our
         Core Export Strategy                                           §   Mitigate commodity risk through effective hedging
                                                       Protect              programs and risk management systems

                     Leverage export strategy and our integrated value chain to attract volumes

                   See "Forward-looking Information"                                                                           20
Midstream: Who We Are
Integrated Midstream Business – from wellhead to global markets
NGL Extraction
& Fractionation
We’re a high-quality Gas Gathering 64,000 Bbls/d2
operator that has built our & Processing 6 Facilities: North Pine,
Harmattan, EEEP, JEEP,
business with purpose 2.25Bcf/d1 Processing PEEP, Younger
12 Facilities: Townsend,
and is well-positioned for Aitken Creek, Nig Creek,
where we believe the Harmattan, Gordondale,
market is headed over the Blair Creek, EEEP, JEEP,
next three-to-five years. PEEP & Younger
Transportation, Export
50-80k Bbl/sd Capacity
Storage & Rail Logistics >130,000 Bbls/d3
Propane
~4,700 rail cars, >6 MMBbls Storage, >125 Export capability
trucks, >250 trailers 2 Terminals: RIPET,
FSK rail and truck terminal, Sarnia and Ferndale
Strathcona terminals, Griffith storage
facilities, and Townsend truck terminal, rail
>50k Bbls/d Capacity terminal, NGL pipelines; treating, storage
Propane & Butane
Our Plan: Leverage our core assets and competencies
to capitalize on macro North American trends. VLGC to Asia &
This includes leaning on our well-positioned NEBC processing and fractionation Global Markets
footprint and structurally advantaged west coast LPG export platform. Travel Time: 10-11
Days vs. 25 U.S. GC
Notes: 1. Based on ALA working interest capacity in FG&P and extraction 2. Based on ALA 100% working interest facilities and ALA % capacity in non-operated facilities 3. Includes RIPET and Ferndale. 21Petrogas Expands and Optimizes Global Export Footprint
§ Multiple interconnects with AltaGas
Terminals § Positions AltaGas to leverage its
existing footprint; Positions AltaGas with industry-leading footprint in NEBC
increased touch points across the energy § Five rail and pipeline connected terminals, to grow alongside large industry-led
value chain. including Fort Sask Rail and Truck. growth initiatives associated with
condensate supply supporting oil sands
§ Provides enhanced optionality
production and long-term
for AltaGas’ customers and producers
feedstock for LNG Canada.
across the basin to optimize price
realizations and realize improved cash Storage § Continues to position AltaGas’
flow from production. 2 2 Midstream platform for where we
§ Above and Underground storage believe the market is heading over
4
of ~6.2 MMBbls. the next three to five years.
§ Located in Ferndale, WA, Fort Sask, AB, 1
Trucking 4
Sarnia, ON, Strathcona, AB, Griffith IN, 2
and Liquids Handling plus other smaller facilities.
3
3
§ Four distinct specialized trucking and
liquids handling businesses (Millard,
Express, Petrogas Logistics and IXL). Ferndale 2
§ Includes hauling LPGs, crude, drilling LPG Export Facility
fluids and produced water. 1
§ >50 MBbls/d of combined propane and 2
butane export capacity.
§ Refrigerated LPG storage.
Railcar Fleet
4 § Pipeline connected to BP Cherry Point
& Phillips 66 Ferndale refineries.
§ Access to 3,000+ car fleet; ~1,750 are
pressurized for C3/C4 usage. Various § Products shipped through the
optimization opportunities across broader Petrogas-owned wharf, rail, truck
AltaGas and Petrogas platform. and pipeline.
22Petrogas: How the Assets Fit Into The AltaGas Value Chain
Integrated Midstream Business – Unparalleled access from wellhead to global markets; including Asia, North America and WCSB
1 Wellhead 2 Gas Gathering
& Processing 3 NGL Extraction
& Fractionation 4 Transportation,
Storage & 5 RIPET
Export 6 Global
Markets
Rail Logistics
GAS NGLs C3 & C4 C3 C3
C3
1,700 rail cars; VLGC to Asia
2.25Bcf/d1 Processing 64,000 Bbls/d2 80,000 Bbls/d
C3 & C4
Legend: & Global Markets
7 Facilities: North Pine, Townsend Truck Export capability
12 Facilities: Townsend,
C3 & C4
C3 & C4
C5
AltaGas Harmattan, EEEP, JEEP, Terminal, rail terminals,
Aitken Creek, Nig Creek, VLGC to Asia &
Midstream Harmattan, Gordondale, PEEP, Younger NGL pipelines; Global Markets
Activities Blair Creek, EEEP, treating, storage Travel: 10-11 Days
vs. 25 U.S. GC
Third-party JEEP, PEEP & Younger Sales: Local and U.S. Fort Saskatchewan
Markets Local Blending Sales: Local and U.S. Markets
Petrogas Enhances Total Export Capacity
AltaGas’ Value Chain 4 Transportation,
Storage & 5 Ferndale
Export 6 Global
Markets (MBbls/d)
Rail Logistics >130
§ Multiple interconnects with AltaGas’ existing platform; leaves
AltaGas touching increased molecules across the value chain.
Better access C3 & C4 C3 & C4
to Ft. Sask
LPG Supply
§ Increased scale and multiple paths to market enhance flow assurance.
C3, C4 & C5
3,000+ rail cars; >50,000 Bbls/d VLGC to Asia 80
§ Provides enhanced optionality for AltaGas’ customers and FSK rail and truck Export capability & Global Markets
producers across the basin to optimize price realizations. terminal, Sarnia and
VLGC to Asia &
Strathcona terminals,
§ AltaGas estimates there to be an opportunity for ~$30 million Griffith storage facilities,
Global Markets
Travel: 10-11 Days
of annual synergies focused on optimizing marketing contracts and and truck transportation vs. 25 U.S. GC
logistics, together with supply chain efficiencies and potential cost savings.
To N. American Markets:
§ Plan to take steps to achieve the bulk of these synergies in the first Transportation of LPG,
year and be fully realized on a run-rate basis at the end of 2021. crude, including RIPET RIPET +
Production of other fuels Ferndale
1. Based on AltaGas working interest capacity in FG&P and extraction.
2. Based on AltaGas 100% working interest facilities and ALA % capacity in non-operated facilities.
3. Includes RIPET and Ferndale. 23
See "Forward-looking Information”The Road Ahead will be Paved with Integration and
Optimization
§ Enhancing AltaGas’ value chain with Petrogas’ midstream infrastructure, logistics and services offerings will extend and strengthen the
company’s integrated platform, offering material value-added benefits for AltaGas’ producer suppliers and end-use customers. This will
include: 1) expanding AltaGas’ logistics capabilities with a significant, complementary asset base in key regions across North America; 2) providing
greater access to liquids supply to support these optimization activities; and 3) adding a large network of customer relationships across North America,
Synergies: along with operational expertise in each market.
§ We estimate, in the short-term, there to be approximately $30 million of annual synergies within the combined platform, including supply
chain efficiencies, market optimization, strategic positioning and other cost savings opportunities. In the longer term, the addition of the
Petrogas assets will position AltaGas with the opportunity to make investments to facilitate the full utilization and capacity of our combined platform
to export additional LPG cargoes to Asia.
§ Petrogas has a long history for increasing LPG exports for limited capital outlays. AltaGas will continue that focus, including: 1) leveraging
Growth: the shipping advantage relative to other facilities (11 days to Asia vs. 25 from the U.S. GC); 2) the continued strong growth in global LPG
demand expected over the coming decade; and 3) providing a home for the excess NGL supply that will come from the Montney as LNG
Canada increases volumes.
AltaGas-Petrogas Synergies WCSB Propane Forecast Global Propane Demand Global Butane Demand
200 200
Supply Chain Mbls/d
180 180
Million Metric tons per Year
Efficiencies
Million Metric tons per Year
500 160 160
6% 140 140
400
13% 120 120
Market
Optimization 100 100
300
80 80
47%
200 60 60
Strategic 40 40
Positioning 100 20 20
34% 0 0
0
Other Cost 2013 2018 2023 2028 2033 2038
PDH Watson Island
Savings RIPET Economic US Rail (Inc Ferndale) Asia US/Canada Middle East CIS Asia US/Canada Middle East CIS
Opportunities Eastern CAD Demand Traditional Regional Demand Africa Latin America Europe Pacific
WCSB Supply Africa Latin America Europe Pacific
Source: IHS Markit, WoodMac, company reports 24Strategic Plan and 2021 Outlook
Building a Track Record of
Delivering on our Commitments
2019: A Transformational Year                                  2020: Strong Execution and Focus                    2021+ Long-term Vision and Strategy

   Refocused AltaGas on core Utilities and                          Resilient and durable results expected              Operate a diversified low-risk, high-growth
   Midstream businesses, which are positioned                       to be within guidance ranges, despite               Utilities and Midstream businesses focused
   to create durable long-term value creation.                      COVID-19 global pandemic.                           on delivering resilient and durable value for
                                                                                                                        our stakeholders that compounds over time.
   Executed ~$2.2 billion of non-core asset                         Advanced distinct energy export strategy
   sales and balanced funding plan to reduce                        through increased utilization at NEBC               Improve quality of life by safely and reliably
   debt by $3.0 billion and maintain an                             facilities, higher RIPET export volumes             connecting customers to affordable sources
   investment grade credit rating.                                  and increased ownership in Petrogas.                of energy for today and tomorrow.
   Achieved results at the top end of the                           More timely recovery of expenses and                Consistently deliver above-average and highly
   guidance, delivering 26% Y/Y EBITDA growth.                      capital at the Utilities through combination        visible growth; focus on trying to create consis-
   Strong results underpinned by growth in core                     of capital discipline, rate case filings and        tent “Dime for a Dollar” returns for our investors.
   Midstream and Utilities businesses.                              closing the ROE gap at WGL by ~150bps
                                                                                                                        Operate a safety-focused, digitally-enabled
                                                                    through operational excellence.
   Advanced integrated Midstream and energy                                                                             utility that achieves approved returns, exceeds
   export strategy with the sanctioning of RIPET,                   Delivering ~$900 million self-funded capital        customers' expectations and will excel in an
   connecting Western Canadian producers to                         program. Continue to de-lever the balance           emerging energy ecosystem.
   premium LPG markets in Asia.                                     sheet, maintain investment grade credit
                                                                                                                        Operate a world class Midstream business
                                                                    rating and stagger, extend and de-risk
   Integrated WGL and updated Michigan                                                                                  that connects producers to domestic and global
                                                                    AltaGas’ capital structure and maturity
   and Maryland rates to reflect US$47                                                                                  LPG markets. Provides cleaner burning LPGs
                                                                    profile.
   million in base rate increases.                                                                                      to Asia and reduces global emissions.
                                                                                                                        Operate with acute capital discipline and
                                                                                                                        focused on full-cycle rates of return.

                           See "Forward-looking Information"                                                                                                             26
Executive Summary of Strategic Plan
Despite market turmoil, we continue to believe that we have a clear plan for an opaque world.
High-level
While we recalibrated some of our near-term assumptions to reflect shifts in the macro market,
Views: our forward playbook remains relatively unchanged.
We continue to have strong multi-year growth potential through new rate base and closing
Utilities: the ROE gap at our underperforming jurisdictions. While COVID has created challenges, we remain
steadfast in the need to make this happen as soon as possible.
The Midstream segment is performing well, considering market conditions. Our thesis to build a
leading-market position in Northeastern B.C. continues to play out. We remain focused on the
Midstream:
long-term opportunity, meeting the needs of the top-tiered operators that we serve, and we’ll leverage
organic and inorganic capital deployment opportunities at appropriate times.
The road ahead will be paved with acute capital discipline, a heightened framework around
The Road risk-management and a strong emphasis on creating an enduring platform that is fueled by
Ahead: operational excellence. We will be pragmatic about reducing our leverage ratios and we will not
deviate off course.
See "Forward-looking Information" 272021 Outlook Unchanged
Strong Growth in Base Business Underpins 2021 Outlook
2021 Normalized EBITDA1 Guidance2 2021 Normalized EPS1 Guidance2
($ millions) (per share)
$1,400 - $1,500 $1.45 - $1.55
2021e 2021e
Utilities Midstream Corp/Other
1. Non-GAAP financial measure; see discussion in the advisories
See "Forward-looking Information“. 282021 Normalized EBITDA1 Drivers
Normalized EBITDA1 Growth Drivers
▲ Revenue and rate base growth through 2021 Normalized EBITDA1 Guidance
disciplined capital allocation and rate cases
▲ Achieving higher returns on equity through $1.4-$1.5 billion
operational excellence
▲ Cost-reduction initiatives and decreasing
leak rates
▲ Customer growth
▲ Integration and optimization of Petrogas Utilities Midstream
~57% ~42%
▲ Higher global export volumes
▲ Increasing volumes at North Pine and Townsend
▼ Lower commodity prices, frac spreads and
realized margins
Corporate /
▼ Accounting impact on previous blend and extend Other
(signed in 2018; impact taking place in 2021) ~1%
1. Non-GAAP financial measure; see discussion in the advisories
See "Forward-looking Information“ 292021 Operational Review
Midstream: Leveraging our core export strategy Growth in core business more than offsets lost
EBITDA from asset sales, lower frac spreads and
§ Optimize and increase utilization other one-time tailwinds that were seen in 2020
at existing facilities and are unlikely to be repeated in 2021.
§ Optimize and integrate Petrogas,
Global significantly expanding integrated 2021 Normalized EBITDA1 Growth ($ millions)
Export Midstream and energy export capabilities
§ Leverage export first-mover advantage
to attract additional volume to combined
$1,400 - $1,500
platform and continue to de-risk the
business with focus on earnings
durability $1,310
Utilities: Leveraging our core distribution footprint
§ Increase utilization of Accelerated 11% Y/Y Normalized EBITDA Growth1,2
Replacement Programs to replace
aging infrastructure and reduce our 2020
2020E Utilities
Utilities Growth Midstream
Midstream Other
Asset Y/Y
Sales Asset
Other Sales
Y/Y 2020E
2021E
Utilities environmental footprint Growth Growth
Growth Headwinds Headwinds
Distribution § Focus on continuous improvement in § DC & MA Rate § Increased § ACI § Lower frac spreads
Cases ownership of
customer experience and satisfaction § ARP Spending Petrogas § CES
Pomona
§ WGL Pension
accounting changes
§
§ Reduce incoming leak rates to lower § Cost
Management
§ RIPET Volumes
Higher NEBC § Ripon § Impact of Blend and
Extend (signed in
§
operating costs and benefit customers § Customer throughput
volumes
§ Brush 2018; impact taking
place in 2021)
Growth
1 Non-GAAP financial measure; see discussion in the advisories
2 Based on mid points of 2020e and 2021e guidance 30
See "Forward-looking Information2021 Disciplined Capital Allocation
Strong organic growth drives robust risk-adjusted returns
~$910 million in top-quality projects anticipated to drive earnings growth
Identified Projects:
§ Nig Creek Expansion
Corp/Other Identified Projects: Capital Allocation Criteria:
2% § Accelerated Pipe
§ Growth/maintenance Replacement (ARP)
Programs in Risk-adjusted returns exceed hurdle rates, which
Michigan, Virginia,
Maryland and
includes base hurdle rates, a value creation hurdle and
Washington, D.C. required margin of safety to match risk parameters
Midstream § Customer growth
16% Strategic fit that has the prospect of continued
§ System betterment
across all Utilities
organic growth
Provides long-term earnings and cash flow durability
Utilities
Strong commercial underpinning and continue to leave
82% AltaGas positioned for where the market is heading
Reasonable cash-on-cash payback periods that does not
leave the risk of stranded or long-term non-productive capital
See "Forward-looking Information" 31You can also read