Morphometry and spatial distribution of glacial cirques in the Western Fuegian Andes of Argentina, southernmost South America
←
→
Page content transcription
If your browser does not render page correctly, please read the page content below
Andean Geology 47 (2): 316-350. May, 2020                                                                 Andean Geology
doi: 10.5027/andgeoV47n2-3188                                                                               www.andeangeology.cl

          Morphometry and spatial distribution of glacial cirques in the
         Western Fuegian Andes of Argentina, southernmost South America

                                *Lucas Oliva1, Marcela A. Cioccale2, Jorge O. Rabassa3

1
    Doctorado en Ciencias Geológicas, Facultad de Ciencias Exactas, Físicas y Naturales, Universidad Nacional de Córdoba, Av. Vélez
    Sarsfield 1611, X5016GCA Córdoba, Argentina
    olivalucas@hotmail.com
2
    Departamento de Geología Aplicada, Facultad de Ciencias Exactas, Físicas y Naturales, Universidad Nacional de Córdoba,
    Av. Vélez Sarsfield 1611, X5016GCA Córdoba, Argentina.
    a.cioccale@unc.edu.ar
3
    Centro Austral de Investigaciones Científicas (CADIC), CONICET, Bernardo Houssay 200, Ushuaia, Argentina.
    jrabassa@gmail.com

* Corresponding author: olivalucas@hotmail.com

ABSTRACT. Glacial cirques comprise a distinctive element of relief in alpine landscapes, and their morphometry,
distribution and spatial arrangement are generally linked to morphoclimatic factors. This study provides an analysis
of morphometric characteristics, floor altitude, aspect and distribution of 251 first-order and 99 "inner" cirques with
regard to environmental agents in a selected alpine-type area of the southwestern Fuegian Andes, in Southern Argentina.
Parametric variables were extracted and quantified from satellite images and a Digital Elevation Model, and integrated
to a Geographical Information System for their systematization and processing. Significant associations were identified
between the different geometric and spatial parameters evaluated. Variability in cirque morphometry along the study
area suggests that their evolution was regulated to a large degree by glacial dynamics related to Beagle palaeoglacier
activity, and by the W-E topographic gradient of the mountain section. The record indicates that most cirques in the
Fuegian Andes have undergone allometric enlargement in the three dimensions (i.e., lesser vertical erosion compared
to walls' horizontal expansion), with local variations in size and shape controlled by ice residence time, aspect and
altitude, whereas geological structure is supposed to have affected cirque formation along the entire mountain chain.
Cirque azimuth potentially responds to the combined influence of climate (solar radiation and westerly winds), structure
(pervasive faulting and rock bedding) and topography in their development. In particular, dominance of southeasterly
aspects is interpreted as a consequence of a relatively cloud-free atmosphere and aridity during past glacial periods
in the region, consistently with published evidence. The absence of aspect-related variation in cirque floor altitude is
considered to indicate incidence of extensive glaciations in the area (i.e., mostly ice-sheet conditions, with mountain
peaks far above the regional equilibrium line altitude or ELA), as well as formation of younger, lower cirques during
successive cold periods of different intensity. Occurrence of "inner" cirques inside larger (preexisting) cirques is thought
to reflect a temporary positioning of the ELA just above the floor of the container cirque, permitting short-lived, small
cirque-type glaciers to develop along structural bedrock weaknesses.

Keywords: Glacial cirques, Allometry, Cirque distribution, Fuegian Andes, Tierra del Fuego.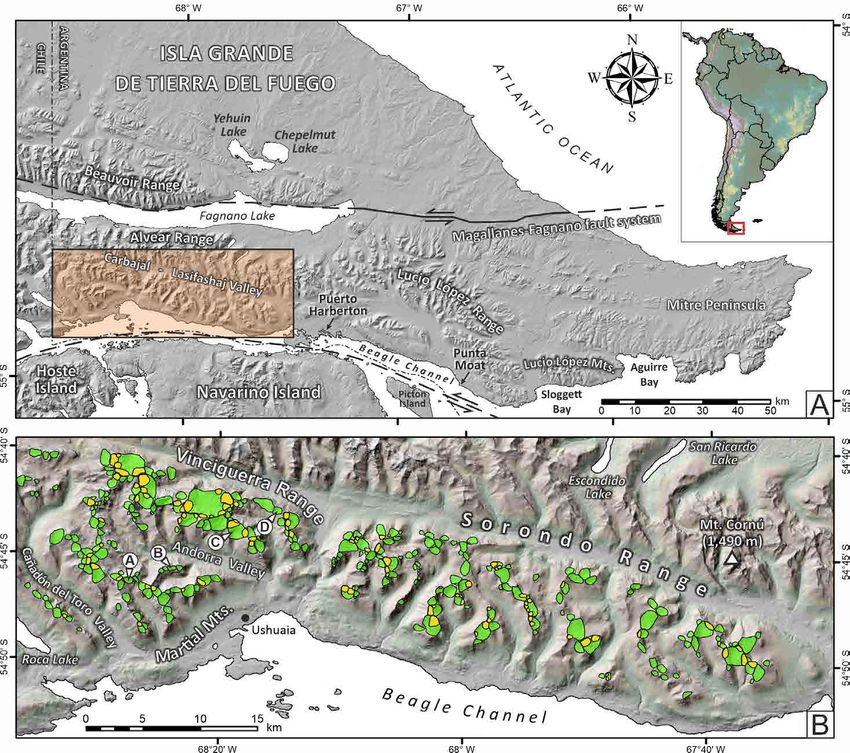
Oliva et al. / Andean Geology 47 (2): 316-350, 2020                                                                       317

RESUMEN. Morfometría y distribución espacial de circos glaciarios en los Andes Fueguinos Occidentales de
Argentina, extremo sur de Sudamérica. Los circos glaciarios comprenden elementos distintivos del relieve en los
paisajes alpinos, y su morfometría, distribución y disposición espacial están generalmente vinculadas a los factores
morfoclimáticos presentes. Este estudio proporciona un análisis de las características morfométricas, la altura del
piso, la orientación y la distribución de 251 circos glaciarios de primer orden y 99 circos interiores, en relación con los
agentes ambientales en un área de tipo alpino, seleccionada en los Andes Fueguinos, en el extremo sur de Argentina. Las
variables paramétricas escogidas fueron extraídas y cuantificadas a partir de imágenes satelitales y un modelo digital de
elevación, y se integraron a un sistema de información geográfica para su organización y procesamiento. Se identificaron
asociaciones significativas entre los diferentes parámetros geométricos y espaciales evaluados. La variabilidad observada
en la morfometría de los circos a lo largo del área de estudio sugiere que su evolución estuvo regulada en gran medida por
la dinámica glaciaria vinculada a la actividad del paleoglaciar Beagle, y por el gradiente topográfico de O a E del cordón
montañoso. El registro obtenido indica que la mayoría de los circos en los Andes Fueguinos estuvo sujeta a crecimiento
alométrico en las tres direcciones (i.e., menor erosión vertical respecto a la expansión horizontal de las paredes), con
variaciones locales en su tamaño y forma controlados por el tiempo de ocupación glaciaria, la orientación y la altitud, en
tanto que el factor geológico estructural habría afectado el desarrollo de los circos a lo largo de toda la sección estudiada.
La orientación de los circos probablemente está reflejando la influencia combinada del clima (radiación solar y vientos
del oeste), la estructura geológica (intenso fallamiento y estratificación de la roca de base) y la topografía a lo largo de
su evolución. En particular, el predominio de circos expuestos hacia el S y el SE es interpretado como consecuencia
de condiciones de aridez (con cielos relativamente despejados) durante los diferentes periodos glaciarios de la región,
como ya ha sido propuesto en otros estudios. Se considera que la aparente ausencia de correlación entre la altura del
piso y la orientación de estas geoformas es indicativa de glaciaciones intensas en el área (i.e., picos montañosos muy por
encima de la línea de equilibrio glaciario [ELA, por sus siglas en inglés] regional), así como de la formación de circos
más jóvenes y de menor cota durante sucesivos eventos fríos de diferente magnitud. La presencia de circos “interiores”
dentro de circos previos de mayores dimensiones indicaría una estabilización temporaria de la ELA apenas por encima
del piso del circo hospedante, lo cual habría permitido el desarrollo de pequeños glaciares de circo a lo largo de las
debilidades estructurales del sustrato rocoso.

Palabras clave: Circos glaciarios, Alometría, Distribución de circos, Andes Fueguinos, Tierra del Fuego.

1. Introduction                                                     generated by fluvial processes or landslides (Evans,
                                                                    2006a). Cirques can be situated at the headwaters
    Investigations in glacial erosion processes are of              of valleys (valley-head cirques) or at their flanks
capital importance in understanding the connection                  (valley-side cirques) (sensu Mîndrescu and Evans,
between climate and topography. Given their extensive               2014). Cirque complexes (nested cirques) are usually
and continuous areal coverage in mountainous                        a common feature in ranges which rose well above
regions, and the possibility of tracing them using                  former snowlines, and consist of "compound" cirques
remote sensing, glacial cirques comprise valuable                   containing one or more "inner" cirques. These inner
geoindicators of past global environmental changes                  cirques correspond to smaller cirques of nivation
(e.g., Barr and Spagnolo, 2015). Glacial cirques are                hollow aspect, originated within compound cirques
theatre-shaped depressions, typically developed at                  by wall erosion, usually at higher altitudes (Simoni,
high topographic settings in glacial landscapes by the              2011). To be considered as "inner", a cirque must
erosive action of mountain glaciers (Evans and Cox,                 have a distinct floor, separated from the host cirque
1995; Barr and Spagnolo, 2015). Morphologically,                    floor (and from other "inner" cirque floors) by a steep
they consist of semi-circular hollows opened                        slope, in a way that all contained ice flowed into a
downhill, and bounded upstream by the convex                        compound cirque. In addition, each compound cirque
crest of a steep headwall, which is arcuate in plan                 must have a section of headwall apart from those
around a more gently-sloping floor (Evans and Cox,                  belonging to its contained inner cirques (Evans and
1974). Their dimensions range from hundreds of                      Cox, 1974; Mîndrescu and Evans, 2014).
meters to a few kilometres, and they are usually                        Because of their reduced dimensions and volume,
connected with valleys through rocky thresholds.                    cirque glaciers are extremely responsive to regional
Cirques generally originate from the glacierization                 climate variability (mainly to summer temperature
of an already indented topography, where the ice                    and mean annual precipitation), and after glaciation,
occupied pre-existing irregularities, previously                    abandoned cirques remain as certain geomorphic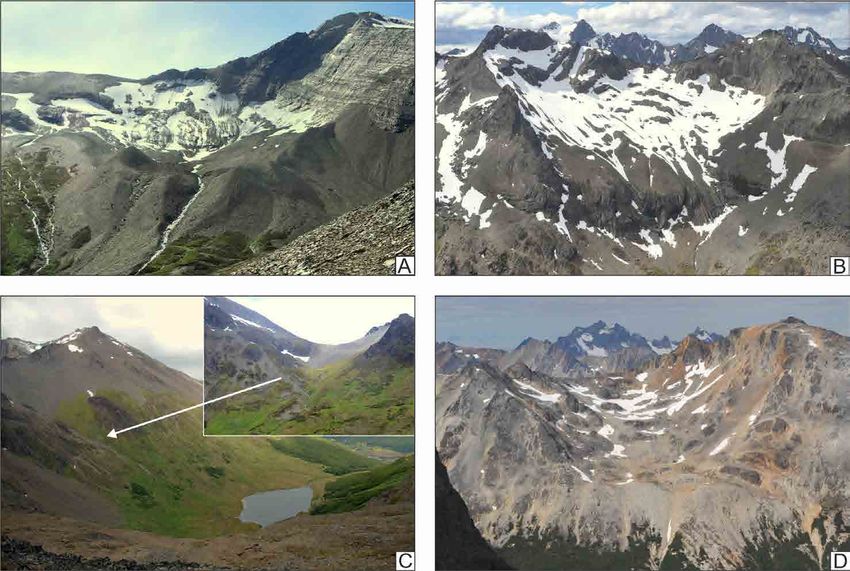
318    Morphometry and spatial distribution of glacial cirques in the Western Fuegian Andes of Argentina...

proxies of past climate conditions (e.g., Gordon,            in Venezuela, to the Fuegian Andes, cirques should
1977; Aniya and Welch, 1981; Evans, 2006a; Delmas            have been modelled by glaciers with contrasted
et al., 2014; Barr and Spagnolo, 2015; Ipsen et al.,         activities due to differences in temperature and
2018). Given that cirque glaciers are formed and             regional moisture patterns (and thus with different
maintain their activity around the equilibrium line          erosive behavior), as shown by modern glaciers from
altitude (ELA), their floor elevation can be considered      the tropical, the dry subtropical and the temperate
as a proxy of the average Quaternary ELA (e.g.,              mid-latitude Andes (Rodbell et al., 2009). This paper
Mitchell and Montgomery, 2006; Foster et al., 2008;          presents an inventory of the glacial cirques in the
Mitchell and Humpries, 2015), which has been                 southwestern sector of the Argentine Fuegian Andes
linked to regional climatic context (e.g., Flint, 1957;      (see boxed area in figure 1A) and provides landform-
Porter, 1964; Embleton and King, 1975; Williams,             process evidence from their quantitative analysis.
1975). The distribution, morphometry and aspect of           In the global scene, Tierra del Fuego comprises the
cirques are affected by the intensity, duration and          continental territory closest to Antarctica, receiving
extent of glaciation, which in turn depend, among            the full impact of the Antarctic Circumpolar Current
other factors, on climate and topography (Barr and           (e.g., Orsi et al., 1995), and therefore operates as an
Spagnolo, 2013).                                             observatory of the Subantarctic Oceanic Belt, in the
     In recent decades, numerous studies about               confluence of the Atlantic and Pacific Oceans. Given
glacial cirques have highlighted the control exerted         this situation, the study of glaciations in the Fuegian
by climate and geology on their morphometric                 Andes can certainly provide a linkage between the
attributes. Most of them emphasized the influence of         climatic history of the Antarctic Peninsula and the
the climatic factor on cirque distribution, mainly on        southernmost portion of South America. In particular,
their azimuth (e.g., Trenhaile, 1976; Olyphant, 1977;        the area selected for this investigation represents
Křížek and Mida, 2013; Mîndrescu and Evans, 2014).           a unique setting to evaluate cirques developed
Other authors observed that cirque morphometry               under the influence of both alpine and ice sheet
correlates with topographic characteristics, such            glacial contexts, since this zone was covered from
as altitude, gradient and slope aspect (e.g., Evans,         the west by the southernmost present icefield of
1972, 1999; Křížek and Mida, 2013). The incidence            the Andes Range during maximum cold phases of
of lithology and structure on cirque morphology              the Pleistocene (Rabassa et al., 2000). Under this
and dimensions has been widely recognized (e.g.,             comprehension, the objective of this publication is
Haynes, 1968; Alonso, 1994; Evans, 1994; Sauchyn             to assess the relationship of cirque morphometry and
et al., 1998; Delmas et al., 2014). Nevertheless,            distribution with geological (mainly structure) and
some studies stated that geology has little relevance        morphoclimatic dominant conditions. In so doing,
in determining morphometric properties of cirques            it is attempted to contribute to the understanding of
(Evans and Cox, 1995; García-Ruiz et al., 2000; De           the magnitude of glaciations in southernmost South
Blasio, 2002; Barr and Spagnolo, 2013). In these             America and, particularly, to the knowledge of the
cases, the development of cirque shape would be              palaeoglacial model proposed for the Beagle Channel
responding to a morphostructural predisposition of           area (e.g., Rabassa et al., 2000).
relief (preferential snow accumulation areas). Attempts
have also been made to establish a proportionality           2. Previous cirque investigations
between morphometry and the estimated age of
cirques, indicating that morphological differences               Studies about glacial cirques are plentiful in the
between cirques could be reflecting diverse stages           Northern Hemisphere, mainly in North America and
in their development or a distinct growth rate, rather       Europe (see summaries in Evans, 1977 and Barr and
than differences in environmental factors (Haynes,           Spagnolo, 2015). The Southern Hemisphere, on the
1998; Brook et al., 2006; Bennett and Glasser, 2011).        other hand, has scarce previous works, and only a few
     Cirques are widely distributed all along the 7,000 km   isolated studies have focused on cirque distribution
of the Andean Cordillera, offering an inestimable            and/or their morphometric attributes: Clapperton
opportunity to compare morphometric and distribution         (1971) in Islas Malvinas (Falkland Islands), Aniya
properties of cirques present in many different topo-        and Welch (1981) in Antarctica, Brook et al. (2006)
climatic regions. From the Sierra Nevada de Mérida,          in New Zealand, Ponce and Rabassa (2012) in Isla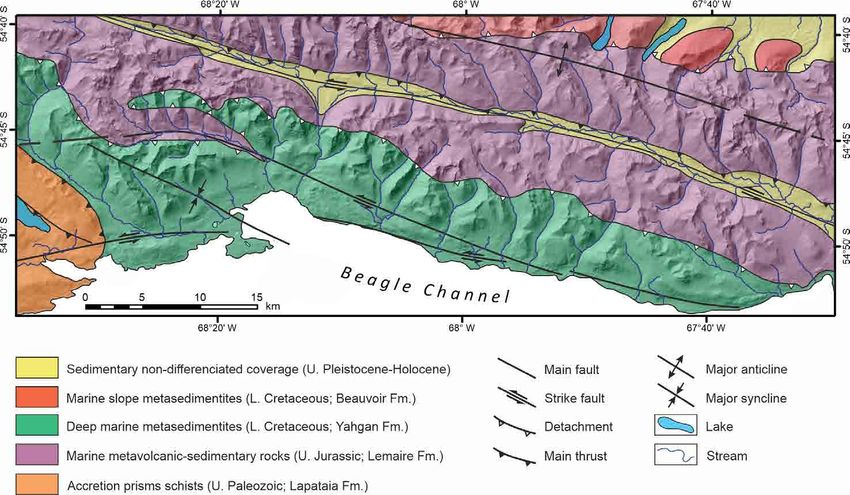
Oliva et al. / Andean Geology 47 (2): 316-350, 2020                                                                              319

FIG. 1. A. Map of the southern part of argentine Tierra del Fuego, including the location of the study area. The two major geological
        structures that affect the region are delineated: the Magallanes-Fagnano and the Beagle Channel fault systems. B. Area of the
        Fuegian Andes where morphometric characteristics of cirques were analysed (green polygons: first-order cirques; yellow:
        inner cirques), showing the mountain ranges and valleys cited in the text. Letters inside white circles correspond to cirques
        described in figure 5 (Coordinates in Lat/Lon; Projection: UTM; Datum: WGS84).

de los Estados (Staten Island), Argentina, and Araos                 glaciological surveys on remaining ice bodies in the
et al. (2018) in Southern Patagonia (50° S). In Tierra               cirques of Martial and Vinciguerra (54°43'32.87' S-
del Fuego, Coronato (1996) highlighted the incidence                 68°20'10.46' W) glaciers, respectively. Based on
of climate and relief structure on the distribution of               geomorphologic evidence, Coronato et al. (2009)
cirques and present cirque glaciers in a portion of the              estimated the ice thickness within cirques and hanging
southwestern Argentine Fuegian Andes. In Martial                     valleys that merged the Fagnano palaeoglacier in its
Glacier cirque (54°47'27' S-68°23'43' W), near                       central-western (catchment) sector. Iturraspe (2011)
the city of Ushuaia (Fig. 1B), Planas et al. (2002)                  provided valuable information about the characteristics
proposed a glacierization scheme since the Last                      and possible evolution of the glaciers of the Argentine
Pleistocene Glaciation from geomorphological analysis                Fuegian Andes and Cordillera Darwin (Chile). A
of moraine deposits. On the other hand, Strelin and                  preliminary broad-scale geomorphological mapping
Iturraspe (2007) and Iturraspe et al. (2009) performed               (1:50,000) including some of the cirques of the study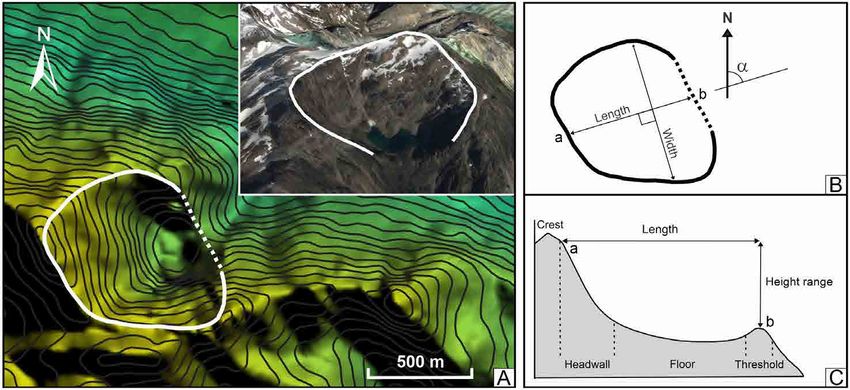
320    Morphometry and spatial distribution of glacial cirques in the Western Fuegian Andes of Argentina...

area was presented by Glasser et al. (2008), and          with small pull-apart basins and profuse strike-slip
more recently Menounos et al. (2013) supplied an          structures (Ghiglione, 2002; Ghiglione and Ramos,
absolute chronology of glacial fluctuations since the     2005). Both tectonic plates record a lateral displacement
Last Glacial Maximum in southwestern Argentine            at a relative rate of 6.6±1.3 mm/yr (Smalley et al.,
Fuegian Andes from the study of glaciated bedrock         2003). The Fuegian Andes also show evidence of
and deposits within and adjacent to glacial cirques.      counterclockwise crustal rotation and strike-slip
                                                          faulting along the Beagle Channel Fault Zone (BCFZ)
3. Study area                                             since the Late Cretaceous (Cunningham, 1994, 1995).
                                                          This deformation produced the pervasive strike-
3.1. Topographic and geological setting                   slip faulting present through the basement domain
                                                          (Cunningham, 1994; Ghiglione and Cristallini,
     The Fuegian Andes represent the southernmost         2007) and is responsible for the exhumation of the
segment of the Andes Range, including the Fuegian         Cordillera Darwin metamorphic complex (Nelson,
Archipelago and the southern portion of the Isla          1982; Kohn et al., 1995). The northern shore of the
Grande de Tierra del Fuego, at the southern end of        Beagle Channel's central segment is characterized
South America (Fig. 1A). At this latitude, the N-S        by several E-W oriented glacial valleys, parallel to
direction of the Andes changes to E-W due to the          the channel, which are interspersed with a series
continuous movement of the Scotia plate eastwards         of oblique NW-SE trending lineaments that extend
since the Early Tertiary (Rabassa et al., 2005). In       across the mountain belt (Bran et al., 2018) (Fig. 2).
Chilean territory, the Fuegian Andes receive the          These authors inferred an extensional control over
name of Cordillera Darwin, with its maximum               the oblique transverse lineaments in the area, and
altitude at Mount Darwin, 2,440 m above sea level         suggested they might be the result of inherited
(a.s.l.), comprising mainly the Fuegian Archipelago.      structural corridors between two sub parallel E-W fault
On the Argentine side (maximum altitude: Mount            systems, reactivated by transtensional deformation
Cornú, 1,490 m a.s.l.) the Fuegian Andes extend up        in times (according to Torres-Carbonell et al., 2014)
to the eastern end of the island, continuing in Isla      not older than the late Miocene.
de los Estados beyond the ~30 km-wide Le Maire                 The area surveyed in this paper includes the
Strait. This mountainous section consists of several      mountainous segment from the international border
mountain ranges predominantly oriented WNW-               with Chile and along the northern coast of Beagle
ESE, separated by structural valleys, with maximum        Channel, in the SW sector of the Fuegian Andes, and
elevations descending from W to E from 1,100-             is formed by Martial Mountains area and Vinciguerra
1,400 m a.s.l. to ca. 500 m a.s.l.                        Range to the west, and Sorondo Range to the east, all
    The stratigraphic rock sequences that comprise        of them separated from each other by large structural
the Fuegian Andes have been affected by a series          valleys (Fig. 1). This section, that follows the general
of contrasting tectonic regimes, represented by           direction and topographic gradient of the Fuegian
extension during the Upper Jurassic-Lower Cretaceous,     Andes, extends over 73 km and occupies a total
compression in the Upper Cretaceous-Paleogene,            area -bounded along the foot of the mountains- of
and transcurrence during the Cenozoic (Katz, 1972;        919.7 km2. It is primarily composed of two lithological
Dalziel et al., 1974; Kohn et al., 1995). The structure   types in similar proportions, whose contact, defined
is characterized by a large E-W oriented complex          by a tectonic thrust, is oriented approximately
fault system, with deviations to the NE and SE, and       along the chain axis (Fig. 2). The northern portion
thrust sheets facing N, associated with dynamic           is composed almost entirely of intensely deformed
metamorphism older than the Late Cretaceous               marine volcanic and sedimentary rocks (schists,
(Caminos, 1980; Ramos, 1999). On the southern             carbonaceous slates, sandstones, tuffs, breccias,
part of the Fuegian Archipelago, the Magallanes-          rhyolite and basalts) of Upper Jurassic age (the
Fagnano Fault Zone (MFFZ), which defines the              Lemaire Formation; Borrello, 1969), whereas the
boundary between the South American (to the N)            flanks facing south are formed by strongly folded
and Scotia (to the S) plates, was activated after the     marine meta-sedimentary rocks (dark slates, tuffs,
compressive phase, in the late Miocene (~10 Ma)           and sandstones) of Lower Cretaceous age (the Yahgan
(Torres-Carbonell et al., 2014), and is associated        Formation; Kranck, 1932). In the SW part, covering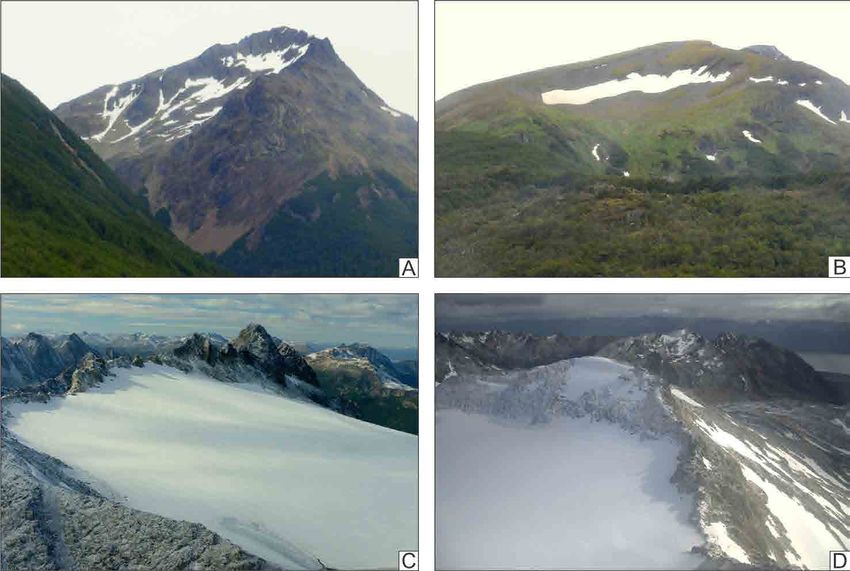
Oliva et al. / Andean Geology 47 (2): 316-350, 2020                                                                                  321

FIG. 2. Schematic geologic map of the study area. Lithological units after Olivero and Malumián (2008). Tectonic context showing
        the main structural features is based on Menichetti et al. (2008), Esteban et al. (2014), Torres Carbonell et al. (2014) and Bran
        et al. (2018).

a smaller area, accretion prisms schists (phyllites                    cirques (Planas et al., 2002; Menounos et al., 2013)
and amphibolites) of Upper Palaeozoic age emerge                       and in tributary and hanging valleys (Coronato, 1990,
(the Lapataia Formation; Caminos et al., 1981). The                    1993, 1995), but they are covered by the forest in
Mesozoic sequence was partially covered by fluvial                     the lowlands (Rabassa et al., 2000) (timberline is
and glaciofluvial deposits in the inter-montane glacial                located at ca. 500-700 m a.s.l.; Puigdefábregas et
valleys and by colluvial deposits and Late Glacial                     al., 1988; Strelin and Iturraspe, 2007). Cryogenic
or Neoglacial moraines within some of the cirques.                     landforms (nivation hollows, subnival clast pavements,
     The morphology of this range results from the                     protalus ramparts, debris lobes, patterned ground and
combined action of the tectonic deformation that                       cryo-ejected clasts) abound in the higher portions
still affects the region, and glacial erosion produced                 of mountains (Valcárcel‐Díaz et al., 2006), and the
during the successive Pleistocene cold events,                         presence of small rock glaciers is frequent within
mainly the Last Glaciation (ca. 85 to 10 ka B.P.;                      some cirques in the western Fuegian Andes (Vega,
Rabassa, 2008). Glacial cirques constitute a dominant                  2004; González et al., 2007).
geomorphological feature in the area, delimiting
almost the totality of ridges and mountain peaks. A                    3.2. Climate
wide network of single glacial valleys crosses the
mountain chain, transversely to major longitudinal                          The present regional climate of Tierra del Fuego
WNW-ESE trending troughs, tributaries of the                           is significantly influenced by the provenance of cold
Beagle Channel. Hanging valleys, arêtes, horns and                     and wet air masses from the Pacific Ocean polar
truncated spurs are also conspicuous elements in                       front (Tuhkanen, 1992). When cyclones reach the
the landscape constitution of this sector (Coronato,                   mountainous areas of southern Tierra del Fuego,
1995, 1996; Planas et al., 2002; Coronato et al.,                      they produce a maritime, cold, wet and windy
2009). Latero-frontal morainic arcs are observable in                  weather giving a mean annual air temperature of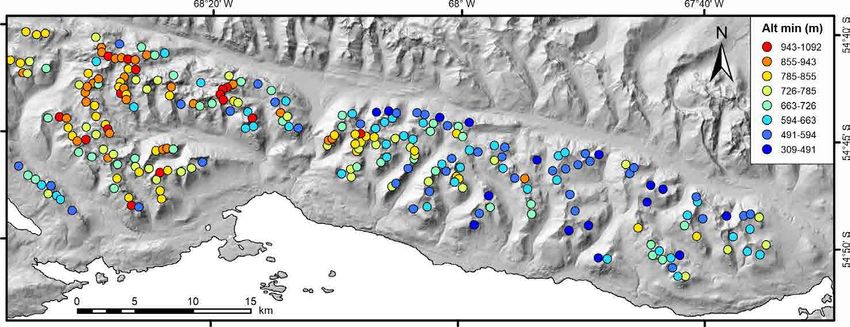
322     Morphometry and spatial distribution of glacial cirques in the Western Fuegian Andes of Argentina...

5.5 °C (Strelin and Iturraspe, 2007). Prevailing                       global and regional warming (Strelin and Iturraspe,
winds from the SW and S provide moisture to the                        2007; Iturraspe et al., 2009; Iturraspe, 2011).
region and generate orographic precipitations with
a strong gradient from the SW, with 600 mm/year,                       3.3. Glacial history
to the NE, with less than 300 mm/year (Rabassa
et al., 2006). The southern portion of the island is                        Most of the Isla Grande de Tierra del Fuego, and
protected from dominant westerly winds by the                          perhaps the entire island, was occupied by extensive
Cordillera Darwin and the higher mountains of                          glaciers in the early Pleistocene, during the Great
Hoste and Navarino islands, in Chile (Strelin and                      Patagonian Glaciation (GPG, ca. 1.1 Ma B.P.; Mercer,
Iturraspe, 2007). The Fuegian Andes show a general                     1976; Ton-That et al., 1999; Singer et al., 2004), and
gradient in precipitation from W to E, although they                   then was partially covered by ice repeatedly throughout
reveal an increment from the eastern mouth of the                      the middle and late Pleistocene (Rabassa et al., 2000).
Beagle Channel to the eastern extreme of the Isla                      Evidence of at least five glaciations (starting with
Grande de Tierra del Fuego and Isla de los Estados                     the GPG) has been documented in the northern part
(around 1,500 mm/year in the latter; Dudley and                        of the Isla Grande de Tierra del Fuego (Meglioli,
Crow, 1983) due to the entrance of oceanic wet air                     1992; Porter et al., 1992; Clapperton et al., 1995),
masses from the south, without the shielding of the                    the oldest three even extending off-shore to culminate
aforementioned mountain barriers (Rabassa et al.,                      in the present Atlantic submarine platform (Porter,
2006). Maximum precipitation occurs in the higher                      1990; Meglioli et al., 1990; Isla and Schnack, 1995).
portion of the Fuegian Andes, near the border with                     Nevertheless, only the last two cold events (i.e., the
Chile and south of Fagnano Lake (Rabassa et al.,                       last Middle Pleistocene Glaciation or post-GPG III
2006) (Fig. 3). In the Chilean sector, the Fuegian                     [Coronato et al., 2004], and the Last Glaciation) were
Andes are covered by the mountain icefield of                          recognized in the Fuegian Andes setting (Rabassa
Cordillera Darwin, which has outlet glaciers reaching                  et al., 1990a; Meglioli, 1992). Ice coverage in this
present sea level (the ELA in Cordillera Darwin is                     area would have had different extent and volume
located at ca. 600-700 m a.s.l.; Iturraspe, 2011).                     in each of the known regional glacial advances,
In Argentine territory, on the other hand, present                     reaching piedmont sectors and maritime waters in
climate only permit the development of small ice                       several opportunities, and receding to the summits
masses (
Oliva et al. / Andean Geology 47 (2): 316-350, 2020                                                        323

from the Cordillera Darwin icefield, from which         location, the ice that filled them would have reached
outlet glaciers were channeled by large structural      thicknesses of at least 400 to 600 m (Coronato, 1995;
valleys constituting the main lobes that occupied       Coronato et al., 1999). During this maximum cold
the Magellan Strait and Bahía Inútil-San Sebastián      phase, ice volume in tributary valleys was regulated
depression to the north, and Fagnano Lake basin         by the dynamics of the Beagle palaeoglacier, which
and the Beagle Channel to the south, in the Andean      by then is supposed to have reached a minimum
region (Rabassa et al., 2000). Terminal moraines        of 1,200 m thick in areas near Ushuaia, burying
representing the post-GPG III were recognized in        the surrounding landscape below 500-700 m a.s.l.
Bahía Sloggett, in the southern coast of Tierra del     (Coronato, 1995), and even penetrating into some
Fuego, ca. 125 km east of Ushuaia (Rabassa et al.,      of the tributary valleys and cirques (i.e., blocking
1996) (Fig. 1A), and in the northeastern sector of      their glaciers downward flow), as demonstrated by
Fagnano Lake ("Lago Chepelmut drift"; Meglioli,         Coronato (1990, 1995) in Andorra Valley and by
1992; Río Fuego valley; Coronato et al., 2008) and      Planas et al. (2002) in Martial Glacier cirque. When
presumably along its southern coast ("Río Valdez        they did not cover the highest inner water divides
drift"; Meglioli, 1992), whereas in the surveyed        (at about 800-900 m a.s.l.; Coronato, 1995), some
area (as in the rest of the southern Fuegian Andes)     ice masses would have merged the main collectors
only the LGM geomorphological evidence has              from cirques through short ice tongues (Coronato,
been documented (Rabassa et al., 1990a, 2000;           1995; Coronato et al., 2009), although in most cases
Coronato, 1993, 1995, 1996). During this maximum        cirque glaciers probably connected to the glacial
ice expansion, the front of the Beagle palaeoglacier    tributary network almost directly.
would have been located close to Punta Moat,                 Deglaciation process in the region, coincident
at the eastern mouth of the channel, ca. 100 km         with a rapid warming in the high and middle Southern
east of Ushuaia (Rabassa and Clapperton, 1990)          Hemisphere latitudes, started at ca. 18.4 ka BP (Hall
(Fig. 1A). Lateral moraine complexes attributed         et al., 2013), and most glaciers from the Cordillera
to the LGM (Caldenius, 1932) were recognized at         Darwin icefield were close to their current position
150 m a.s.l., 10 km westwards Punta Moat, providing     as early as ca. 16.5 ka (Hall et al., 2017). In the
a preliminary estimated value of the LGM-ELA            southwestern Fuegian Andes, alpine areas beyond
for the area (Rabassa et al., 1990b). The exposed       cirques were ice-free by ca. 16.9 ka (Menounos et
surface of Tierra del Fuego is supposed to have been    al., 2013), and the front of the Beagle ice lobe was
at least twice the present one in LGM times due to      already 70 km west of Ushuaia by 14.8 ka (Hall et al.,
lowering of sea level (around 120 and 130 m below       2013). Lateglacial advances in this region occurred in
present sea level; Fleming et al., 1998; Thompson       coincidence with the Antarctic Cold Reversal (14.5-
and Goldstein, 2006), with marine Atlantic coast        12.9 ka; Jouzel et al., 2001) and the Younger Dryas
displaced around 130 km eastwards (Ponce et al.,        Stadial (12.9-11.7 ka; Rasmussen et al., 2006; Lowe
2011a). This situation would have produced more         et al., 2008; Menounos et al., 2013), before glaciers
continental climatic conditions than the current ones   finally receded from lower altitude valleys, allowing
(Rabassa et al., 1992, 2000; Ponce et al., 2011b). By   glaciolacustrine environments dominate in those sectors
then, ice bodies in the studied area were probably      (Coronato, 1995; Rabassa et al., 2000). More recently,
not connected to the Cordillera Darwin icefield in      glaciers readvanced successively during the Holocene
the form of a continuous, uniform mantle, but would     (Neoglaciations), depositing several terminal moraines
have constituted an extensive and thick glacial         in cirques and high tributary valleys (Coronato, 1995;
mass interrupted by rocky peaks and high ridges         Rabassa et al., 2000; Planas et al., 2002; Menounos et
(Coronato, 1995; Rabassa et al., 2000; Coronato         al., 2013; Ponce et al., 2015). Menounos et al. (2013)
et al., 2009). The main inner troughs along Beagle      identified one or more successive glacier expansions
Channel's north coast were fully glaciated during the   between 7.96-7.34 ka and 5.29-5.05 ka, with glaciers
LGM (Rabassa et al., 2000), as were the Fagnano         partly filling cirques and hanging valleys to positions
Lake basin (Coronato et al., 2005, 2009) and the        only tens of meters downvalley from those of the
Carbajal-Lasifashaj, Andorra and Cañadón del Toro       Little Ice Age (LIA;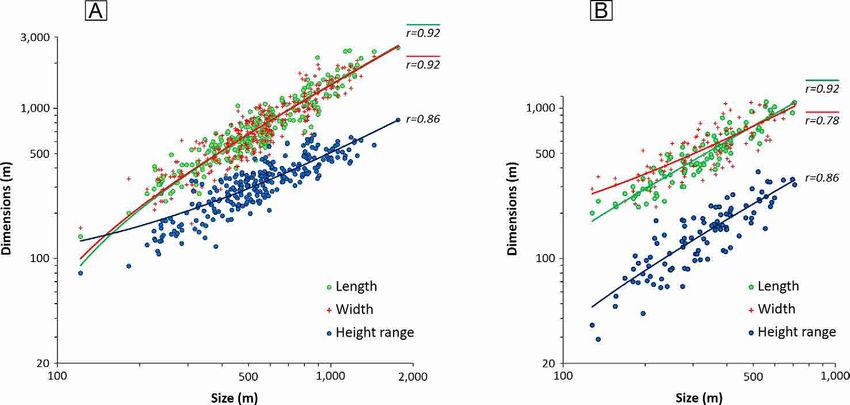
324     Morphometry and spatial distribution of glacial cirques in the Western Fuegian Andes of Argentina...

on their degree of preservation, proximity to present                  with a spatial resolution of 12.5 m; Rosenqvist et al.,
glaciers, and similarity of their positions to moraines                2007) and high resolution satellite images (Digital
in adjacent areas that have previously been assigned                   Coverage Globe-Google Earth: SPOT Image; spatial
to the LIA (Strelin and Iturraspe, 2007; Strelin et al.,               resolution of 2.5 m) from Google Earth software.
2008; Maurer et al., 2012).                                            Field checking was necessary for ascertaining
    Although there is no definitive agreement about                    landscape features lacking precise definition on maps
the specific glaciological setting that led to formation               and imagery, as well as lithological and structural
of glaciers that eroded the cirques of the Fuegian                     properties of bedrock. A series of surface models
Andes (Menounos et al., 2013), it is probably that they                was derived from the DEM, from which parametric
were occupied by ice in the various Pleistocene cold                   information was obtained (altitudes and mean slope
phases (Rabassa et al., 2000), attaining their current                 gradient). Cirques were delimited in correspondence
size and morphology throughout the Last Glaciation                     to Evans and Cox (1974, 1995) criteria for the
and during its decay, when glacial coverage begun                      distinction of the different morphological elements
to diminish ("Individualization" and "Stabilization"                   involved (Fig. 4). They were recognized as concave
stages; ca. 18 to 14 and 14 to 12 ky BP, respectively;                 downvalley-opened surfaces of varying depth and
Coronato, 1995) and tributary valley glaciers acquired                 gradient, surrounded by an arcuate crest (headwall),
a behaviour independent from that of the Beagle                        generally occupying the headwaters of valleys within
palaeoglacier, which in turn was receding from its                     high-altitude sectors of drainage basins (Barr and
easternmost frontal position (Rabassa et al., 1990b;                   Spagnolo, 2013). The headwall upper limit was
Coronato, 1995).                                                       defined by following the crestline, which commonly
                                                                       coincides with the main divide, or along breaks in
4. Data and methods                                                    slope with respect to upward topography in case
                                                                       no certain crestline existed. Nevertheless, cirque
   Cirques were identified and mapped from a                           demarcation involves the issue of determining its
Digital Elevation Model (ALOS PALSAR DEM,                              boundary with downslope relief, which ideally

FIG. 4. A. A well defined cirque in the north flank of Vinciguerra Range (54°42’ S-68°18’ W), mapped as a polygon. The white solid
        line corresponds to the upper edge of headwall outline, and the dashed stretch represents the threshold, which establish the
        transition of cirque floor to down-valley, steeper topography. The inset image is a 3D perspective from the east, clearly showing
        the rounded crest that defines cirque contour (Google Earth image). B. Definition of some of the main variables measured:
        length (a-b distance; L), width (longest distance perpendicular to L; W) and α, the angle between the median axis L and
        geographic north. The dashed line represents the threshold. C. Profile view along the cirque maximum gradient line, outlining
        the distinction between the different morphological features of a cirque. See table 1 for additional morphometric definitions.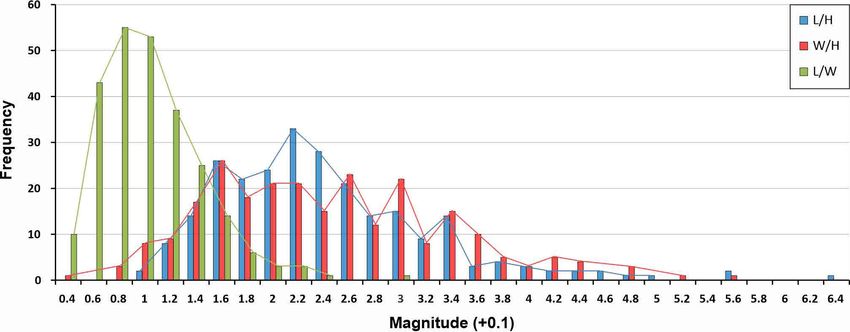
Oliva et al. / Andean Geology 47 (2): 316-350, 2020                                                                           325

corresponds to the threshold, but that is frequently                 In order to attain a reliable operational definition,
transitional, sometimes without an evident slope                 the morphometric variables used in this investigation
break. This circumstance is common when cirques                  were defined according to procedures described in
are situated at valley-head settings, where the                  previous researches (Aniya and Welch, 1981; Evans
floor limit downstream must be established by                    and Cox, 1995; Evans, 2006a; Hughes et al., 2007)
extending the headwall spurs along both margins.                 (Table 1). Apart from these attributes, cirque azimuth
Each cirque was digitized as an enclosed polygon                 (Az) was measured as the outward direction of the
with an individual nomenclature (Fig. 4A and B),                 median axis (=length) with respect to the geographical
and linked to a database with its corresponding                  north (sensu Evans and Cox, 1995) using a GIS
parametric information, generated in a Geographical              (Fig. 4B). Eight aspect intervals were established:
Information System (ArcGIS 10 software). This                    N (337.5-22.5°), NE (22.5-67.5°), E (67.5-112.5°)
procedure allowed the confection of a series of maps             SE (112.5-157.5°), S (157.5-202.5°), SW (202.5-
showing the metric attributes of cirques (height                 247.5°), W (247.5-292.5°) and NW (292.5-337.5°).
range, length/width ratio, length/height range ratio             The minimum floor altitude (Altmin), maximum
and floor elevation) that were useful to examine                 headwall altitude (Altmax) and mean altitude (Altmean)
different patterns in morphometry and spatial                    of each cirque were automatically derived from the
distribution of cirques. When measuring compound                 DEM. Finally, bedrock lithology (based on Olivero
cirque properties, inner cirques were included within            and Martinioni, 2001, and Olivero and Malumián,
them, because their presence does not alter the                  2008) and main structures (after Menichetti et al.,
morphology or dimensions of the former, according                2008; Esteban et al., 2014; Torres-Carbonell et al.,
to the parameters used in this study. Cirques were               2014, and Bran et al., 2018) were recorded in order
analysed in two groups: a) compound and simple                   to analyse their effect on cirque size and morphology
cirques, and b) inner cirques (Fig. 1B). In this work            (Fig. 2).
we refer to both simple and compound cirques as                      Morphometric parameters were analysed in
"first-order cirques" or simply as "cirques".                    terms of minimum, average and maximum values,

TABLE 1. DEFINITION OF MORPHOMETRIC ATTRIBUTES OF CIRQUES DIRECTLY MEASURED, AND
         DERIVATIVES THEREOF (FIG. 4 PORTRAYS SOME DEFINITIONS).

   Morphometric parameter                                                 Definition

 Length (L)                    Length of median axis, measured along a straight line connecting the midpoint of the cirque
                               threshold (cirque focus) with the headwall, dividing the cirque plan area into two equal halves
                               (sensu Evans and Cox, 1995).
 Width (W)                     Distance measured along the longest line perpendicular to median axis (sensu Evans and Cox, 1995).
 Height range (H)              Difference between minimum altitude of cirque floor (Altmin) and maximum altitude of cirque
                               headwall (Altmax) (sensu Aniya and Welch, 1981).
 Area (A)                      Planar surface of the cirque. Automatically calculated in a GIS.
 Size                          3
                                √LWH (sensu Evans, 2006a).

 Mean slope gradient (Smean)   Mean inclination of the cirque real surface (3D) in degrees. Automatically obtained in a GIS,
                               based on a slope map generated from a DEM.
 L/W ratio                     Describes planimetric shape of the cirque, expressing cirque elongation.

 L/H ratio                     Is a measure of cirque incision; lower values indicate larger incision, and consequently higher
                               overall cirque gradient (Hughes et al., 2007).
 W/H ratio                     Similar to the L/H ratio, this is a measure of cirque incision (Hughes et al., 2007).
 Circularity index (Circ.)     Obtained by dividing the perimeter of the cirque by the circumference of a circle with the same
                               area as the cirque in plan (compactness index of Gravelius, 1914). It describes cirque planform
                               (values of 1 means perfect circularity).
326 Morphometry and spatial distribution of glacial cirques in the Western Fuegian Andes of Argentina...
mean, median, standard deviation and percentiles constitution (i.e., headwall, floor and threshold well
10% and 90%. The degree of association between defined), and are almost unaltered by post-glacial
variables was established by multivariate correlation processes, like fluvial incision and mass movements
procedures, with the calculation of Pearson's product (Fig. 5).
moment correlation coefficient (r).
5.1. Cirque dimensions and morphology
5. Results
The total cirque set covers the 19.5% of the planar
Figure 1B shows 253 first-order cirques and 99 surface encompassed by the mountainous segment
inner cirques identified and mapped in southwestern considered (intermountain valleys excluded). For
Fuegian Andes for detailed study. From the total of 80% of first-order cirques, length (L) ranges from
first-order cirques, 20.2% are located in valley-head 380 m to 1,410 m (mean L=812 m), width (W) ranges
settings and 17.8% correspond to compound-type from 360 m to 1,430 m (809 m) height range (H)
cirques, which are usually valley-side cirques (68.9%). varies between 167 m to 514 m (332 m) and area (A)
Cirques generally exhibit a clear morphological falls in the interval between 0.11 km2 and 1.65 km2
FIG. 5. Photographs of cirques of diverse stages of development, relative position in valleys and bedrock lithology. A. Small valley-
head cirque at the end of Cañadón de la Oveja valley, in the Martial Mountains, closed in the threshold by prominent moraines
of the Little Ice Age (Yahgan Formation). B. Steep-floored valley-side cirque from the Martial Mountains, carved on strongly
folded metasedimentary units from the Jurassic-Cretaceous (Yahgan Formation). C. A well defined valley-side cirque from
the Vinciguerra Range, containing an inner cirque that is visible in the left side of the cirque (shown in frontal view in the
inset image) (Yahgan Formation). Laguna Encantada tarn occupies the bottom of the basin. D. A wide valley-side cirque in
the Vinciguerra Range, formed on intensely altered volcanic and sedimentary jurassic rocks (Lemaire Formation), with an
irregular floor but a clearly distinguishable threshold. Rock bedding perpendicular to former ice flow likely caused variations
in bedrock erodibility (i.e., erosion enhanced along-strike), promoting cirque broadening over lengthening. See figure 1B for
cirque locations.Oliva et al. / Andean Geology 47 (2): 316-350, 2020 327
(0.66 km2) (Table 2). Two cirques with significantly smaller to bigger size interval, are 1.10 (49.8% of
higher dimensions than the average were identified, cirque set), 1.05 (39,4%), 1.06 (9.9%) and 1.03
with mean A of 6.71 km2, mean L of 2,300 m, mean (0.8%), respectively. Circularity, with a mean value
W of 3,700 m and mean H of 712 m. These cirques of 1.10, shows the same trend as L/W (mean values
were not considered in the statistical analysis of data of 1.09, 1.11, 1.10 and 1.08 for the same increasing
because of their unrepresentativeness, therefore all size intervals). For 80% of the cirques, the L/W index
tables and correlations are based on the remaining varies in the range of 0.63-1.57 (Table 2; Fig. 8),
251 first-order cirques to which is alluded to in this and circularity is included in the interval of 1.05-
work. Cirques exhibiting larger planar dimensions 1.17 (Table 2). Cirques with higher L/W values are
are concentrated on the eastern portion of the studied dominant on the central and western sectors of the
range (E half of Sorondo Range), although the two study area (Martial Mountains, Vinciguerra Range
more areally developed cirques in the set are located and western extreme of Sorondo Range), while the
towards the W, in the Vinciguerra Range. This range lower values are uniformly distributed, although they
and the Martial Mountains contain the majority of abound in the central-eastern portion of Sorondo
cirques with lower areal extent. Range (Fig. 7B). The correlation between L, W,
As cirques expand, L and W exhibit a higher rise and A is high: r=0.77 between L and W; r=0.90
than H (Fig. 6A); nevertheless, vertical growth is more between L and A, and r=0.87 between A and W
concomitant with L than with W. This allometric-type (Table 3); this indicates that headwall retreat was
development is also confirmed by the greater degree generally produced in conjunction with cirque
of correlation of L and A with Size and A parameters, widening (Federici and Spagnolo, 2004; Barr and
compared to the one presented by H in relation to Spagnolo, 2013). Most of the cirques (80%) have an
them: L-Size (r=0.92) and L-A (r=0.91); W-Size L/H ratio between 1.56 and 3.51 (mean L/H= 2.46)
(r=0.92) and W-A (r=0.87); H-Size (r=0.86) and H-A and a W/H ratio from 1.41 to 3.64 (2.48) (Table 2;
(r=0.67) (Table 3). More vertically developed cirques Fig. 8). Following the same procedure as for L/W
are located with a slight predominance towards the and circularity versus size, those two parameters
W, in Martial Mountains and Vinciguerra Range, show a rise with the increase of cirque size: 2.25,
where altitudes and gradients are higher (Fig. 7A). 2.52, 3.22 and 3.61 for L/H, and 2.27, 2.58, 3.09
The L/W shape ratio has a mean value of 1.08, and 3.49 for W/H, correspondingly. Cirques
which remains relatively constant during cirque with higher gradients (reduced L/H) are situated
development: dividing the total cirque population preferably in the centre-west sector of the mountain
according to size values into four equal intervals chain, coincidently with smaller cirques and higher
(of 410 m), mean L/W ratios for each of them, from altitudes (Fig. 7C).
TABLE 2. STATISTICS OF ANALYSED MORPHOMETRIC VARIABLES FOR 251 FIRST-ORDER CIRQUES IN
THE FUEGIAN ANDES.
L W H A Altmin Altmax Altmean L/H W/H L/W Size Smean Circ.
Mean 812 809 332 0.66 716 1,048 873 2.46 2.48 1.08 590 24 1.10
Standard dev. 437 433 131 0.72 145 132 122 0.84 0.92 0.39 262 5 0.05
Minimum 140 160 80 0.02 309 714 550 1.02 0.52 0.45 121 14 1.03
Maximum 2,530 2,580 836 4.47 1,092 1,356 1,159 6.39 5.58 3.12 1,761 41 1.39
Median 690 700 327 0.4 716 1,047 872 2.33 2.37 1.01 535 24 1.09
Percentile 10 380 360 167 0.11 538 887 702 1.56 1.41 0.63 286 18 1.05
Percentile 90 1,410 1,430 514 1.65 905 1,213 1,036 3.51 3.64 1.57 963 31 1.17
Altmin: minimum floor altitude, Altmean: cirque mean altitude, Altmax: maximum headwall altitude (all in m a.s.l); See figure 1B for
geographical settings. Remaining abbreviations as in table 1.328 Morphometry and spatial distribution of glacial cirques in the Western Fuegian Andes of Argentina...
FIG. 6. Correlation diagrams between dimensions of (A) first-order and (B) inner cirques, with length (L), width (W) and height range
(H) plotted against size (3√LAH). Allometric properties of cirques are revealed by the reduced gradient of the regression line
for height range. Pearson coefficients (r) for individual correlations are included.
TABLE 3. CORRELATION MATRIX AMONG THE ANALYSED ATTRIBUTES OF 251 FIRST-ORDER CIRQUES
IN THE FUEGIAN ANDES.
L W H A Altmin Altmax Altmean L/H W/H L/W Size Smean Circ.
L 1 0.77 0.72 0.90 -0.48 0.18 -0.25 0.61 0.23 0.24 0.92 -0.31 0.18
W - 1 0.68 0.87 -0.48 0.15 -0.26 0.32 0.59 -0.34 0.92 -0.27 0.22
H - - 1 0.67 -0.54 0.39 -0.18 -0.05 -0.12 0.06 0.86 0.25 0.15
A - - - 1 -0.46 0.16 -0.24 0.47 0.38 -0.01 0.91 -0.26 0.15
Altmin - - - - 1 0.56 0.91 -0.06 -0.06 0.04 -0.55 0.01 -0.02
Altmax - - - - - 1 0.82 -0.12 -0.18 0.11 0.24 0.26 0.12
Altmean - - - - - - 1 -0.12 -0.14 0.08 -0.26 0.17 0.01
L/H - - - - - - - 1 0.5 0.32 0.36 -0.75 0.11
W/H - - - - - - - - 1 -0.57 0.3 -0.65 0.18
L/W - - - - - - - - - 1 -0.04 -0.03 0.09
Size - - - - - - - - - - 1 -0.17 0.18
Smean - - - - - - - - - - - 1 -0.19
Circ. - - - - - - - - - - - - 1
Abbreviations as in table 1.
Valley-head cirques are equivalent in size and compound type and occur at the headwaters of
morphology to valley-side cirques. Usually, the valleys. Inner cirques are smaller in vertical and
largest cirques within the study area are of the horizontal dimensions than first-order cirques: 80%Oliva et al. / Andean Geology 47 (2): 316-350, 2020 329
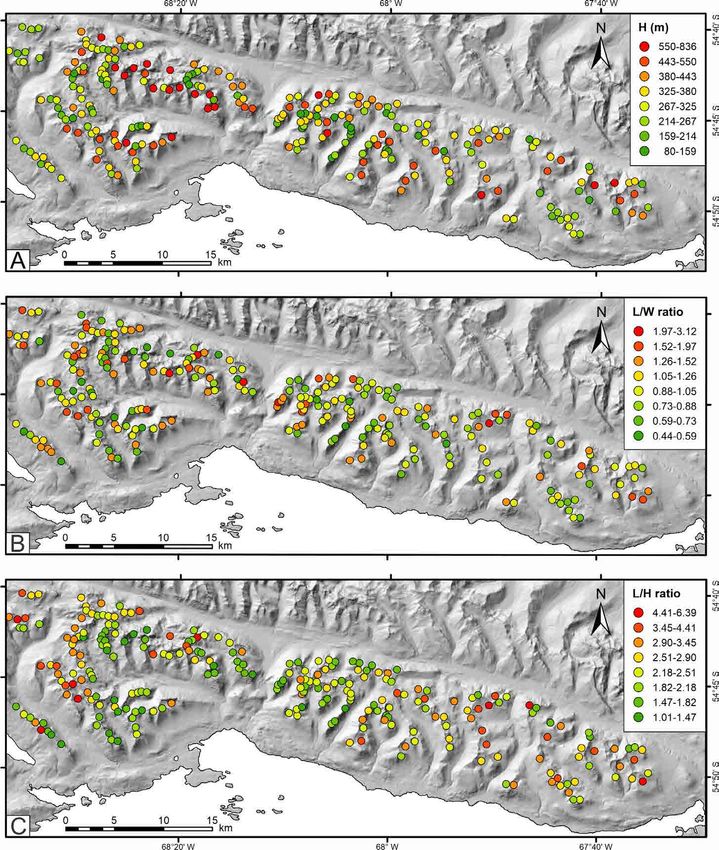
FIG. 7. Spatial distribution of first-order cirques according to A. Height range (H). B. Lengthwise elongation (L/W index). C. Incision
(L/H index).
of them have L between 260 m and 930 m (mean As observed in first-order cirques, height range
L=518 m), W between 310 m and 910 m (555 m), in inner cirques is outpaced by lengthening and
H between 69 m and 258 m (155 m) and A varies widening as size increases (Fig. 6B). Inner cirques
from 0.07 km2 to 0.56 km2 (=0.26 km2) (Table 4). have a circularity (mean=1.09) and a L/W ratio330 Morphometry and spatial distribution of glacial cirques in the Western Fuegian Andes of Argentina...
FIG. 8. First-order cirques frequency distribution of L/H, W/H and L/W shape indexes.
TABLE 4. STATISTICS OF ANALYSED MORPHOMETRIC VARIABLES FOR 99 INNER CIRQUES IN THE
FUEGIAN ANDES.
L W H A Altmin Altmax Altmean L/H W/H L/W Size Smean Circ.
Mean 518 555 155 0.26 860 1,015 769 3.72 4.26 0.97 346 25 1.09
Standard dev. 225 221 76 0.21 109 112 221 1.45 2.21 0.33 132 7 0.05
Minimum 200 220 29 0.05 578 696 297 1.52 1.24 0.49 128 10 1.02
Maximum 1,100 1,090 377 0.96 1,080 1,248 1,144 8.46 12.09 2.15 709 44 1.31
Median 470 520 150 0.21 863 1,012 798 3.53 3.67 0.88 328 25 1.08
Percentile 10 260 310 69 0.07 707 880 420 2.17 2.11 0.62 189 14 1.04
Percentile 90 930 910 258 0.56 1,004 1,164 1,038 5.60 7.08 1.53 553 34 1.16
Abbreviations as in table 1.
(mean=0.97) similar to first-order cirques, but 5.2. Cirque altitude
their mean values of L/H (3.72) and W/H (4.26)
are modestly higher (Table 4). Cirque floor altitudes (Altmin) in the studied
As expectable, inner cirques tend to grow within ranges are distributed between 309 and 1,092 m
the largest first-order cirques, mainly the more a.s.l., and 80% of them cover an interval between
developed in height range. In fact, compound cirques 538 and 905 m a.s.l. (mean: 716 m a.s.l.; standard
(commonly placed in headwater settings: 67,4% of deviation: 145 m a.s.l.) (Table 2). Nevertheless,
cases), account for the largest sizes and areas among cirque altitude declines from W to E, in concordance
the studied cirques. For inner cirques, circularity and with the reduction of range elevation (Figs. 3 and 9).
L/W ratio rises weakly with increasing size. For 80% In the Martial Mountains and the Vinciguerra Range
of inner cirques, L/H and W/H values are between (127 cirques), which constitute the southwest
2.17 and 5.60 (mean value=3.72), and from 2.11 to portion of the Argentine Fuegian Andes, the altitude
7.08 (mean value=4.26), respectively (Table 4); both of 80% of cirque floors is concentrated between
decline moderately as their dimensions enlarge. The 613 and 953 m a.s.l. (mean: 788 m a.s.l.; standard
remaining characteristics expose similar trends and deviation: 131 m a.s.l.), whereas in the eastern
correlations to those observed for first-order cirques portion of Sorondo Range (47 cirques), 80% of the
(Table 5), and no proportionality in size or shape cirques have an Altmin between 440 and 743 m a.s.l.
parameters between them is noticed. (mean: 596 m a.s.l.; standard deviation: 114 m a.s.l.)Oliva et al. / Andean Geology 47 (2): 316-350, 2020 331
TABLE 5. CORRELATION MATRIX AMONG THE ANALYSED ATTRIBUTES OF INNER CIRQUES IN THE
FUEGIAN ANDES.
L W H A Altmin Altmax Altmean L/H W/H L/W Size Smean Circ.
L 1 0.64 0.72 0.86 -0.45 0.05 0.18 0.10 -0.23 0.51 0.92 0.20 0.37
W - 1 0.43 0.86 -0.30 0.00 0.08 0.10 0.26 -0.28 0.78 0.05 0.32
H - - 1 0.63 -0.32 0.37 0.26 -0.52 -0.63 0.41 0.86 0.23 0.22
A - - - 1 -0.43 0.01 0.09 0.07 -0.01 0.10 0.91 0.10 0.31
Altmin - - - - 1 0.77 0.37 -0.06 0.11 -0.25 -0.42 0.09 0.07
Altmax - - - - - 1 0.53 -0.41 -0.31 0.03 0.17 0.24 0.22
Altmean - - - - - - 1 -0.11 -0.12 0.15 0.20 0.41 0.25
L/H - - - - - - - 1 0.78 -0.01 -0.17 -0.15 0.08
W/H - - - - - - - - 1 -0.57 -0.28 -0.19 0.08
L/W - - - - - - - - - 1 0.27 0.22 0.16
Size - - - - - - - - - - 1 0.19 0.33
Smean - - - - - - - - - - - 1 0.12
Circ. - - - - - - - - - - - - 1
Abbreviations as in table 1.
FIG. 9. Geographical distribution of first-order cirques’ minimum floor altitude (Altmin).
(Table 6). Comprising the entire set of cirques in the 749 m a.s.l.; 16.3%) and SW (Altmin: 743 m a.s.l.;
studied area, it is observed that Altmean is markedly 10.8%), and lowest cirques exposed to the N
correlated with Altmin (r=0.91) and Altmax (r=0.82), (627 m a.s.l.; 7.6%), NW (647 m a.s.l.; 3.6%) and
but the correlation of these altitudinal variables with NE (673 m a.s.l.; 13.6%) (Table 7).
other metrics is not statistically significant (Table 3). Cirques situated at lower topographic positions
L, W and A attributes show a stronger (negative) are more likely to contain inner cirques, and these
correlation with Altmin (-0.46332 Morphometry and spatial distribution of glacial cirques in the Western Fuegian Andes of Argentina...
TABLE 6. STATISTICS OF ALTITUDINAL PARAMETERS FOR FIRST-ORDER CIRQUES IN THE STUDIED RANGES.
Martial Mountains - Vinciguerra Range Eastern Sorondo Range
n=127 Altmin Altmax Altmean n=47 Altmin Altmax Altmean
Mean 788 1,132 343 Mean 596 934 338
Standard dev. 131 106 143 Standard dev. 114 96 133
Minimum 526 846 89 Minimum 309 714 137
Maximum 1,092 1,356 748 Maximum 802 1,146 836
Median 792 1,136 329 Median 597 926 324
Percentile 10 613 979 169 Percentile 10 440 796 192
Percentile 90 953 1,269 571 Percentile 90 743 1,054 511
Altmin: (minimum floor altitude), Altmean: (cirque mean altitude), Altmax: (maximum headwall altitude) (all in m a.s.l). See figure 1B
for geographical settings.
TABLE 7. MEAN VALUES OF THE ANALYSED ATTRIBUTES FOR FIRST-ORDER CIRQUES WITH RESPECT
TO THE MAIN EIGHT AZIMUTHAL CLASSES.
Azimuth N NE E SE S SW W NW
Number of cirques 19 34 40 57 41 27 24 9
Percentage of total 7.57 13.55 15.94 22.71 16.33 10.76 9.56 3.59
L (m) 770 763 808 873 917 696 776 688
W (m) 808 822 855 808 856 712 747 821
H (m) 358 337 320 333 364 287 316 333
A (km ) 2
0.55 0.69 0.65 0.76 0.83 0.44 0.51 0.56
Altmin (m a.s.l.) 627 673 710 722 749 743 781 647
Altmax (m a.s.l.) 985 1,009 1,030 1,055 1,113 1,030 1,097 980
Altmean (m a.s.l.) 796 839 863 877 922 879 921 803
L/H 2.27 2.21 2.56 2.61 2.54 2.46 2.49 2.10
W/H 2.37 2.42 2.73 2.43 2.35 2.69 2.40 2.45
L/W 1.00 1.03 1.04 1.14 1.16 0.98 1.12 0.99
Size (m) 594 582 593 604 646 515 559 561
Smean (degrees) 25 25 23 24 26 23 24 25
Circularity 1.10 1.09 1.11 1.10 1.09 1.10 1.09 1.12
Land surface % 11.9 12.9 12.2 13.2 15 15.2 10.7 8.8
Abbreviations as in table 1.
(r=0.53) are much weaker for inner cirques, and 5.3. Cirque azimuth
correlations between these variables and the remaining
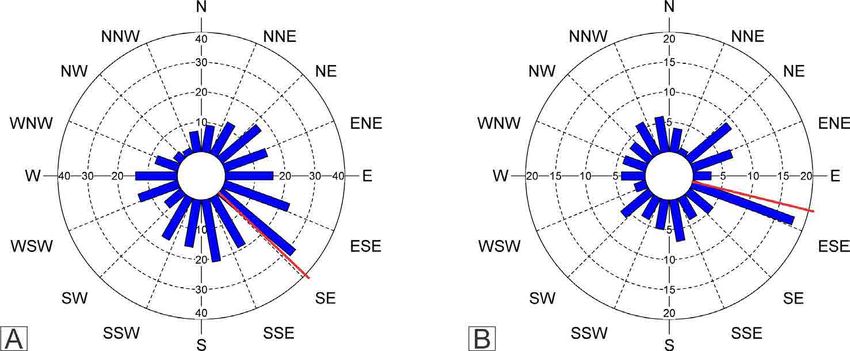
parameters are also low (Table 5). Inner cirques When the entire first-order cirque population
occupying higher positions are exposed to the N is considered, it shows a mean aspect of 134º (SE)
(Altmin=919 m a.s.l.; 11.1% of the studied set) and W (Fig. 10A). The largest number of cirques (22.7%) is
(884 m a.s.l.; 8.1%), while the lower ones face towards found in the range of 112.5° to 157.5° (SE) (Table 7),
the SE (Altmin: 808 m a.s.l.; 15.2%), E (839 m a.s.l.; with the highest frequency peak in the 120-130°
19.2%) and S (841 m a.s.l.; 14.1%) (Table 8). interval (8.5%). Other common aspects are S (16.3%)Oliva et al. / Andean Geology 47 (2): 316-350, 2020 333
TABLE 8. MEAN VALUES OF THE ANALYSED MORPHOMETRIC PARAMETERS FOR INNER CIRQUES WITH
RESPECT TO THE MAIN EIGHT AZIMUTHAL CLASSES.
Azimuth N NE E SE S SW W NW
Number of cirques 11 13 19 15 14 10 8 9
Percentage of total 11.1 13.1 19.2 15.2 14.1 10.1 8.1 9.1
L (m) 397 418 585 633 541 437 554 518
W (m) 484 535 556 567 602 598 568 535
H (m) 142 117 174 171 154 110 175 186
A (km2) 0.16 0.21 0.31 0.33 0.30 0.22 0.23 0.27
Altmin (m a.s.l.) 919 878 839 808 841 883 884 875
Altmax (m a.s.l.) 1,061 995 1,013 979 995 993 1,059 1,061
Altmean (m a.s.l.) 780 647 715 778 731 877 908 778
L/H 3.03 3.88 3.71 3.95 4.13 4.50 3.38 2.89
W/H 3.62 5.08 3.84 3.76 4.69 6.36 3.69 3.17
L/W 0.90 0.83 1.06 1.14 0.98 0.75 1.03 0.95
Size (m) 295 292 374 388 361 298 371 368
Smean (degrees) 23 24 26 24 27 26 27 22
Circularity 1.09 1.11 1.08 1.1 1.1 1.06 1.09 1.1
Land surface % 11.9 12.9 12.2 13.2 15 15.2 10.7 8.8
Abbreviations as in table 1.
FIG. 10. Distribution of (A) first-order and (B) inner cirques according to their median axis aspect. The red radial line denotes the
mean azimuth of cirque population.
and E (15.9%), and only 3.6% of cirques are NW- cirques present a sensible scattering in their aspect
facing (Table 7). In general, southward orientations compared to first-order cirques, with a strong ESE
(SW, S, SE; 247.5° to 112.5°) (Fig. 11) include a bias (mean aspect of 104°) (Fig. 10B; Table 8), and
higher proportion of cirques (49.8%) than northward the highest azimuthal peak in the 110-120° segment
aspects (NW, N, NE; 292.5° to 67.5°) (24.7%). Inner (9%). Less frequently, inner cirques are disposed to334 Morphometry and spatial distribution of glacial cirques in the Western Fuegian Andes of Argentina...
FIG. 11. Glacial cirques exposed to the S-SE-E interval, which represents the most climatically favoured aspect for glacial mass
balance. Photographs were taken between January and March, when snow from previous winter was still present in the most
sheltered parts of cirques (A and B), or was covering the entire surface of small ice bodies that persist in the highest sectors
of some cirques (C and D). (Location of cirques: A. Martial Mountains; B. Vinciguerra Range; C-D. Alvear Range, just in
front of Vinciguerra Range).
the SE (15.2%) and S (14.1%), and only 8.1% face W. sides of two valleys, whilst the remaining cirques
Compared with first-order cirques, there are fewer are equitably distributed on rocks of the Lemaire
inner cirques oriented to the three southward sectors (44.6%) and Yahgan (51.8%) formations.
(SW, S, SE; 39.4%), and relatively more of them with No significant differences between morphometric
northward aspects (NW, N, NE; 33.3%) (corresponding and altitudinal properties were observed in cirques
values for first-order cirques are 50.1% and 24.9%). developed on both dominant lithological types,
Whatever their aspect, inner cirques tend to form although cirques formed on rocks of the Yahgan
mostly inside E- to S-facing cirques. Formation (Fig. 5A, B and C) have mean size (608)
and mean altitudinal parameters (mean Altmin, Altmax,
5.4. Lithology Altmean=724, 1,069 and 891 m a.s.l., respectively)
slightly higher than those developed on rocks of
Three lithological classes in different surface the Lemaire Formation (Fig. 5D) (mean size=580;
proportions are distinguished in the area: the rocks of mean Altmin, Altmax, Altmean=713, 1,033, 859 m a.s.l.,
the Lapataia Formation (phyllites and amphibolites) correspondingly). On the rocks of the Yahgan
(7%), those of the Lemaire Formation (schists, breccias Formation, which constitutes most of the southern
and rhyolites) (41%) and those of the Yahgan Formation regional slope of the study area, 61% of the cirques
(black shales, tuffs and sandstones) (52%) (Fig. 2). face SE, and only 19% of them face N sector,
Only nine cirques were counted in the domain of the whereas on the rocks of the Lemaire Formation,
Lapataia Formation (3.6% of the total set), on the which mostly conforms the northern slopes, cirquesYou can also read