Multi-scale data on intertidal macrobenthic biodiversity and environmental features in three New Zealand harbours
←
→
Page content transcription
If your browser does not render page correctly, please read the page content below
Earth Syst. Sci. Data, 12, 293–297, 2020
https://doi.org/10.5194/essd-12-293-2020
© Author(s) 2020. This work is distributed under
the Creative Commons Attribution 4.0 License.

                      Multi-scale data on intertidal macrobenthic
                      biodiversity and environmental features in
                             three New Zealand harbours
                              Casper Kraan1,2,a , Barry L. Greenfield3 , and Simon F. Thrush4
                   1 Helmholtz   Institute for Functional Marine Biodiversity at the University of Oldenburg,
                                   Ammerländer Heerstraße 231, 23129 Oldenburg, Germany
            2 Department of Functional Ecology, Alfred Wegener Institute, Helmholtz Centre for Polar and Marine

                                 Research, Am Handelshafen 12, 27570 Bremerhaven, Germany
           3 National Institute of Water and Atmospheric Research, P.O. Box 11-115, Hamilton 3216, New Zealand
           4 Institute of Marine Science, University of Auckland, Private Bag 92019, Auckland 1142, New Zealand
               a currently at: Thünen Institute of Sea Fisheries, Herwigstraße 31, 27572 Bremerhaven, Germany

                                 Correspondence: Casper Kraan (casper.kraan@thuenen.de)

                                 Received: 27 August 2019 – Discussion started: 16 September 2019
                        Revised: 19 January 2020 – Accepted: 21 January 2020 – Published: 10 February 2020

       Abstract. Understanding how the plants and animals that live in the sea floor vary in their spatial patterns of
       diversity and abundance is fundamental to gaining insight into the role of biodiversity in maintaining ecosystem
       functioning in coastal ecosystems, as well as advancing the modelling of species distributions under realistic as-
       sumptions. Yet, it is virtually unknown how the relationships between abundance patterns and different biotic and
       environmental processes change depending on spatial scales, which is mainly due to a lack of data. Within the
       project Spatial Organization of Species Distributions: Hierarchical and Scale-Dependent Patterns and Processes
       in Coastal Seascapes at the National Institute for Water and Atmospheric Research (NIWA) in New Zealand we
       collected multi-scale and high-resolution data on macrobenthic biodiversity. We found 146 species dominated
       by bivalves, polychaetes, and crustaceans ( > 500 µm) that live hidden in marine sandflats and collected point
       measurements of important environmental variables (sediment grain-size distributions, chlorophyll a concentra-
       tion, organic content, and visible sandflat parameters) in three large intertidal harbours (Kaipara, Tauranga, and
       Manukau). In each harbour we sampled 400 points for macrobenthic community composition and abundances, as
       well as the full set of environmental variables. Using an elaborate sampling design, we were able to cover scales
       from 30 cm to a maximal extent of 1 km. All data and extensive metadata are available from the data publisher
       PANGAEA via the persistent identifier https://doi.org/10.1594/PANGAEA.903448 (Kraan et al., 2019).

1   Introduction                                                   pending on spatial scales (e.g. Lohrer et al., 2015; Kraan et
                                                                   al., 2015).
Understanding how the plants and animals that live in the sea         Most broad-scale research on mapping species distribu-
floor vary in their spatial patterns of diversity, biomass, and    tions ignores spatial patterns (Kraan et al., 2010), scale-
abundance is fundamental to gaining insight into the role of       dependent variability (Kraan et al., 2015), and biotic in-
biodiversity in maintaining ecosystem functioning in coastal       teractions (Dormann et al., 2018), rendering these topics a
ecosystems, as well as advancing the modelling of species          main frontier in ecology (Araújo and Luoto, 2007). More-
distributions under realistic assumptions. Yet, it is virtually    over, twisting these often separate lines of research together
unknown how the relationships between abundance patterns           requires the availability of data to support such research. At
and different biotic and environmental processes change de-        present, data that allow for bridging the gap between small-

Published by Copernicus Publications.
294 C. Kraan et al.: Multi-scale data on intertidal macrobenthic biodiversity
Given the scarcity of large-scale high-resolution biodiver-
sity data identified to the lowest taxonomic level possible, as
well as associated point measurements of environmental fea-
tures like sediment grain-size parameters, chlorophyll a con-
centration, organic content, and visible sandflat parameters,
such as the coverage of seagrass or shell hash (broken shell
fragments), we publish these one-of-a-kind data (see Kraan
et al., 2019) here so that they can serve as key data to advance
and support future multi-scale biodiversity studies.
2 Material and methods
2.1 Fieldwork
Sampling of macrobenthic fauna and environmental vari-
ables was conducted during austral summer 2012 in Kaipara,
Manukau, and Tauranga harbours, North Island, New
Zealand (Table 1). Physical descriptions of each of these ar-
eas can be sourced from a large number of publications by
Simon F. Thrush and co-workers (e.g. Thrush et al., 2003).
In each harbour we took 400 cores (13 cm diameter, 20 cm
deep) on a predetermined grid (four 1000 m transects, spaced
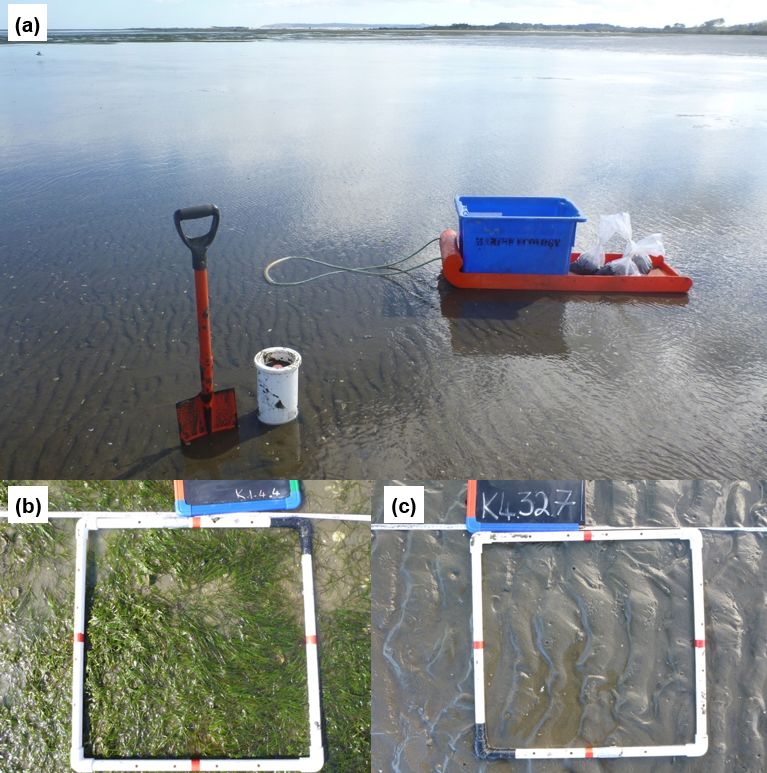
Figure 1. (a) Example of a sampling area during low tide and the
at 100 m) on foot during low tide (n = 3 · 400; 1200 in to-
low-tech gear used for sampling. Examples of (b) a high-density
seagrass sampling point and (c) a sandy sampling point (photos:
tal), thereby covering the area from the high- to low-water
Casper Kraan). mark (Fig. 1 for an illustration). Sampling points along tran-
sects were spaced at distances of 30 cm, 1 m, 5 m, 10 m, 30 m,
50 m, 100 m, 500 m, and 1000 m (see Fig. 1 in Kraan et al.,
scale and landscape-scale ecological research, enabling a full 2015), located by using a measuring tape and handheld GPS.
inference of patterns and processes from the individual to the Given the close proximity of sampling locations we provide
landscape scale across environmental gradients, are scarce. sampling coordinates in NZTM (New Zealand Transverse
The research project Spatial Organization of Species Dis- Mercator; Geodetic CRS: NZGD2000; unit: metres) at the
tributions: Hierarchical and Scale-Dependent Patterns and data publisher PANGAEA (Kraan et al., 2019). Cores were
Processes in Coastal Seascapes at the National Institute for sieved in the field (500 µm mesh) and the residue preserved
Water and Atmospheric Research (NIWA) in New Zealand with 70 % isopropyl alcohol.
aimed to assess scale-dependent variation in species distri- Prior to destructive sampling, we took a photograph of
butions across environmental gradients in estuarine commu- 50 cm × 50 cm at each sampling point (n = 960) to assess the
nities dominated by bivalves, polychaetes, and crustaceans coverage of seagrass (Zostera muelleri), bare sand, and shell
that live hidden in marine sandflats. By employing an elabo- hash. In addition, at each point (n = 960), we pooled three
rate sampling scheme, we covered a large number of differ- surface sediment cores (2 cm diameter, 2 cm deep) for sed-
ent spatial scales with enough replicate samples within each iment grain-size analyses (median grain-size and sediment
scale to allow for explicit spatial analysis and warrant statis- fractions), chlorophyll a measurements, and determination
tical power during analysis (see Kraan et al., 2015; Green- of the organic content of the sediment (Table 1). These sam-
field et al., 2016). This efficient sampling design allowed ples were stored in the dark on ice immediately after col-
us to map intertidal macrobenthic fauna from the scale of lecting. Note that at the smallest spatial scale, i.e. 30 cm, we
a few centimetres to a maximal extent of 1 km. We focussed took three adjoining benthic cores, but we limited ourselves
on macrobenthos (organisms > 500 µm) due to their role in to taking one photograph and one sediment sample to rep-
ecosystem functioning (e.g. Thrush et al., 2017), their abil- resent the environmental features for these three locations.
ity to serve as sentinels for change (e.g. Hewitt and Thrush, This was done to economically manage our time in the field
2009; Kraan et al., 2009), and the relative ease of collecting and our financial budget for processing samples, leading to
samples (Fig. 1). To increase the generality of our field study, 320 photographs and 320 sediment samples per harbour. See
we performed this sampling along an environmental gradient Kraan et al. (2015, 2019) or Greenfield et al. (2016) for de-
from the mangroves to the lower end of the intertidal zone in tails.
three large intertidal harbours (Manukau, Kaipara, and Tau-
ranga harbours in the North Island, New Zealand).
Earth Syst. Sci. Data, 12, 293–297, 2020 www.earth-syst-sci-data.net/12/293/2020/C. Kraan et al.: Multi-scale data on intertidal macrobenthic biodiversity 295
Table 1. Regional summary of collected data and their mean values to give an impression of their physical appearance and the macrobenthic
benthic biodiversity they harbour.
Fieldwork 2012 Region
Manukau Tauranga Kaipara
Sampling 4–5 May 23–25 April 18–19 April
Sediment samples (n) 320 320 320
Organic content samples (n) 320 320 320
Chlorophyll a samples (n) 320 320 320
Visible sandflat parameters (n photos) 318 319 297
Lost photos due to water coverage m.1.10.9, m.4.39.7 k1.4.2, k2.19.4, k2.19.5, t1.8.5
k2.19.6, k2.19.7, k2.19.8,
k2.19.9, k2.19.10, k2.20.1,
k2.20.2, k2.20.3, k2.20.4,
k2.20.5, k2.20.6, k2.20.7,
k2.20.8, k2.20.9, k2.20.10,
k4.31.1, k4.31.2, k4.31.3,
k4.37.3, k4.38.10
Macrobenthos samples (n) 400 399 398
Lost macrobenthos samples T4.35.5 K3.24.3, k4.35.5
Results of laboratory work 2012–2014
Species identified (n) 109 81 114
Individuals (n) 26 573 25 394 21 846
Median grain size (µm) 166 197 213
Silt (% < 63 µm) 14 5 1
Very fine sediments (% 63–125 µm) 17 17 6
Fine sediments (% 125–250 µm) 48 44 6
Medium sediments (% 250–500 µm) 18 28 32
Coarse sediments (% > 500 µm) 3 6 0.4
Organic content (%) 2 2 0.8
Chlorophyll a (mg g−1 ) 23 11 5
Bare sand cover (%) 79 73 84
Shell hash cover (%) 16 3 2
Seagrass cover (%) 5 23 13
2.2 Macrobenthic data removed. For measuring, 0.1 g of sediment was weighed,
topped up with 90 % acetone buffer, and centrifuged for
In the laboratory, rose-bengal-stained (2 %) taxa were identi-
10 min at 3300 rpm. Chlorophyll a and pheophytin concen-
fied to the lowest practical taxonomic resolution and their
trations (n = 960) were determined with a fluorometer using
abundance assessed. In total we identified 146 species,
standard methods (see Kraan et al., 2015). The first sample
mostly bivalves, polychaetes, and crustaceans, encompass-
was measured on 10 May 2012, and the last sample was mea-
ing 73 813 individuals (Table 1; Supplement, Kraan et al.,
sured on 28 June 2012, avoiding degradation of samples over
2019). For bivalves, the longest shell axis was also measured,
time (see Kraan et al., 2019).
allowing adults and juveniles to be distinguished, because
habitat preferences can differ between adults and juveniles
(Kraan et al., 2010, 2013). Size classes were categorized as
< 1, 1–5, 5–10, 10–15, 15–20, 20–25, 25–30, 30–35, 35–40, 2.4 Sediment grain-size distributions
and > 40 mm. Each sample was sorted and its taxa identified
by Casper Kraan, after which Barry L. Greenfield verified To determine sediment median grain-size and sediment frac-
species identifications on each sample (Kraan et al., 2019). tions (silt < 63 µm, very fine 63–125 µm, fine 125–250 µm,
medium 250–500 µm, and coarse > 500 µm), sediment grain
sizes were measured (n = 960), following standard methods
2.3 Chlorophyll a measurements
for using a Malvern Mastersizer 2000 with a particle range of
Sediment samples were freeze-dried upon arrival in the lab- 0.02–2000 µm (see Kraan et al., 2015). This involved digest-
oratory. Prior to freeze-drying, seagrass and bivalves were ing about a teaspoon of sediment by adding 10 % hydrogen
www.earth-syst-sci-data.net/12/293/2020/ Earth Syst. Sci. Data, 12, 293–297, 2020296 C. Kraan et al.: Multi-scale data on intertidal macrobenthic biodiversity
peroxide to remove organic content from the sediment, leav- Financial support. This research has been supported by the
ing it to digest for 7 d, and stirring every couple of days. Royal Society of New Zealand, Marsden Fund (grant no. NIW-
1102) and the FP7 People: Marie-Curie Actions (BAYESIAN-
METAFLATS (grant no. 298380)).
2.5 Organic content of the sediment
Organic content (n = 960) was determined after burning a
teaspoon of freeze-dried sediment for 5.5 h in a furnace at Review statement. This paper was edited by Francois Schmitt
560 ◦ C, i.e. the loss-on-ignition approach. and reviewed by Clément Garcia and Olivier Beauchard.
2.6 Visible sandflat parameters
References
The coverage of seagrass, shell hash, and bare sand within
each photograph (n = 960) was estimated based on 75 ran- Araújo, M. B. and Luoto, M.: The importance of biotic interactions
dom points within a photograph using the software CPCe for modelling species distributions under climate change, Global
(Kohler and Gill, 2006) (see Kraan et al., 2019). Ecol. Biogeogr., 16, 743–753, https://doi.org/10.1111/j.1466-
8238.2007.00359.x, 2007.
Dormann, C. F., Bobrowski, M., Dehling, D. M., Harris, D. J., Har-
3 Data availability tig, F., Lischke, H., Moretti, M., Pagel, J., Pinkert, S., Schle-
uning, M., Schmidt, S. I., Sheppard, C. S., Steinbauer, M. J.,
All data collected during this project, including ex- Zeuss, D., and Kraan, C.: Biotic interactions in species dis-
tensive metadata, are available from the data pub- tribution modelling: ten questions to guide interpretation and
lisher PANGAEA (Kraan et al., 2019). For conve- avoid false conclusions, Global Ecol. Biogeogr., 27, 1004–1016,
nience, all data are grouped into a parent dataset https://doi.org/10.1111/geb.12759, 2018.
(https://doi.org/10.1594/PANGAEA.903448; Kraan et al., Douglas, E. J., Pilditch, C. A., Kraan, C., Schipper, L. A., Lohrer,
2019). A. M., and Thrush, S. F.: Macrofaunal functional biodiversity
A number of scientific studies have used these data. For provides resilience to nutrient enrichment in coastal sediments,
Ecosystems, 7, 1324–1336, https://doi.org/10.1007/s10021-017-
example, Kraan et al. (2015) described the cross-scale varia-
0113-4, 2017.
tion in biodiversity–environment links using Moran’s eigen-
Greenfield, B. L., Kraan, C., Pilditch, C. A., and Thrush, S. F.:
vector mapping (MEM). Greenfield et al. (2016) focussed on Mapping functional groups can provide insight into ecosystem
the spatial distribution of functional groups to gain insight functioning and potential resilience of intertidal sand flats, Mar.
into the scale dependency of resilience. Thrush et al. (2017) Ecol.-Prog. Ser., 548, 1–10, https://doi.org/10.3354/meps11692,
and Douglas et al. (2017) based their experimental set-up on 2016.
the spatial distribution of functional hot and cold spots to ex- Hewitt, J. E. and Thrush, S. F.: Reconciling the influence of global
perimentally study the impact of nutrient loading on ecosys- climate phenomena on macrofaunal temporal dynamics at a
tem functioning and resilience. variety of spatial scales, Glob. Change Biol., 15, 1911–1929,
https://doi.org/10.1111/j.1365-2486.2008.01825.x, 2009.
Kohler, K. E. and Gill, S. M.: Coral Point Count with Ex-
Supplement. The supplement related to this article is available cel extensions (CPCe): A Visual Basic program for the de-
online at: https://doi.org/10.5194/essd-12-293-2020-supplement. termination of coral and substrate coverage using random
point count methodology, Comput. Geosci., 32, 1259–1269,
https://doi.org/10.1016/j.cageo.2005.11.009, 2006.
Kraan, C., van Gils, J. A., Spaans, B., Dekinga, A., Bijleveld, A.
Author contributions. CK and SFT designed the study, and CK
I., van Roomen, M., Kleefstra, R., and Piersma, T.: Landscape-
and BLG carried it out. CK prepared this paper with contributions
scale experiment demonstrates that Wadden Sea intertidal flats
and the final approval of all authors.
are used to capacity by molluscivore migrant shorebirds, J.
Anim. Ecol., 78, 1259–1268, https://doi.org/10.1111/j.1365-
2656.2009.01564.x, 2009.
Competing interests. The authors declare that they have no con- Kraan, C., Aarts, G., van der Meer, J., and Piersma, T.: The
flict of interest. role of environmental variables in structuring landscape-scale
species distributions in seafloor habitats, Ecology, 91, 1583–
1590, https://doi.org/10.1890/09-2040.1, 2010.
Acknowledgements. We thank Sylvia de Juan, Andres Os- Kraan, C., Aarts, G., Piersma, T., and Dormann, C. F.: Tempo-
pina, Katie Cartner, Kelly Carter, Sarah Hailes, Hazel Need- ral variability of ecological niches: a study on intertidal ben-
ham, Clarisse Niemand, Rachel Harris, and Rebecca Gladstone- thic fauna, Oikos, 122, 754–760, https://doi.org/10.1111/j.1600-
Gallagher for their help during fieldwork and laboratory work. 0706.2012.20418.x, 2013.
Earth Syst. Sci. Data, 12, 293–297, 2020 www.earth-syst-sci-data.net/12/293/2020/C. Kraan et al.: Multi-scale data on intertidal macrobenthic biodiversity 297 Kraan, C., Dormann, C. F., Greenfield, B. L., and Thrush, S. Thrush, S. F., Hewitt, J. E., Norkko, A., Nicholls, P. E., Fun- F.: Cross-scale variation in biodiversity-environment links il- nell, G. A., and Ellis, J. I.: Habitat change in estuaries: lustrated by coastal sandflat communities, PLoS ONE, 10, predicting broad-scale responses of intertidal macrofauna to e0142411, https://doi.org/10.1371/journal.pone.0142411, 2015. sediment mud content, Mar. Ecol.-Prog. Ser., 263, 101–112, Kraan, C., Greenfield, B. L., and Thrush, S. F.: Multi-scale https://doi.org/10.3354/meps263101, 2003. data on intertidal macrobenthic biodiversity and environmen- Thrush, S. F., Hewitt, J. E., Kraan, C., Lohrer, A. M., Pilditch, A. tal features in three New Zealand harbours, PANGAEA, M., and Douglas, E. J.: Changes in the location of biodiversity- https://doi.org/10.1594/PANGAEA.903448, 2019. ecosystem function hot spots across the seafloor landscape with Lohrer, A. M., Thrush, S. F., Hewitt, J. E., and Kraan, C.: The up- increasing sediment nutrient loading, P. Roy. Soc. Lond. B Bio., scaling of ecosystem functions in a heterogeneous world, Sci. 284, 20162861, https://doi.org/10.1098/rspb.2016.2861, 2017. Rep.-UK, 5, 10349, https://doi.org/10.1038/srep10349, 2015. www.earth-syst-sci-data.net/12/293/2020/ Earth Syst. Sci. Data, 12, 293–297, 2020
You can also read