NATIONAL BUS STRATEGY BUS SERVICE IMPROVEMENT PLAN SOUTHAMPTON CITY COUNCIL
←
→
Page content transcription
If your browser does not render page correctly, please read the page content below

NATIONAL BUS STRATEGY
        BUS SERVICE IMPROVEMENT PLAN
              SOUTHAMPTON CITY COUNCIL

Section 1 – Overview
1.1 Geographical Area Covered
This Bus Service Improvement Plan (BSIP) sets out a high-level vision for buses in
Southampton, that focuses on continuing to increase bus patronage through partnership,
priority, inclusivity, integration, and affordability. It includes a road map towards achieving the
vision and specific targets which will be supported through the establishment of an
Enhanced Partnership in 2022.
This BSIP covers the Southampton City Council (SCC) Local Transport Area (LTA) as
shown in Map 1. It also references to the wider Southampton City Region “Travel to Work
Area” with a workday population of 445,000 which incorporates part of Hampshire – all of
Eastleigh Borough, part of New Forest and Test Valley District Councils. The specifics of
these are dealt with in the Hampshire BSIP but it is vital to acknowledge and collaborate on
bus network improvements where there are significant cross-border interactions between
neighbouring authorities.

                       Figure 1.1 – The Southampton LTA area covered by this BSIP

                                                   1
Southampton is a major city on the south coast with a population of 254,000 over 51.8km².
Southampton is an urban unitary authority and is a major employment, retail, healthcare,
education, and cultural centre for a wider City Region. The wider City Region extends into
Hampshire incorporating Totton, the Waterside (area of New Forest alongside Southampton
Water), Chandler’s Ford, Eastleigh, Hedge End and Hamble. The City Region is shown in
Figure 1.2. The interaction with the surrounding City Region means that the BSIP will take
account of bus services that travel into and from Southampton and SCC is collaborating with
Hampshire on the BSIP. While there will be separate BSIPs there are common themes and
synergies between each of them to ensure consistency and integration.

                              Figure 1.2 – Southampton City Region
The built-up area crosses the boundary creating a contiguous urban area set on the coast
which has shaped people’s journeys and the economic geography. This results in a
significant amount of cross boundary journeys to and from Southampton. As Southampton
doesn’t have 360° access these journeys into the city are funnelled along a limited number
of corridors and bridges.
Due to this close interaction, SCC works in very close partnership with Hampshire County
Council (HCC) and with Isle of Wight and Portsmouth City Council LTAs on cross-Solent
transport planning issues. This is through the Solent Transport partnership. Through Solent
Transport, joint Local Transport Plan policies have been developed and there has been a
history of successfully funded projects across the Solent – Local Sustainable Transport Fund
(LSTF), Better Bus Fund (BBF) and Future Transport Zone (FTZ). All of which have helped

                                               2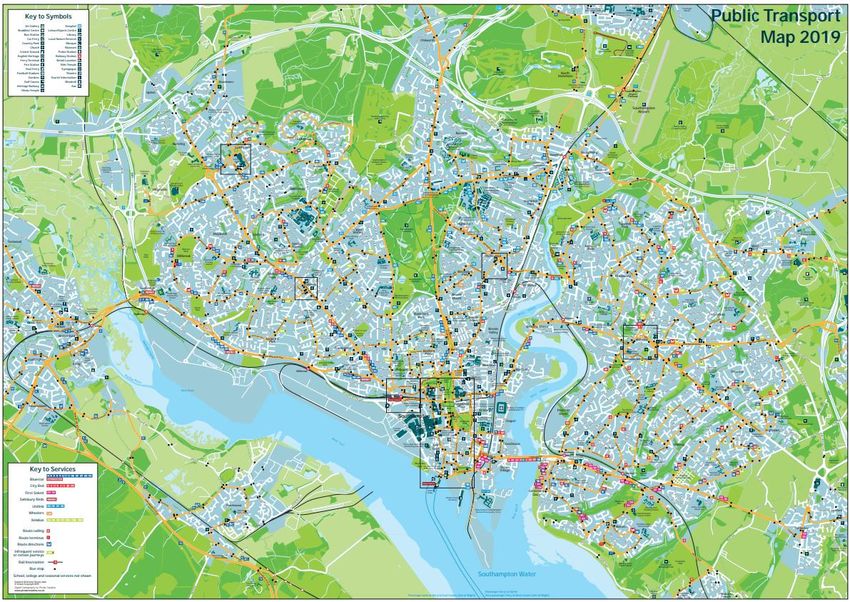
to put the Solent area at the forefront of innovation and investment in buses and people’s
bus journeys.
Recently, SCC has worked jointly with HCC on development and now delivery of the £57m
Southampton Transforming Cities (TCF) Programme. This is aiming to deliver cross-
boundary corridor-based bus and active travel improvements across the City Region, with
completion expected in 2023.
Economic Geography
The coastal geography has helped to shape Southampton’s economy with the water
providing the prosperity through the Port. But it also constrains the economy and how people
move about. The Rivers Itchen and Test form barriers to people’s common journeys, which
presents a significant barrier between the east and west of the city. The River Itchen is only
crossed by six road bridges – one of which is the M27 and another a narrow listed structure,
meaning there are only four suitable bridges for buses. The width of the River Test estuary
has supported the development of the Port, but it means that travel from west of
Southampton is funnelled across one bridge – Redbridge Causeway.

                             Figure 1.3 Points of Interest in Southampton City

 The Port of Southampton is the UK’s 3rd
                                                        Southampton Airport handled 1.78m
 largest employing 15,000 people. Part of
                                                        passengers in 2019 flying to 40 destination
 Solent Freeport
                                                        in UK and Europe.
 In 2019 it handled
                                                        Contributes £160m to UK economy.
 1.8m people on cruises,
 Over 33.1mt of cargo in 4,074 vessel                   Linked to City Centre via U1 bus
 movements – 1.87m containers and
 760,000 vehicles,

                                                    3
and 5m ferry passengers to the Isle of                 1.84m people use Southampton Airport
 Wight                                                  Parkway station.
 All worth £71bn to the UK

                                                        The Universities of Southampton and
 University Hospitals Southampton NHS                   Solent provide 35,000 students and 8,000
 Trust provide health care services to 1.9m             employees.
 people, plus specialist services to 3.7m
                                                        University of Southampton owns the
 people
                                                        UniLink bus brand
 Major centre for teaching & research.
 Staff of 11,500 treating around 150,000
 inpatients, 624,000 outpatients annually.

Following the deindustrialisation of Southampton and its growth in the second half of the 20th
Century, this has led to a dispersed residential and workplace geography. Post-war local
authority housing estates were created in the City Centre or on the outskirts and further
suburban development in Bitterne, and outside of Southampton. The development of the
M3, M27 and M271 opened access to large tracts of new development primarily accessed
by car. This has resulted in newer employment centres being out of the city. In the City
Centre there has been a growth in mixed use developments with the retail sector leading
through the opening of West Quay, which has attracted up to 16m visitors a year.
Travel Patterns
Southampton has strong cross boundary travel flows, with as many people living in the city
and travelling out for work, as coming into the city for work. Based on 2011 Census and
transport modelling (Solent Sub-Regional Transport Model) 2019 strongest flow is between
Southampton and Eastleigh – with 24,000 2-way flows daily – 7% of those journeys are by
bus. With 60% of commuting trips less than 3 miles, there is scope for a greater proportion
of these journeys to be made by bus and sustainable modes rather than by car.

                     Figure 1.4 – In and Out commuting from Southampton (2011 Census)

                                                    4
Southampton is above the England and South East averages for bus mode share for travel
to work with 9% of all trips to work in Southampton being made by bus1. This mode share
for bus compares to cities such as Bristol, Exeter, and Derby, however, it is lower than cities
such as Oxford, Brighton, Nottingham, and Reading.

                                   1%              Southampton Modal Split
                                                      3% 3%

                                   17%                                9%
                                                                                1%                    Work From Home
                                                                                                      Train
                        5%                                                                            Bus
                                                                                                      Motorcycle

                      7%                                                                              Driving Car
                                                                                                      Passenger in a Car
                                                                                                      Bicycle
                                                                                                      On Foot
                                                                                                      Other

                                                                54%

                     Figure 1.5 – Southampton Modal Split Travel to Work (2011 Census)
Each morning, over 29,000 people would travel into the City Centre on all corridors, with
56% of people travelling in a car, 18% on bus, 2% cycling, 10% by motorcycle, ferry, and
rail, and 13% walking2. Of the main corridors shown in Table 1.1, buses carry most people
on the Shirley Road corridor (59%) and a high proportion across the Itchen Bridge.
         Main Corridor                    Total           Light Vehicles              Bus         Active Travel
     Mountbatten Way                     4,918                 99%                   0.6%            0.04%
     Shirley Road                        3,115                 39%                   59%               2%
     The Avenue                          2,906                 75%                   19%               6%
     Bevois Valley                       1,250                 78%                   19%               2%
     Northam Bridge                      5,102                 84%                   15%              >1%
     Itchen Bridge                       3,517                 66%                   30%               4%
     Total                               20,808                76%                   22%               2%
          Table 1.1 – Person Modal Split on main corridors into Southampton City Centre (2019 SCC Traffic Counts)

The Covid pandemic has impacted on bus travel and modal split in Southampton. The
increase in home working has had an impact on the usage of bus as around 28% of people
living in Southampton worked from home during 20203. Bus usage dropped considerably
with buses in Autumn 2020 carrying 60% of their pre-Covid patronage levels.
Future Growth
Southampton has some bold ambitions for the future for sustainable economic growth as set
out below.4

1
  2011 Census
2
  2019 SCC AM Peak Modal Split Surveys
3
  ONS 2020 Home Working Survey
4
  Connected Southampton 2040 Transport Strategy

                                                            5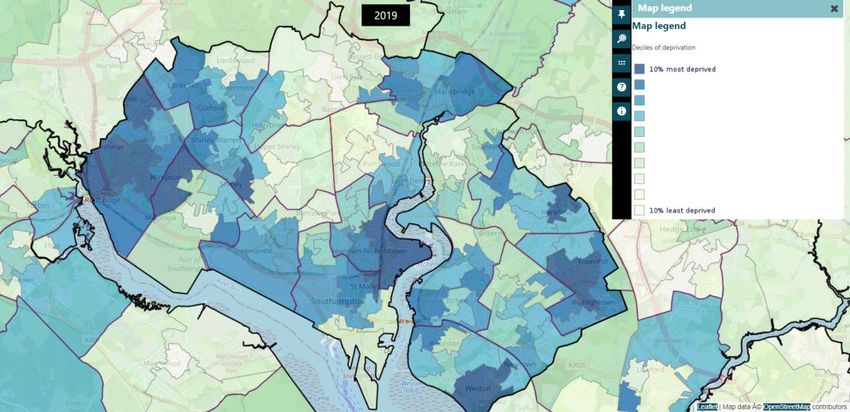
Southampton’s Future
 Between 2015 and 2036 £3bn is expected to be invested in development in
 Southampton creating 24,000 new jobs with 7,000 being created by 2026.
 This will see a potential increase in population of 30,000 more people living in
 Southampton.
 The growing population will require places to live, meaning over 19,500 new homes
 are required to be built in Southampton, and another 23,000 in the surrounding
 area.
 The Port of Southampton is planning to double its throughput by 2035 and could be
 handling 3.46m people on cruises, over 3m containers, 1.8m vehicle exports, and
 2.6m tonnes of bulk cargo.
 This growth could see an additional 74,000 people trips being made – 11% more
 than now. To keep traffic levels at the same as today almost 40,000 of the
 additional trips will need to be made by public transport – primarily bus.

Deprivation
Southampton is one of the most deprived cities in the South East – with pockets of
deprivation in it. 11% of the city’s population live in the top decile of the most deprived areas
of England. People living in these areas, which are either close to the City Centre or are
located on the edge, have lower levels of car ownership. These areas also have higher
levels of bus travel to work and reliance on buses for other journeys. Car ownership across
Southampton is lower than average, with 30% of households in the city not having access to
a car – this rises to 51% in Bevois ward close to the City Centre. These are shown in Table
1.2 and on Figures 1.6 and 1.7.
                                      Households          Method of Travel to Work
                  IMD 2020
                                     Not Owning a
                Southampton                             Walk Cycle         Bus     Car
                                          Car
           10% most deprived             42%            15%      4%        14%    54%
           10% least deprived            16%            16%      7%         5%    54%
                 Table 1.2 – Method of travel to work and car ownership, Southampton, 2011 Census

                                 Figure 1.6 – Levels of Deprivation in Southampton

                                                        6
Ward         No Cars in   1 Car or   2+ Cars
                                                                     Household      Van      or Vans
                                                        Bargate        43.6%      43.1%      13.2%
                                                        Bassett        21.6%      43.5%      34.8%
                                                        Bevois         44.5%      39.9%      15.5%
                                                        Bitterne       33.5%      43.1%      23.4%
                                                        Bitterne
                                                                       19.5%      47.4%      33.1%
                                                        Park
                                                        Coxford        24.2%      47.6%      28.2%
                                                        Freemantle     29.7%      48.8%      21.5%
                                                        Harefield      25.9%      44.2%      29.9%
                                                        Millbrook      29.3%      45.0%      25.6%
                                                        Peartree       23.5%      44.7%      31.8%
                                                        Portswood      32.0%      43.7%      24.3%
                                                        Redbridge      32.3%      44.2%      23.5%
                                                        Shirley        26.6%      45.3%      28.1%
  Figure 1.7 Households with No Car/Van Ownership
                                                        Sholing        18.8%      45.7%      35.5%
                                                        Swaythling     32.6%      43.3%      24.1%
                                                        Woolston       29.5%      45.2%      25.4%

1.2 BSIP Coverage
During the preparation of the Southampton BSIP, SCC has worked very closely with its
neighbouring LTAs particularly with Hampshire County Council.
All cross-boundary bus services go into Hampshire with 3 extending to Portsmouth or
Wiltshire. Although there are cross-boundary services between the Southampton and
Hampshire, the majority of ‘turn up and go’ high frequency bus services start and end within
the city (or extend for a short distance into Hampshire) and therefore most of the bus
mileage operated does not cross boundaries. Although SCC and HCC share common
ambitions around integration, fares and ticketing and delivering bus priority, the challenges
within Southampton have different characteristics compared to Hampshire. Levels of car
ownership are lower and bus use per head of population in Southampton are higher than in
Hampshire.
A City Region approach could be taken but to retain simplicity it has been agreed that initially
each LTA’s BSIPs will focus on the individual LTA areas with common statements and
approaches. These could evolve overtime and EP Schemes may be cross-boundary for the
cross-boundary corridors.
We have engaged with Portsmouth City Council to reflect the two inter urban services
between Southampton, Fareham, Gosport, and Portsmouth.
On this basis, the approach that has been taken is that Southampton, Hampshire, and
Portsmouth will each prepare their own BSIPs. However, in recognition of the important role
that cross-boundary bus services play in connecting residential areas to employment areas
and key services (such as hospitals), all SCC, HCC and PCC have collaborated closely in
the development of our BSIPs to ensure that our ambitions and approaches to improving bus
services are closely aligned. This joined up approach reflects how we will each work with
bus operators and other stakeholders to improve the quality, reliability and attractiveness of
bus services that operate across boundaries.

                                                    7
1.3 Why Southampton is choosing an Enhanced Partnership
The whole of Southampton administrative area will be covered by an Enhanced Partnership
(EP).
SCC has a long history of effective voluntary partnership working with bus operators in
Southampton. A voluntary Quality Bus Partnership (QBP) was developed in 2012 between
SCC, Go South Coast and First Southampton. This approach has worked well for
Southampton delivering sustained improvements for bus users and bus patronage growth
over more than a decade. SCC have delivered investment in bus priority, quality bus stop
infrastructure, including Real Time Information screens at bus stops, bus lane camera
enforcement and have utilised government funding to provide Contactless Ticket Machines
for all major operators in Hampshire. This investment has levered in private sector funding
from bus operators for new fleets of vehicles, wi-fi on buses, and next stop announcements.
The following initiatives are examples that have been delivered within Southampton, which
have helped to improve the quality and the attractiveness of local bus services and will be
built upon through the BSIP and EP:
Working with operators and HCC on the Southampton Transforming Cities Fund
(TCF) funded measures currently being delivered between Totton and Marchwood
and in Eastleigh in the City Region;
Measures by SCC and bus operators starting with Better Bus Funding, LSTF and
other funding to provide a consistent bus offer and to improve the product such as
early adoption of payment by contactless card, WiFi and ‘next stop’ displays and
announcements on all buses (available since 2013);
Through the Solent Transport partnership implementation of the first multi-modal/
multi-operator smartcard Solent Go outside of an ITA in 2012;
Investment by bus operators to provide a consistent high quality bus service (through
heavy investment in their bus fleets – reducing the average age of vehicles in
Southampton to 2½ years) and initiatives to improve the bus offer such as good
value urban zone weekly tickets targeted towards commuters;
Heavy investment by operators in ultra-low carbon Euro VI diesel buses – both new
vehicles and retrofits to existing bus fleets supported by DfT/ DEFRA Clean Bus
Technology Fund); and
Maintaining service levels on commercial and supported bus services.
For Southampton, the most appropriate route would be for the Enhanced Partnership
approach. The existing QBP and the TCF programme along with the years of partnership
working and investment by operators provides a strong foundation from which to develop the
EP. Franchising, while available to SCC or HCC via DfT approval, would not achieve many
of the objectives without significant resources from the Council. Franchising can take 3-4
years to develop and this would not meet the Government’s requirement to move swiftly to
support public transport and ensure recovery from Covid. The bus network in Southampton
has grown based on competition and has led to some sections having perceptions of over
supply while other areas of the city are under served. EPs would allow SCC to work with
HCC on cross-boundary routes reflecting the way people travel to and from Southampton as
part of the wider City Region. This would be backed up by policies within the LTP, Local
Plan and other Council documents.
1.4 Duration and Policy Alignment
The Southampton BSIP will cover the period up until 2030. It will be reviewed annually to
ensure that there is an updated delivery plan and that the ambition for buses in Southampton
remains.
The first review will be in in summer 2022, with subsequent ones happening each year to
review progress against the targets; and future delivery and funding plans and reviewing
8
progress. This will mean that the BSIP is a live document and able to be agile to reflect any
changes in local, regional, or national policy or ambition. This will be carried out jointly
between SCC, the bus operators and HCC – to incorporate TCF and cross-boundary
services and activities.
Updates to the BSIP will be agreed in consultation with the relevant Cabinet Member.
The Southampton BSIP is fully aligned with the current long-term transport strategy for
Southampton – Connected Southampton 2040 (LTP4). Over the next twenty years
Southampton will be transformed with 19,500 new homes and 24,000 new jobs being
created. To support this a well-functioning transport system is important for Southampton’s
future success. This growth and transformation provides the opportunity to plan and invest in
better and innovative transport infrastructure.
To achieve this, Connected Southampton sets out the ambition for buses as part of the wider
Southampton Mass Transit System (SMTS).
The Southampton Mass Transit System is focused on transforming the public transport
experience across Southampton and the wider area. This will bring the various modes of
public transport together to form a coherent, inclusive, and integrated system that puts
people first. Its aim will be to allow people to travel easily around and across Southampton
using a network of high-quality routes that make people’s journeys quicker, provide value for
money, better integrated and more reliable. Specifically for bus, the aims of the SMTS will
be realised by developing ‘Rapid Bus’ routes that have a reliable, fast and frequent ‘metro’
level of service that in the future could even be automated. Away from the main corridors,
routes will then spread out across the city by either bus or other demand responsive
methods. Where routes or modes intercept, interchange between them will be easy and the
system will be united through an integrated value for money ticketing service that allows
people to consume and pay for their journeys seamlessly
The BSIP will reflect the policy ambitions in Connected Southampton, and the LTP
Implementation Plans will incorporate actions from the BSIP.

                                              9
Section 2 - Current bus offer to passengers
This section provides an analysis and data of how the current bus network compares to
the BSIP aims and objectives set out in the subsequent sections.
2.1 Overview of Buses in Southampton
Bus services and usage in Southampton are well above the England average and
Southampton is seen as an area that has bucked the national trends of declining levels of
bus mileage, patronage and use per head.
Bus passengers contribute over £275m to the Southampton economy, when they reach their
destination such as the City Centre5. As well as travelling to work or school, bus users
make retail and leisure trips - spending on average £30 per retail trip and £26 per leisure
trip6. Bus is the dominant public transport mode and provide connections to the City Centre,
local District Centres, health care, education facilities and across the wider City Region.
Southampton residents and workforce made 20.7m journeys in 2019/207 on 38 bus routes in
the city. With bus passenger numbers increasing by 9% over the decade from 2009.
Southampton was the 7th highest for bus journeys made per head of population – with 80.5
in 2019/208.
In 2019/20 there were 5 million elderly and disabled concessionary passenger journeys,
accounting for 23% of all journeys, with 77% being made by fare-paying passengers –
compared to 72% for the South East as a whole. Students are a significant market for
Southampton with the UniLink services that provide access to the University of
Southampton’s campuses from areas where students live.
There are two major bus operators in Southampton – First Group and GoSouth Coast who
make up 95% of the bus market, and a smaller operator Xelabus, with a new operator
Southampton Mini Link starting in October 2021.
This section looks at Southampton’s bus network and the services provided by the
operators.
2.1.1 Bus Patronage
Figure 2.1 shows the total number of bus journeys made in Southampton over the past
decade. The level has increased by 9% since 2009/10 where 18.6m journeys were made,
by 2019/20 this was 20.3m. This is contrary to the national picture where across England
there has been a decline in number of bus journeys by 12%.

5
  Southampton LTP3
6
  PTEG Value of Urban Bus Report 2013
7
  DfT Bus Statistics BUS0109
8
  DfT Bus Statistics BUS0110

                                             10
Southampton - Bus Journeys (millions passenger/year)
25.0
21.4
20.1 20.0 20.6 20.6 20.3
20.0 18.6 18.0 18.2 18.0
17.8
Millions Passengers/Year
15.0
10.0
5.0
0.0
2009/10 2010/11 2011/12 2012/13 2013/14 2014/15 2015/16 2016/17 2017/18 2018/19 2019/20
Figure 2.1 – Total Number of Bus Journeys in Southampton 2009/10-2019/209
In 2020 the various national restrictions and lockdowns from the Covid-19 pandemic and
initial Government advice to avoid public transport saw the number of bus journeys
decreased dramatically. During the first lockdown passenger numbers were 70-80% down
on 2019 and only 10m bus journeys were made in 2020/21. By Summer 2021 patronage
was around 55% of pre-pandemic levels. As Southampton recovers from the pandemic the
BSIP and EP are part of the approach to positively rebuild patronage and use of public
transport. This will help to ensure that buses are supported long-term and that they can
provide a service to the people living, working, and visiting Southampton.
2.1.2 Bus Journeys Per Head
Southampton has a strong level of bus journeys made each year by Southampton residents,
shown in Figure 2.2. The number of bus journeys per head is the 7th highest in England, and
strong for a non-ITA or single municipal bus operator area (e.g. Reading).
9
DfT Bus Statistics BUS0109, March 2021
11Bus Journeys Per Head Comparison
180.0
160.0
140.0
Bus Journeys Per Head
120.0
100.0
80.0
60.0
40.0
20.0
0.0
2009/10 2010/11 2011/12 2012/13 2013/14 2014/15 2015/16 2016/17 2017/18 2018/19 2019/20
Nottingham Portsmouth Reading Southampton
Bournemouth Bristol, City of Plymouth
Figure 2.3 – Comparison of Southampton Bus Journeys Per Head with other LTAs10
The trend in Southampton shows that bus journeys have held up compared to 2009/10 and
not declined compared to the other cities. Southampton remains one of the few places
where the number of bus journeys made is either increasing or at a stable level.
2.1.3 Bus Punctuality
Bus Data
In the period 2005 to 2017 annual average bus punctuality in Southampton averaged
between 71% and 81% for buses turning up on time (Figure 2.3). On time is calculated as 1
minute early and 5 minutes later than the scheduled time at a bus stop. Compared to other
cities (Figure 2.5) Southampton performs slightly worse with a lower average punctuality.
Within Southampton, average bus speeds in the city are around 9.2mph, with some buses
averaging as little as 8mph at peak times. This has not changed recently, and this affects
the punctuality of services.
Bus services are mixing with general traffic on the main corridors into the City Centre and
this adds to the congestion. It can particularly affect cross-city bus services, with one cross-
city service between eastern and western Southampton needing to add 9 minutes to its
timetable since 2011 due to congestion on roads, bridges and in the City Centre. In the AM
peak, by the time a bus has terminated in the City Centre it can have deviated from its
scheduled running time by up to 8¾ minutes.
10
DfT Bus Statistics BUS0110, March 2021
12Figure 2.4 Bus Punctuality Comparison
Looking at individual services and types of service for 2020/21, bus services had an average
punctuality of 89.05%. The lowest performing service is an inter urban that has a small
proportion of its journey within Southampton. High frequency services perform well with a
small differential between the best and worst punctual. The level of punctuality for cross city
services varies considerably as these are most affected by the bridges and travelling through
the City Centre. Delays in one part of the city has a consequence for reliability on the whole
route.
Service Average High Low
High Frequency (6+bph) 89.44 90.87 87.71
Inter Urban 88.74 92.16 77.5
Cross City 88.72 90.8 80.13
All 89.05 99.0 77.5
Table 2.1 Average Percentage Bus Punctuality 2020-21 (further data awaited)
Some bus corridors see a large differential between peak and off-peak services, one service
can see a 30-minute differential on a heavily congested 1.3km section of route. The
example in Figure 2.6 shows Shirley Road and the percentage difference in average vehicle
speed between day and night-time. The section from A35 to Central Station sees daytime
speeds at least 40-60% of the night-time, the section through Shirley District Centre sees
speeds only making 20% of their night-time equivalent.
13Figure 2.5 Example of Impact of Traffic Conditions on Speeds and Buses – Shirley Road
2.1.4 Passenger Views
The views of passengers and non-users are important to understand the user experience
and what they consider to be the most important issues for them. Both the main operators
participate in the bi-annual Transport Focus Bus Passenger Survey. To inform this BSIP
and the Enhanced Partnership process SCC ran an online public perception survey on
buses and what people wanted for buses in Southampton specifically. Summary of these
results in in Table 2.2.
England Bluestar First
Overall 89% 89% 89%
Journey Times 85% 89% 85%
Punctuality 74% 80% 78%
Value for 66% 72% 54%
Money
Customer 76% 83% 80%
Service
Cleanliness 79% 89% 87%
Space 87% 89% 89%
Table 2.2 – Summary of Passenger/Public Satisfaction11
The results of these surveys show that satisfaction with punctuality and the value for money
nature of bus travel is low. While Southampton is above the England average this indicates
that there is still requirement to improve the levels of satisfaction.
Areas that the BSIP will need to consider are journey times, punctuality, and the value for
money of travelling by bus.
11
Transport Focus 2019 Bus Passenger Survey – England, Bluestar and First South Coast (includes Portsmouth)
14Southampton Bus Survey 2021
SCC carried out an online BSIP engagement survey received over 2,200 responses – 88%
of whom were residents in the city. 10% stating they visited the city for work/leisure. 58% of
respondents identified as female, with 40% identifying as male. The survey acted as a useful
first step in detailing to current and potential future passengers the BSIP and EP process
and the desire to understand their views on how to improve bus services in the city.
It was also useful in gaining understanding of changing travel patterns since the start of the
Covid-19 pandemic, 20% of survey respondents stated they were likely to use the bus for
fewer journeys than before the pandemic. Conversely, 13% of respondents said they were
likely to use the bus for more journeys, with 55% stating their bus travel would remain the
same as pre-pandemic.
The survey explored why some respondents chose to use the car over using the bus for
certain journeys. The most common reasons given were that it was significantly quicker to
use the car than the bus (38%) and buses not going to the places they wanted to travel to
(37%).
Crucially, the survey focussed on what improvements to bus services would encourage
people to use buses for more journeys in the city. 72% of respondents stated they would
consider using buses more if journey times on local bus services were made quicker, and
78% would use the bus more if bus routes served the areas of the city where they currently
don’t. There were several other performance points of note. A proportion of respondents
answered they would use buses “A great deal” more by a particularly large margin in the
following points:
Multi-operator tickets and fare capping across operators,
Bus routes that serve areas of the city that they don't do currently,
Lower fares,
Simplified fares, and
Safer waiting environment at bus stops.
There was also a degree of ambivalence to the point referring to availability of Wi-Fi on
buses. Respondents did not feel particularly strongly about this point –answering ‘to some
extent’ and felt that these changes would not encourage them to use the bus very much.
This is likely to reflect the growing availability and reliability of 4G / 5G coverage which users
are likely to favour over connecting to a Wi-Fi provider.
A full breakdown of the survey results can be found in Appendix 4. As SCC continue to
develop the EP with the bus operators, we will further engage with respondents to the survey
and the wider public to meet the BSIP requirement to give bus passengers more of a voice
in how services operate.
SCC are committed to working closely with the city’s bus operators to develop a Bus
Passenger Charter. The charter will outline bus users’ rights to certain standards of service,
including punctuality, vehicle cleanliness, proportion of services operated, information and
redress. The charter will be published on the SCC website and will provide links to existing
bus operator conditions of service and complaints procedures for passengers.
2.2 Southampton’s Bus Market Profile
This section will go through how the bus market operates in Southampton, detailing the
current bus network, how the bus operators work in Southampton, the state of the highway
infrastructure – bus lanes and bus stops, fares and ticketing, interchange and an analysis of
how what this means for passengers and how it meets the BSIP objectives.
152.2.1 Southampton’s Bus Network
The current bus network in Southampton covers local intra-urban routes linking suburbs with
District Centres then to the City Centre, and inter-urban routes that link the City Centre to
surrounding towns and villages in Hampshire. This is shown in Figure 2.6.
The network is operated by two main bus operators – Go South Coast (GSC) and First
Southampton. They operate 95% of all bus services in Southampton.
GSC operate as Bluestar with 14 bus services operating inter and intra urban routes,
and Salisbury Reds on 1 inter urban service.
GSC are work in partnership with the University of Southampton to run the 4 UniLink
services connecting the University to link to halls of residence, campuses, hospital
and airport,
GSC also partner with Red Funnel to operate the QuayConnect service between
Southampton Central Station and Town Quay for the Isle of Wight ferry,
First operate as CityReds 8 services operating inter and intra urban routes on and 2
Solent inter urban services.
There is a smaller operator Xelabus who runs 8 services which are either contracted or
supported services. A new smaller operator, Southampton Minilink, has registered to start
running a local service to Harefield and inter-urban to Ringwood in October 2021.
Figure 2.6 Southampton Bus Network (2019) SCC
Southampton’s network is based on a hub and spoke network centred on the City Centre.
There are 38 bus services in Southampton, covering 3.5m km per year – over 4 times to the
Moon and back. 71% terminate in the City Centre. This has created a largely radial pattern
with high volumes of buses on those corridors and very little linkage between them. This
does mean people are funnelled into the City Centre to either continue their journey on the
same service, change to another, or interchange with rail or ferry.
16Bus Network
A commercial network with 2 main operators supported by smaller operators
A hub & spoke network with a radial pattern with high volumes of buses on the
corridors
Very little connection between those corridors meaning people must travel into City
Centre and out, or interchange with other service or mode
2.2.2 Bus Services
Table 2.3 sets out the individual bus services in Southampton, destinations service and their
frequency.
Service Route Frequency (bph) Operator
Mon-Sat Evening Sunday
Quay Central Station-Town Quay Bluestar
2 2 2
Connect
1 Southampton-Totton 4 2 2 City Red
1 Southampton-Winchester 4 1 2 Bluestar
2 Southampton-Eastleigh 4 1 2 Bluestar
2 City Centre-Millbrook 7/8 3 4 City Red
3 Southampton-Hedge End- Bluestar
1 Limited 6/day
Eastleigh
3 Thornhill-City Centre-Shirley- City Red
7 2 4
Lordshill
4 Southampton-Romsey 2 90mins 1 Bluestar
6 Southampton-Hamble 2 1 1 City Red
6 Southampton-Lymington 1 - 2hrly Bluestar
7 City Centre-Townhill Park 6 3 4 City Red
7 Woolston-City Centre-Shirley- Bluestar
2 - 1
Lordshill
8 Southampton-Hythe & Calshot 1 Limited 4/day Bluestar
8 Southampton-Hedge End 2 1 1 City Red
9 Southampton-Hythe & Fawley 3 1 2 Bluestar
9 City Centre-Sholing 2 2 7/day City Red
11 Southampton-West Totton 3 - 1 Bluestar
11 City Centre-Woolston-Weston 6 1 4 City Red
12 Southampton-Calmore 3 1 1 Bluestar
13 City Centre-Harefield 2 1 1 City Red
16 City Centre-Townhill Park 4 1 2 Bluestar
17 Weston-City Centre-Adanac Park 6 2 4 Bluestar
18 Thornhill Park-City Centre- Bluestar
7/8 2 4
Millbrook
Hoppa 1 Bitterne-Midanbury 3/day (M, Xelabus
- -
W, F)
Hoppa 2 Bitterne-Sholing 3/day (M, Xelabus
- -
W, F)
Hoppa 3 Bitterne-Harefield 2/day (M, Xelabus
- -
W, F)
U1 City Centre/NOC-University-Airport 7/8 3 4 UniLink
U2 City Centre-University 6 3 3 UniLink
U6 City Centre-University-UHS 3 1 1 UniLink
U9 Townhill Park-University-UHS 2/day - - UniLink
X4 Eastleigh-Mansbridge-Hedge End 1 - - Xelabus
X4/X5 Southampton-Fareham- Solent
4 1 1
Portsmouth/Gosport
X7 Southampton-Salisbury Salisbury
1 - -
Red
17X10 Southampton-Bishop Waltham 1 - - Xelabus
X11 City Centre-Shirley-Lordshill 1 - - Xelabus
X12 City Centre-Shirley 6/7 per Xelabus
- -
day
X21 City Centre-Southampton Science Xelabus
3/day - -
Park
Table 2.3 – Bus Services in Southampton
Most parts of Southampton benefit from frequent services to and from the city centre but
there are also good services to places like the University Hospital Southampton, the
universities, District Centres, and surrounding towns and villages in Hampshire. The District
Centres of Shirley, Portswood, Woolston and Bitterne act as nodes for the bus network, with
both local city routes and inter-urban routes serving these centres before branching off to
serve suburbs or into the wider City Region. This means that these centres are well served
and support local people in accessing the goods and services there, maintaining them as
thriving local hubs.
Frequencies change in the evening with most services decreasing their frequency from
1900. Some inter urban services stop operating from 1900 with most services stopping
around 2300. After midnight only 3 services operate before ceasing around 0100.
Weekday frequencies are maintained on a Saturday; however Sunday operating has a
reduced level of service with some services not operating at all. Those not operating are the
supported services or the longer distance inter urban. Frequencies are reduced with 52
buses per hour in the City Centre compared to at least 100 during a weekday.
The geography of Southampton means that there are a limited number of radial corridors for
traffic and bus services to use, and it doesn’t support reliable cross-city services as routes
between east and west are funnelled across the River Itchen and no routes to the south.
There are only three suitable bridges (Itchen, Northam and Cobden) that buses can use.
This results in only 4 cross-city bus services connecting Millbrook and Shirley with Bitterne
and Woolston-Weston respectively. Combined with traffic using these crossings, congestion
and its knock-on effect on bus reliability, there are no other cross-city bus services beyond
these. For example, with no direct connections between Bitterne and the Hospital or
Woolston and the University a change needs to be made in the City Centre.
This radial nature of the bus network means that closer to the City Centre multiple services
combine on certain road corridors creating very high frequency sections of bus network.
These are generally from District Centres, such as Shirley, Portswood, Woolston and
Bitterne, to the City Centre. This enables a turn up and go service along main corridors
while serving the main housing areas.
However, there are areas of Southampton that do not have such a good bus service, for
example Harefield, north of Lordshill, Freemantle, and Upper Shirley. These have hourly or
less frequencies.
The UniLink network is slightly different and is focused on the University of Southampton’s
main Highfield campus with all services calling there. This reflects its primary role as a
service for students and staff of the University, but services are open to all users.
Figure 2.7 shows that frequent services connect Southampton to Chandlers Ford, Eastleigh
and Fair Oak. Areas such as Totton & Waterside, Hedge End and Romsey have lower levels
of frequency. The bus network also serves further afield to Winchester, Fareham, Gosport,
Salisbury and Portsmouth.
18Figure 2.7 - Frequency and accessibility of bus services across Southampton – thicker the line the more frequent
Low frequency = 1/bus hr, high = 30+/bus hr
There are specifically branded services associated with specific routes or destinations.
Quayconnect is a City Centre shuttle service between Southampton Central Station and
Town Quay for the Isle of Wight RedJet passenger ferry from Cowes. This is timed to
connect the half-hourly RedJet with the London Waterloo bound train and is contracted to
GSC by Red Funnel.
Figure 2.8 shows the distribution of bus frequencies on the network in Southampton. The
busiest road (outside of the city centre itself) is A3057 Shirley Road, which carries 72 buses
per hour in the peak (two directions) between Romsey Road and Waterloo Road –
accounting for 6.4% of all vehicles the road; one bus every 15 vehicles. South of Waterloo
Road to Southampton Central Station this rises to 94 buses (both directions) with the
addition of the services from Totton and the Waterside. Other notable roads for buses are
the A3025 Itchen Toll Bridge (68 buses), A33 The Avenue (46 buses), Portswood Road-St
Denys (44 buses), A3024 Northam Road (36 buses), and A33 Millbrook Road West (22
buses).
It also highlights the areas of Southampton with the lower levels of service between the
corridors. For example, Harefield in eastern Southampton, where some parts are in top
decile of most deprived areas in England, is served by 2 buses per hour that runs on a one-
way loop. This means that those at the start of the loop have a longer journey to get to
Bitterne and then the City Centre. There is also a considerable distance (1+ mile) to the
higher frequency corridors or Bitterne District Centre.
19Figure 2.8: Bus service frequency by road link- thickness denotes service frequency (Sept 2018)
2.2.3 Bus Operators
This section summarises the operations of each bus operator covering services,
destinations, and fleet. It sets out the market share for each operator based on annual
patronage and bus services operated.
Go South Coast – Bluestar
Go South Coast (GSC) are the largest operator in Southampton running 40% of the 38 bus
services and carrying 70% of the annual patronage. As set out in Section 2.2.2 they operate
the Bluestar, UniLink, QuayConnect and Salisbury Red services.
They operate a network of services serving the suburbs of Southampton and beyond to
several towns and urban areas outside of the city. This is shown in Figure 2.9.
Bluestar – 14 intra and inter urbans services to Millbrook, Lordshill, Shirley,
Portswood, Townhill Park, Bitterne, Thornhill Park, Weston and Woolston; and to
Totton, the Waterside (Marchwood, Hythe, Fawley), Lymington, Chandlers Ford,
Winchester, Romsey, Eastleigh and Hedge End
UniLink – 4 services to University of Southampton, University halls of residence,
Southampton Airport, National Oceanography Centre, Portswood, Swaythling, and
University Hospital Southampton – these are all open to students (via their halls fees)
and the general public;
QuayConnect – 1 service between Southampton Central Station and Town Quay for
the Isle of Wight RedJet service; and
Salisbury Red – 1 service to Salisbury.
20Figure 2.9 – GoSouth Coast Network Map – Southampton and wider area
GoSouth Coast operate 160+ buses in a combination of single and double deck. Depots are
in Totton and Eastleigh.
Total Bus Total Double Single Euro VI Euro VI WiFI USB Next
Deck Deck Retro Stop
Bluestar 131 89 42 49 66 106 109 108
UniLink 32 32 0 0 32 32 32 32
Table 2.4 – Bus Fleet - GSC
CityRed (First Group)
CityRed, part of First Group, are the second largest operator in Southampton running 26% of
the 38 bus services and carrying 28% of the annual patronage. As set out in Section 2.2.2
they operate the CityRed and Solent services.
They operate a network of services serving the suburbs of Southampton and beyond to
some towns and urban areas outside of the city. See network map in Figure 2.10.
CityRed – 8 intra and inter urbans services to Millbrook, Lordshill, Shirley, Portswood,
Townhill Park, Bitterne, Harefield, Thornhill Park, Sholing, Weston and Woolston; and
to Totton, Hedge End, Netley and Hamble; and
21 Solent – 2 inter urban services to Fareham, Gosport and Portsmouth.
Figure 2.10 CityRed & First Network Map Southampton
They operate 60 buses mostly single decker from a purpose built depot in Portswood area of
Southampton.
Total Bus Double Single Euro VI Euro VI WiFI USB Next
Deck Deck Retro Stop
First - 60 63
Table 2.5 – Bus Fleet - First
Xelabus
Xelabus are the smallest operator in Southampton running 21% of the bus services but carry
less than 1% of the annual patronage. The majority of Xelabus services are either
contracted to a third party such as Southampton Science Park or supported by SCC as
socially necessary service.
They operate a network of 8 services serving some suburbs of Southampton and beyond
into Eastleigh. Four are contracted from SCC to provide local services to Shirley and
Bitterne District Centres on specific days. One is an inter urban service to Bishops Waltham
and is partially commercial.
Xelabus are also contracted to provide school and college buses to higher education
establishments in and around Southampton, such as Itchen College in Sholing and Barton
Pevril in Eastleigh.
They operate mostly single decker from a depot in Eastleigh.
2.2.3 Bus Infrastructure
Southampton has a variety of bus infrastructure to support people accessing the bus,
providing information and providing buses with priority.
Bus lanes or bus only roads, and priority at signals;
Bus stops with raised kerbs, flags, information and shelters;
Real Time Information; and
On Board information.
In Southampton there is currently 2.53 miles of dedicated bus priority lanes either along
main corridors into/out of the City Centre or providing bypasses to congested junctions. The
bus lanes operate 24 hours 7 days and permit access for cycles, Southampton registered
taxis and other authorised vehicles. There are 11 bus or restricted sections of road (some
22shared with cycles, taxis and permit holders), mainly situated around the retail and cultural
core of the City Centre.
There are 20 traffic signal junctions with bus priority operational in them, these are on the
Shirley Road and Bursledon-Bitterne Road corridors. The priority system uses Automatic
Vehicle Location (AVL) – vehicle locators on board the buses that interact with the main
Urban Traffic Control (UTC) system. A further 12 junctions have bus priority installed but not
yet commissioned.
There are 961 bus stops in Southampton with provision at the bus stop varying from a
simple flag and pole to shelters with real-time information, raised kerbs, seating and lighting.
43% (410) of bus stops have shelters and SCC has an ongoing programme of renewing and
upgrading stops to new high quality, high spec shelters that include information panels.
Shelters are provided through a contract with ClearChannel.
Real time bus information provides live bus travel information at 229 bus stops – these are
3-line displays. In 2020 an initial trial of 6 new ‘TFT’ displays were introduced, with further
phases to upgrade all RTI screens.
Eight key interchange points have information totems (in the City Centre, Southampton
Central Station and at the University’s Highfield campus). Additionally, real time departure
displays are in major buildings/employment hubs such as the Civic Centre, University
Hospital and Town Quay. Bus operators provide data in an electronic format that can be
automatically uploaded to the system and feed GPS locations of buses to the system
through their on-bus ticket machines.
2.2.4 Fare & Ticketing Structures
The price point for a bus journey is a contributing factor in people’s decision making around
how they will travel.
Fares in Southampton are competitive when compared to other cities, as shown in Table
2.5, and Southampton has some of the cheapest day and weekly fares in the UK. The
history of competition and innovation between the main operators, along with an overarching
multi-modal ticket offer has resulted in cheaper fares and supported patronage growth.
Fares are done on a zonal system and are broadly similar between operators and SolentGo
but there can be significant price differences between Southampton zones and zones in
Hampshire. The network zones for Bluestar, City Red and SolentGo are shown in Figures
2.11, 2.12 and 2.13.
23Zone Description Fare Single Return Daily Weekly Group*
Bluestar & UniLink
Routes wholly £2.00- £3.00-
Adult £3.40 £9.00 £7.70
Southampton within 2.50 3.70
City Southampton £1.30- £1.80-
Child £2.80 £10.00 -
boundary 1.50 2.00
Bounded by £14.50-
Adult £3.70 £15.50
Southampton M271 & M27 15.50
Zone but includes
Child -
Airport
Zone plus
£17.50-
Totton, Adult £6.00 -
19.50
Southampton Hedge End,
Plus Eastleigh &
Chandlers Child £2.00 £2.80 £4.60 £14.00 -
Ford
Whole
network Adult £8.00 £26.00 £24.50
including
Network Winchester,
Romsey,
Waterside & Child £2.00 £3.40 £6.00 £16.50 -
Lymington
First
Roughly
Adult £2.00 £3.00 £3.50 £9.00 £8.00
bounded by
Southampton
administrative
Child £2.00 £2.00 £3.20 -
boundary
Southampton £15.00-
Southampton Adult £5.50
plus Totton 18.00
& Totton
only Child N/A N/A N/A N/A
Southampton £19.00-
Adult
including 20.00
Southampton West End,
Plus Netley,
Child
Hamble &
Hedge End
Across £7.00- £23.50- £13.00-
Adult
Hampshire 7.50 25.00 45.00
Hampshire (inc Fareham,
Gosport & Child
Portsmouth)
Xelabus
Southampton Adult £8.00 £25.00
Network
& Eastleigh Child £5.00 £17.00
Solent Go Multi-Operator Multi-Modal
Southampton
Southampton
and bounded Adult £5.00 £20.00
Zone
by M27-M271
Solent Zone Solent area Adult £8.00 £30.00
Table 2.6 – Comparison of fare zones and adult, child and group ticket offers, 2021
24Figure 2.11 CityRed & First Network & Fare Zones
Figure 2.12 Go South Coast Network & Fare Zones
Each operator offers several other alternative fare options for number of trips, days, single,
return, wider network tickets. All operators offer adult and child fares.
25All operators offer child fares at 60-65% of the adult fare. These are available for those aged
5-15. At 16 the fare increases to the full adult fare. This can be a significant increase for
those either still in education or not in employment.
For those travelling to college there are some products available that provide discounted
college bus travel on public buses. Bluestar, UniLink and Xelabus provide offers ticket
options for academic terms and years. These operate aged 16-19 and cover travel to further
education colleges.
As part of their university halls fees, first year students at the University of Southampton get
travel on all UniLink services included. All University students and staff get reduced price
bus travel via the app.
Group travel is offered for up to 5 people travelling together at the same time and to the
same place. This can provide good value for families and friends but is not a well-known
ticket option.
All buses offer contactless payments via card and mobile(m)-ticket. M-tickets have
increased in usage and are available via the individual operators’ apps and websites. There
is a variety of products on sale – direct debit, daily, weekly and monthly. These are at a
discount to the turn up fares. Both major operators in 2020/21 started to offer ‘’Tap & Cap’
or ‘Tap On, Tap Off’ (TOTO) fares. These are capped at the day rate for the ticket and
permit multiple journeys on and off an operator’s buses. These tickets are not yet available
cross-operator. Through TCF all Southampton buses will be equipped with readers that will
enable full TOTO.
There is a perception that fares are high, this is often from people who don’t use the bus. A
SCC Survey indicated that 35% of respondents, both bus and non-bus users, were satisfied
and very satisfied with the cost of travelling by bus, and 33% were dissatisfied and very
dissatisfied. Among bus users there is high levels of satisfaction with the value for money of
buses – Bluestar at 72%12. 41% of those satisfied with the value for money feel that the cost
of the bus against other modes of transport is good.
Comparable fares are among the cheapest in the UK. The weekly ticket offer is second
cheapest on offer– Guildford was lowest at £7, and the daily tickets are on average 49%
lower than the South East and 35% lower than the England averages.
Cost of Bus V Car
A comparison of daily parking, daily and weekly bus fares shows that Southampton does
provides the cheapest parking, daily and weekly bus fares in the South East. Parking in
most cities tends to be more expensive than the day rate for bus travel, however if there are
multiple people travelling by bus the total cost can exceed the day parking rate.
Area Daily Weekly Parking
Mobile/
On Bus Mobile On Bus Daily
TOTO
Southampton £3.00 £3.40- £9.00- £9.00- £5-8
3.50 £12.50 £12.50
Portsmouth £4.50 £17.00 £18.00 £10-12
Solent Go £5.00 N/A £20.00 N/A N/A
Brighton & Hove £4.70 £5.20 £21.60 N/A £23
Reading £4.00 £4.00 £16.00 £17.00 £10-14
Bristol £4.50 £5.00 £18.90 £20.00 £13.50
Plymouth £4.70 £4.70 £21.00 £21.00 £5-12
12
Transport Focus National Bus Survey 2019
26Bournemouth £4.10- £4.30- £19.50- £19.50- £5-20
4.40 4.60 20.00 20.00
Nottingham £4.20 £4.20 £18.00 £18.00 £16
South East13 £5.23 £18.74 £18.74
Table 2.7 – Comparison of daily and weekly fares14
Multi-Operator Ticket
In 2013 Solent Go was launched as the first multi-modal multi-operator smartcard ticket offer
outside of an Integrated Transport Authority (ITA). It succeeded the Solent Travelcard which
was a paper based multi-travel card and the first scheme launched outside of an ITA through
a partnership between the bus operators and LTAs.
SolentGo covers the mainland part of the Solent region of Southampton, Portsmouth and
Hampshire. It is available as a smartcard and a m-ticket via the SolentGo app and bus
operator’s apps. It offers a daily or weekly pass on bus and ferry (e.g. Gosport Ferry) but is
priced at a premium compared to the daily or weekly offer on individual bus operators (see
Table 2.6 and 2.7). There is currently no interoperability with the rail network – as part of
the 2018 South Western Rail Franchise it was intended that Solent Go was integrated and
has not been so yet. This has contributed to it having a much reduced or limited take up on
bus – there is a higher take up on the Gosport Ferry.
There is no child fare available on SolentGo.
Figure 2.13 shows how sales of all SolentGo products have been increasing in each year
with sales in 2019/20, until early 2020, above that of previous years. It should be noted that
as a proportion of the total sales for bus and ferry travel this is a small percentage.
1400
SolentGo Sales 2017/18-2020/21
1200
1000
Number of Sales
800
600
400
200
0
P1 P2 P3 P4 P5 P6 P7 P8 P9 P10 P11 P12 P13
17/18 18/19 19/20 20/21
Figure 2.13 – Sales of SolentGo products 2017/18-2020/21
As part of the Solent Future Transport Zone there will be enhancements to SolentGo,
integrating it with the emerging Mobility as a Service (MaaS) platform starting in 2022.
13
TAS Partnership 2019 National Fares Survey - 30281-REP-TAS-National-Fares-Survey-2019.pdf (taspartnership.co.uk)
14
Source – operator websites and local authority websites for parking – 2021 prices
272.2.5 Interchange
The bus network is centred on the City Centre but there is no one single point such as a bus
station for interchange between bus services. The routing of the bus network is also
complex as buses arrived from different corridors and each individual bus service follows a
slightly different routing around the City Centre. This has a knock on effect on bus reliability
and crowding in certain areas of the City centre. Buses are also affected by vehicles
accessing car parks, service areas, loading and concentrations of people acceding the bus
at busy stops.
The network has developed from a historic pattern developed as the City Centre was
developed in the post-war period and in response to more recent retail developments. The
disjointed approach to the City Centre routing leads to additional mileage for bus operations
and confusion for attracting new bus users who won’t be familiar with the network.
Services call at a series of bus stops located in clusters and are numbered:
HA-HG (6 stops) – Commercial Road and Above Bar Street
(north)
AA-AN (14 stops) – Portland Terrace (north), Civic Centre
Road, Above Bar Street (south), New Road & Havelock Road
BD-BS (11 stops) – Portland Terrace (south), Castle Way,
Bargate and High Street
CA-CU (18 stops) – Vincent’s Walk, Pound Tree Road,
Hanover Buildings and Queensway
TA-TH (8 stops) – High Street (south), Briton Road and Docks
Figure 2.14 Location of City Centre Bus Stops
The busiest being Above Bar Street (south), Vincent’s Walk, Portland Terrace (south),
Portland Terrace (north) and Civic Centre Road. Many of the stops are used for picking up
and set down but stops in areas BD-BS and CA-CU are the key locations for terminating and
layover of buses – these locations are primarily divided between Bluestar and First services.
27 services terminating in the City Centre where there can be up to 78 buses per hour
terminating, with an additional 23 crossing the City Centre.
Interchange is done informally at the main bus hubs on Vincent’s Walk, Portland Terrace
and around the Civic Centre.
Southampton Central Station is the other main interchange location, only the QuayConnect
service terminates there. Buses from Totton & Waterside, Shirley-Romsey and the
University & Airport call at the station. Bus stops are split between the north and southern
side of the station. The stops on the north side were upgraded with additional capacity in
2015 as part of the interchange and public realm works at Station Quarter North. These
cater for most services at the station. The south side has 3 stops and is proposed to be
upgraded as part of the TCF Programme by 2023.
The University’s main Highfield Campus is the hub for the UniLink services and has
interchange with National Express coach services.
282.3 LTA Financial Support
2.3.1 Supported Services
Of the bus services in Southampton pre-pandemic 90% are operated at a commercial level.
The level of funding from SCC to supported services has reduced by 96% since 2009.
The impact of Covid has seen a reduction in the number of bus miles done with services
reducing frequency or hours of operation. As of Summer 2021 buses in Southampton were
operating at 90% of their pre-pandemic levels of mileage.
SCC currently financially supports four services wholly and these are operated by Xelabus.
These services provide socially necessary services connecting people in areas often not
served by commercial services with local shopping and health care centres on certain days
of the week. The supported services are in Table 2.8.
Weekly Annual
Journeys Annual %age
Service Route Mileage Mileage
Made Subsidy subsidised
(km) (km)
X12 City Centre- 4 100% 69.12 3594.2
Fremantle- Journeys/Day
Shirley Tuesday &
Thursday
Bitterne Midanbury- 3 100% 40.5 2106.0
Hoppa 1 Bitterne Journeys/Day
(Mon, Wed &
Fri) £23,000
Bitterne Sholing- 3 100% 73.4 3818.8
Hoppa 2 Bitterne Journeys/Day
(Mon, Wed &
Fri)
Bitterne Thornhill- 1 Journey/Day 100% 43.59 2266.6
Hoppa 3 Bitterne (Mon, Wed &
Fri)
Table 2.8 – Southampton Supported Services
2.3.2 Concessionary Fares and Travel
In 2019/20, there were 5m elderly and disabled concessionary passenger journeys made in
Southampton. This accounted for 24% of all journeys. The remaining three-quarters of
journeys were made by fare paying passengers, this is compared to 72% for the South East
as a whole. Whilst the overall patronage has grown in recent years, the number of elderly
and disabled concessionary passenger journeys has decreased by 1.6% since 2011/12.
Almost 30,000 older and disabled people passes were issued in Southampton in 2019/20,
with older passes accounting for 88% of all passes issued. The proportion of eligible people
taking up the pass in Southampton is lower than the South East average at 71%.
As Figure 2.14 shows, the proportion of concessionary fare travel out of overall bus journeys
in Southampton is lower than Hampshire and comparable places. This reflects the different
nature of the areas.
The Concessionary Fare scheme starts at 0900 to 0030 for Southampton residents and
0930 to 2300 for those non-Southampton residents. This is a local enhancement to the
national scheme. The annual budget for Concessionary Fares is approximately £3.8m.
29You can also read