Natural beauty and wellness for the world - FY21 Results Presentation
←
→
Page content transcription
If your browser does not render page correctly, please read the page content below
Natural beauty and wellness for the world

FY21 Results Presentation

FY21 Results Presentation

Dave Fenlon                          Efee Peell              Rory Gration
Group CEO                            Group CFO               Group COO
& Managing Director
Favourite product:                   Favourite product:      Favourite product:
Sukin’s for Men Facial Moisturiser   Andalou Glycolic Mask   Sukin’s Rosehip Oil

Friday 27 August 2021

                                                                                   1
Disclaimer
This presentation has been prepared by BWX Limited ACN 163 488 631 (BWX). The information contained in this presentation is for information purposes only and has been prepared
for use in conjunction with a verbal presentation and should be read in that context.

The information contained in this presentation is not investment or financial product advice and is not intended to be used as the basis for making an investment decision. Please note
that, in providing this presentation, BWX has not considered the objectives, financial position or needs of any particular recipient. BWX strongly suggests that investors consult a
financial advisor prior to making an investment decision. This presentation is strictly confidential and is intended for the exclusive benefit of the institution to which it is presented. It
may not be reproduced, disseminated, quoted or referred to, in whole or in part, without the express consent of BWX. No representation or warranty, express or implied, is made as
to the fairness, accuracy, completeness or correctness of the information, opinions and conclusions contained in this presentation. To the maximum extent permitted by law, none of
BWX, its related bodies corporate, shareholders or respective directors, officers, employees, agents or advisors, nor any other person accepts any liability, including, without
limitation, any liability arising out of fault or negligence for any loss arising from the use of information contained in this presentation.

This presentation may include “forward looking statements”. Forward looking statements can generally be identified by the use of the words “anticipate”, “believe”, “expect”,
“project”, “forecast”, “estimate”, “likely”, “intend”, “should”, “could”, “may”, “target”, “plan” “guidance” and other similar expressions. Indications of, and guidance on, future earning
or dividends and financial position and performance are also forward looking statements. These forward looking statements are not guarantees of future performance and involve
known and unknown risks, uncertainties and other factors, many of which are beyond the control of BWX and its officers, employees, agents or associates, that may cause actual
results to differ materially from those expressed or implied in those statements. Actual results, performance or achievements may vary materially from any projections and forward
looking statements and the assumptions on which those statements are based. Readers are cautioned not to place undue reliance on forward looking statements and BWX assumes no
obligation to update that information.

This presentation is not, and does not constitute, an offer to sell or the solicitation, invitation or recommendation to purchase any securities and neither this presentation nor anything
contained in it forms the basis of any contract or commitment.

                                                                                                                                                                                                 2
Executive Summary
BWX ENTERS STRATEGIC PARTNERSHIP WITH GO-TO SKINCARE
BWX today enters agreement to acquire 50.1% of leading Australian brand Go-To Skincare; transaction rationale
announced separately along with details of a capital raising for ~$100.0m to fund BWX’s investment in the Partnership

 FY21 FINANCIAL PERFORMANCE
 Statutory NPAT increased 60.9% to $23.7m
 Underlying EBITDA increased 11.5% to $34.5m(1)
 Revenue increased to $194.1m on a reported basis (FY20: $187.7m). Adjusted for constant currency and equity-linked strategic
 partnership with Chemist Warehouse(2), increased by 8.6% to $203.9m.

 •    Gross profit margin improved 134bps to 59.3% (2)
 •    Cash position improved to $70.5m and cash conversion of 74.1%
 •    Debt position reduced to $52.4m
 •    Earnings per share of 17.1c
 •    Fully franked final dividend of 3.1 cents(3)

 Despite COVID-19 driven retail lockdowns, BWX has delivered growth in sales, gross margin and profit, with increased market share across
 all key categories
(1) EBITDA is a non-IFRS measure that excludes a net $5.9m benefit comprising of $6.9m of Acquisition Related Benefits, $0.2m Share-Based payment relating to the equity-linked strategic partnership with Chemist Warehouse and $0.8m
impact of IFRIC agenda decision on configuration and customisation costs in cloud computing arrangements
(2) Constant currency excludes FX impact from USD. This is a non-IFRS measure and excludes $0.2m Share-Based payment expense relating to the equity-linked strategic partnership with Chemist Warehouse
(3) On 27 August 2021, BWX declared its intention to raise approximately $100.0m from an Institutional Placement and Share Purchase Plan. Assuming that these shares are issued prior to the record date, and on the assumption that the full
amount is raised, BWX anticipates that it would pay a fully-franked final dividend of 3.1 cents per share
                                                                                                                                                                                                                                                3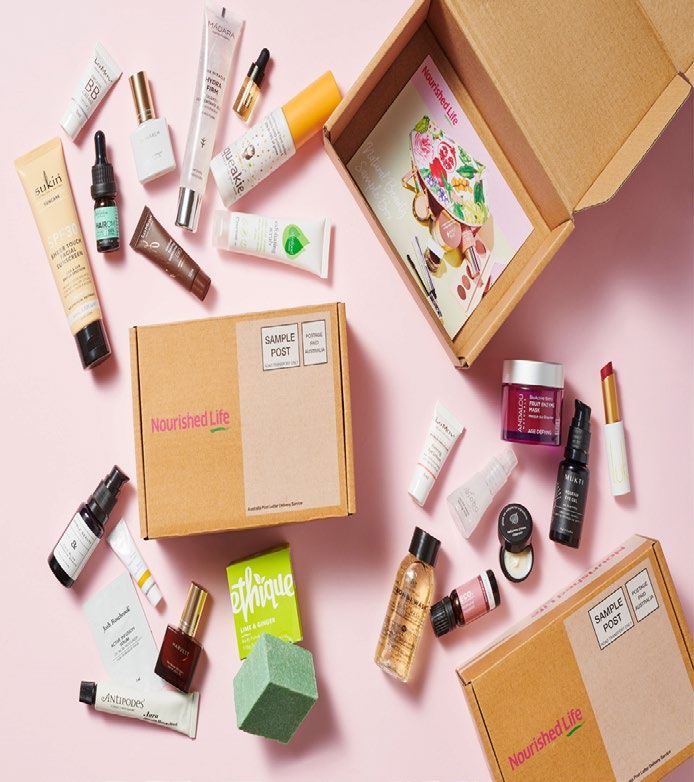
Segment Performance
      ($A millions)                                                                               FY20                                                 FY21(2)   FY21 CC(2)   % CC Growth
      Australia + International                                                                 $105.6                                                 $118.4      $118.8           12.2%
      USA                                                                                        $82.1                                                  $75.9       $85.1            3.7%
      Total Revenue                                                                             $187.7                                                 $194.3      $203.9            8.6%

(1)    Excludes $0.2m Share-Based payment expense relating to the equity-linked strategic partnership with Chemist Warehouse. This is a non-IFRS measure.
(2)    FY21 revenues have been adjusted for constant currency (CC) to exclude FX translation impact. This is a non-IFRS measure.
                                                                                                                                                                                      4
Executive Summary

 PERFORMANCE BY BRAND

SUKIN remains the #1 Natural Skincare Brand; the #6 Total Skincare Brand and; the #1 Natural Haircare brand in Australian Pharmacy(1)
        • Net revenue up 16% YoY and 56% up 2H vs 1H
        • Gross margin maintained at 70-72%

ANDALOU NATURALS remains the #1 Natural Facial Skincare Brand and the #5 Haircare and Body care brand in the US Natural Channel(2)
      • Net revenue down 11% YoY and flat YoY in constant currency
      • Net revenue +18% up 2H vs 1H
      • Gross margin improved to 49-51%

MINERAL FUSION remains the #1 Cosmetics brand in US Natural Channel and #2 Natural Cosmetics Brand in US Conventional Channel(2)
       • Net revenue down 7% YoY and up 4% YoY in constant currency
       • Net revenue +19% up 2H vs 1H
       • Gross margin maintained at 56-58%

NOURISHED LIFE average basket size increased 17% YoY
       • Net revenue up 4% YoY or 6% on a LFL basis (excluding sales of hand wash and hand sanitiser)
       • Net revenue -12% down 2H vs 1H
       • Gross margin maintained at 33-35% (includes freight)

(1) Data sourced from IRI Market Edge MAT to 27/06/2021 based on data definitions provided by Sukin Australia.
(2) SPINS scan data – MAT to Jul 21

                                                                                                                                        5
Executive Summary

IT IS THE RIGHT STRATEGY AND NATURAL IS GOING MAINSTREAM

DISCIPLINED EXECUTION AGAINST THREE              FY22 OUTLOOK
YEAR STRATEGIC ROADMAP
                                                 The Group continues to closely monitor external conditions with key BWX markets and regions remaining at
Continued growth in points of distribution       varying stages of the COVID-19 pandemic recovery
globally, exceeding 1.4m in FY21 – on pace to    In Australia, the Group has experienced some variability to sales as a result of state based COVID-19
achieve 42% more in FY22, supported by           restrictions
retail partnerships and establishment of a new
direct-to-consumer business unit                 In North America, 2H21 performance showed encouraging signs of recovery vs 1H21, however the
                                                 1H22 performance remains subject to the COVID-19 situation in this region which remains uncertain
New manufacturing facility on track
for December 2021 opening – expected to          Notwithstanding the near-term uncertainty, the Group expects FY22 to benefit from:
deliver margin expansion and a step change in          • Full year contribution from Woolworths, which commenced in 2H21;
BWX's operational and financial performance            • Full year contribution from Flora & Fauna;
                                                       • Continued strong performance of the Group’s direct-to-consumer operations;
                                                       • Full year benefits from the Chemist Warehouse Strategic Partnership; and
                                                       • Recent distribution gains achieved in key retail channels

                                                 As the natural category continues to gain momentum and attract more consumers, BWX is ideally placed to
                                                 benefit from and accelerate this trend with important investments made in our brands and manufacturing
                                                 capability

                                                                                                                                                            6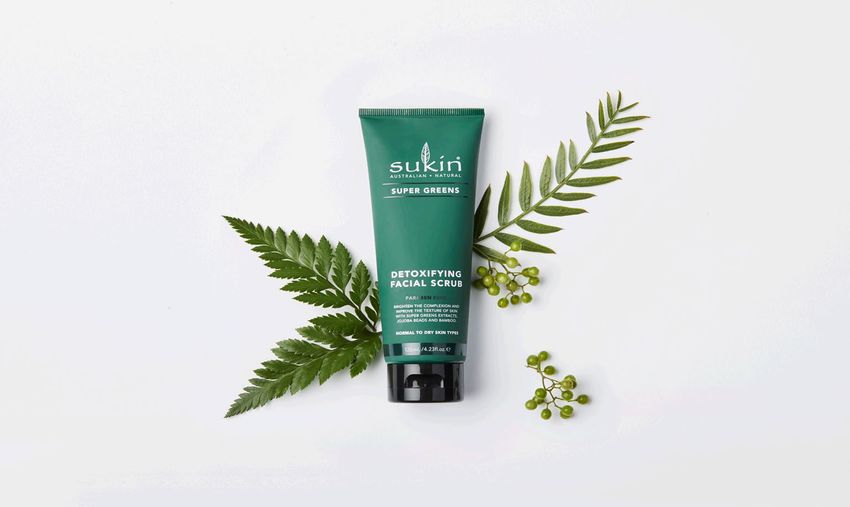
Agenda

                                                                             Purpose

                                                                             Highlights & Business Review

                                                                             Financial Summary

                                                                             Strategy & Outlook

Greta Gillmore Director, Operations & Alice Burnett Director, Distribution   Questions
                                                                                                            7
Purpose

NATURAL BEAUTY                        BWX is proudly a purpose-driven company
                                      We exist to democratise Natural
AND WELLNESS                          Our growing range of products empower
                                      consumers to make conscious choices to support their
FOR THE WORLD                         health and the health of the planet

  Global leaders    1.4 million+             1.2 million+              136 products
  in the Natural    Global points            engaged global            launched in
 beauty evolution   of distribution          Audience                  FY21
                    in FY21

                                                                                         8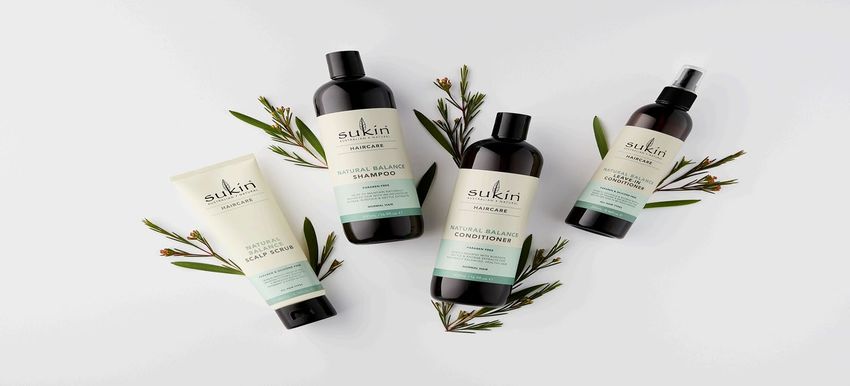
Financial Highlights
                                                                                                                                                                       Statutory
                                                                       Revenue(1)                                    EBITDA(2)                                           NPAT                                            In FY21 BWX achieved +11.5%
                                                                                                                                                                                                                             growth in EBITDA(2) and
      FY21                                                              $194.3m                                       $34.5m                                             $23.7m                                             delivered increased sales
                                                                                                                                                                                                                          and profit despite persistent
                                                                                                                                                                                                                                 global volatility

      FY20                                                              $187.7m                                       $30.9m                                             $14.7m                                             Revenue performance in
                                                                                                                                                                                                                           constant currency delivered
                                                                                                                                                                                                                               sales of $203.9m(1)
                                                                                                                                                                                                                            or +8.6% growth on FY20
      Change                                                                  3.5%                                       11.5%                                             60.9%                                              Healthy 2H21 sales
                                                                                                                                                                                                                        performance from core brands
                                                                                                                                                                                                                        of Sukin, Andalou Naturals and
                                                                                                                                                                                                                                Mineral Fusion
      Adjusted for                                                      $203.9m
      constant currency(1)(3)                                            +8.6%

(1) Excludes $0.2m Share-Based payment expense relating to the equity-linked strategic partnership with Chemist Warehouse
(2) EBITDA is a non-IFRS measure that excludes a net $5.9m benefit comprising of $6.9m of Acquisition Related Benefits, $0.2m Share-Based payment relating to the equity-linked strategic partnership with Chemist Warehouse and $0.8m impact of IFRIC agenda decision on
configuration and customisation costs in cloud computing arrangements
(3) Constant currency excludes FX translation impact
                                                                                                                                                                                                                                                                            9
Operational Highlights
Connect Go Global, Invest Get Clean &
to Consumers Go Mainstream In Ourselves Get Healthy
Building and scaling a Total distribution gains at 1.43m New Operations and Board endorsed sustainability
direct-to-consumer (D2C) model • Chemist Warehouse Group Manufacturing Facility on track targets for 100% recyclable
(equity-linked) and on budget & carbon neutral brands and
BWX brand.com sites activated • Woolworths Group operations by 2030
in additional countries via • Walmart Canada Building capability across all regions
The Hut Group with significant appointments in Gross Margin improved 134 bps
Depth of distribution achieved
D2C business represents growth markets to 59.3% in FY21
within global retail partners
29% of FY21 group revenue Employee engagement survey Global Group Procurement
New product development
supporting incremental score in line with FY20 which was improving sourcing initiatives
Brand insight work for
distribution growth a COVID-19 impacted period (cost and efficiency)
global brand positioning
and growth platforms Increasing penetration across Expanded incentive scheme Continued ERP upgrades
Marketing reinvestment all consumer touchpoints to all BWX employees improving reporting
at 15% of FY21 revenue Pharmacy, Grocery, Mass and AFR Best Places to Work Winner in
E-commerce and all growth markets
Manufacturing and Consumer
NPD revenue at 14%
Progressing toward achieving 42% Goods category (2021)
of FY21 revenue
growth in distribution gains in FY22
10Brand Highlights
37.1
Net Revenue ($m) ■ 2H Net Revenue ($m) ■ 2H Net Revenue ($m) ■ 2H Net Revenue ($m) ■ 2H
■ 1H ■ 1H ■ 1H ■ 1H
95.0 53.3 28.4 24.1 25.2
47.6 26.3
33.1
81.7 57.9
25.8 14.3 11.8
13.4
37.1 21.8 12.0
+56% +18% +19% -12%
FY20 FY21 (2H vs 1H) FY20 FY21 (2H Vs 1H) FY20 FY21 (2H Vs 1H) FY20 FY21 (2H Vs 1H)
YoY +16% growth YoY -11% decline or flat in YoY -7% decline or +4% growth in YoY +4% growth or +6% growth
49% FY21 group revenue constant currency: $53.0m FY21 constant currency: $29.5m FY21 on a LFL basis (excludes sales of
hand sanitiser + hand wash sales)
FY21 gross margin maintained 24% FY21 group revenue 14% FY21 group revenue
13% FY21 group revenue
at 70-72% FY21 gross margin improved FY21 gross margin maintained
to 49-51% at 56-58% FY21 gross margin maintained
at 33-35% (includes freight)
11Net Revenue ($m)
In Australian Pharmacy, Sukin remains the #1
Natural Skincare Brand(1); the #6 Total Skincare 20% Hair
Brand and; the #1 Natural Haircare brand(1)
In Australian Grocery, Sukin is the clear
23% Body
#1 Natural skincare brand(1) and the #6 Total
Skincare brand(1)
636k points of distribution in FY21 57% Skin
Successful launch into Woolworths Q4 FY21 and
immediately became the #1 Natural skincare
brand(1) and the #6 Total Skincare brand(1) in
this channel
Sukin growth supported by further category
expansion into Hair and Body across all markets
(1) Data sourced from IRI MarketEdge MAT to 27/06/2021
based on data definitions provided by Sukin Australia.
12Net Revenue ($m)
37.1
16% Body
In US Natural Channel, Andalou Naturals
remains the #1 Natural Skincare Brand(1) and
the #5 Natural Haircare and Body Care Brand(1)
33.1
17% Hair
383k points of distribution in FY21
Growth supported by innovative NPD and 67% Skin
continued global roll out of Andalou Naturals
products instore and online via localised
websites
LFL sales growth impacted by slower retail
recovery in the US and EU markets, remaining
flat in constant currency
(1) SPINS scan data – MAT to Jul 21
13In the US Natural Channel, Mineral Fusion Net Revenue ($m)
remains the #1 Cosmetics Brand and, in the US,
Conventional Channel improved to the #2
Natural Cosmetics Brand(1)
Mineral Fusion outperforming in a category 28% Nail
that is down overall, with improved foot traffic
in Q4 FY21
408k points of distribution in FY21
The colour cosmetics market is poised 72% Cosmetics
for a recovery for the remainder of CY21,
leading to a robust industry backdrop for 2022
Mineral Fusion growth fuelled by continued
e-commerce and marketing investment;
distribution gains across all sales channels;
and transforming the customer experience
with innovations like virtual try-on and
product diversity
(1) SPINS scan data – MAT to July 21
14Improved profitability due to reduction of Average Basket Size +17% vs FY20
promotional frequency and increasing
promotional effectiveness
Brand repositioning launched Q4 FY21
Launch of 67 new brands or 2450+ new
products in FY21 whilst exiting underperforming
brands
Enhanced customer retention with active
customer churn rate of +8% vs pcp
FY20 FY21
Revenue from Electronic Direct Marketing +13%
vs pcp
New contacts +28% vs pcp
Outlook for growth supported by
establishment of new D2C business unit
following 100% acquisition of Flora & Fauna
and reinvestment of synergies captured
15Financial Summary
Buddika Perera Supply Chain Manager
16Financial Performance
Constant
• Statutory NPAT increased 60.9% in FY21 vs FY20 AUD million FY20 FY21 Change Currency Change
• Net Revenue(1) increase by 8.6% on a constant currency basis Revenue(1) 187.7 194.3 3.5% 203.9 8.6%
• Gross Profit Margin increased 134 bps to 59.3% Gross Profit 108.8 115.3 6.0%
• Operating Expenses increased by 3.9% and reflects controlled and Gross Profit Margin 58.0% 59.3% 134bps
strategic investment across marketing initiatives, along with Operating Expenses -79.4 -82.5 3.9%
building people capability across the Group
Other Income 1.5 1.7 13.3%
• Depreciation & Amortisation has increased by 15.3% driven
by acquisitions of plant and equipment and intangible assets EBITDA(2) 30.9 34.5 11.5%
• Group effective tax rate of 22.8%(3) EBITDA margin(2) 16.5% 17.8% 127bps
• Fully franked final dividend(4) of 3.1 cents per share determined Equity Strategic Partnership - -0.2 -
for FY21 within dividend pay-out guidance of 35-50% Cloud Computing Costs -0.9 -0.8
• Earnings per share of 17.1c, 44.9% growth on FY20 Acquisition-Related Cost/Benefit -0.1 6.9 -
Depreciation & Amortisation -6.1 -7.1 15.3%
Interest Expense -4.0 -2.6 -34.7%
(1) Excludes $0.2m Share-Based payment expense relating to the equity-linked strategic partnership with Chemist Warehouse
(2) EBITDA is a non-IFRS measure that excludes a net $5.9m benefit comprising of $6.9m of Acquisition Related Benefits, $0.2m Share-
Tax -5.0 -7.0 39.2%
Based payment relating to the equity-linked strategic partnership with Chemist Warehouse and $0.8m impact of IFRIC agenda decision on
configuration and customisation costs in cloud computing arrangements NPAT - Reported 14.7 23.7 60.9%
(3) Effective tax rate impacted by the Acquisition-related benefits deemed as non-assessable for income tax purposes
(4) On 27 August 2021, BWX declared its intention to raise approximately $100.0m from an Institutional Placement and Share Purchase EPS - Reported 11.8 17.1 44.9%
Plan. Assuming that these shares are issued prior to the record date, and on the assumption that the full amount is raised, BWX
anticipates that it would pay a fully-franked final dividend of 3.1 cents per share
Dividend per share 3.9 4.1 5.1%
17Balance Sheet
AUD million JUN 20(1) JUN 21 Change FY21
• Strong balance sheet maintained and improved cash position of $70.5m Assets
• Trade and other receivables increased by 10.2% and reflective of sales volume Cash 28.6 70.5 41.9
with our debtor day ratio in line with last year. Trade and other receivables 39.9 43.9 4.0
Inventories 36.8 44.0 7.2
• Inventory increased by 19.6% compared to pcp to support our transition into
our new operations facility during 1H FY22 along with supporting new Prepayments 1.7 3.0 1.3
increases in distribution points during Q1 FY22 Contract Assets - 3.6 3.6
Right of use asset 12.6 9.0 -3.6
• Trade and other payables increased compared to pcp, reflecting purchasing
and supplier term outcomes Plant and equipment 5.7 19.9 14.2
Intangible assets and goodwill 318.1 300.1 -18.0
• Financial liabilities include bank debt ($52.4m) and deferred consideration and - 0.9 0.9
Investments in associates
payments on acquisition
Other assets - 1.6 1.6
• In accordance with AASB 16 Leases accounting standard, the Group recognises Total assets 443.5 496.5 53.0
a right of use asset ($9.0m) and lease liability ($10.8m)
Liabilities
(1) Restated to include impact of IFRIC agenda decision on configuration and customisation costs in cloud computing arrangements
Trade and other payables 31.7 43.9 12.2
Financial liabilities 70.3 52.5 -17.8
Lease Liabilities 14.8 10.8 -4.0
Current tax liabilities 1.7 6.2 4.5
Employee benefits 1.9 2.3 0.4
Deferred tax liabilities 25.1 22.0 -3.1
Total liabilities 145.5 137.7 -7.8
Net assets 298.0 358.8 60.8
18Working Capital
Working capital well maintained to support sales Working Capital Movements ($m)
growth along with new product development
and global retailer launches
The Group significantly increased its cash
position to $70.5m in FY21 (from $28.6m
at FY20)
Inventory movement reflects strong
momentum in new distribution gains coming
online early in Q1 FY22, coupled with securing
transition into our new operations facility
19Cash Flow Reconciliation
• Cash conversion ratio of 74.1% highlights the healthy cash generating AUD million FY20 FY21
profile of the Group and reflects the sustainable approach to working
capital management EBITDA(1) 30.9 34.5
• Capital expenditure in line with expectations, has increased to support
Working Capital Movements 1.6 -0.1
new manufacturing facility
• Tax payments are in line with expectations Non-Recurring Costs -0.1 -0.5
Interest Expense -3.2 -2.6
Tax -0.7 -4.3
Other -0.5 -1.5
Operating Cash Flow 28.0 25.5
Capital Expenditure - Operational -6.3 -6.1
Capital Expenditure - New Manufacturing Facility - -10.2
(1) EBITDA is a non-IFRS measure that excludes a net $5.9m benefit comprising of $6.9m of Acquisition Related Benefits, $0.2m Share-Based
payment relating to the equity-linked strategic partnership with Chemist Warehouse and $0.8m impact of IFRIC agenda decision on
configuration and customisation costs in cloud computing arrangements
20Strategy & Outlook
Nicole Ozenir Senior Purchasing Officer & Sandi Foran Purchasing Manager APAC
21Strategic Scorecard
Connect Go Global, Invest Get Clean &
to Consumers Go Mainstream In Ourselves Get Healthy
Strategic Progress…
Global direct-to-consumer Points of distribution on pace Building a fully integrated and agile Targeting 100% recyclable & carbon
expansion for 42% growth in FY22 Operations & Manufacturing Facility neutral brands & operations by
LTIFR improved to 2 years, no lost 2030
Continuing reinvestment Deepening of cross border
in marketing e-commerce penetration to time Solid procurement savings and
complement global retail presence Maintained strong Net Promoter trade spend investment supporting
NPD pipeline targeting high Score gross margin improvements
growth categories
ERP assisting inventory planning for
targeted & efficient retail
promotions
Continuing to Improve…
Share of D2C revenues from Select international expansion Stock turn efficiencies Gross margin improvement with
29% to 38% of total group revenue opportunities through the formation new operations facility
S&OP systems to reduce out-of-stocks
by end of FY23 of a global business development and cash burn Cost base and maintaining
Marketing ROI team commitment not to drive cost
Acceleration of roll out of localised faster than sales growth
websites and marketing via strategic Reporting and insights through
partnerships the implementation of PowerBI
22Expanding Points of Distribution Globally
BWX delivered 1.4 million in points of distribution for FY21
& we are on pace to deliver 2 million global points of distribution by FY22
FY22 Global Target +42% FY21 Actual FY22
AMERICAS
120,000 FY22 Projected +62%
100,000
80,000
FY22
60,000 AUSTRALIA FY21 635,788 382,934 407,624
+12%
40,000 FY22
FY22 UK & EMEA
20,000 ASIA +54%
+14% 935,422 522,053 564,094
0 FY22
Asia UK/EU AUS US +47% +36% +38%
Target for 2 million points of distribution are planned across the full financial year
in line with roll out plans and retailer review schedules
23Complementary Omni-Channel Approach
We are dedicated to driving omni-channel distribution growth, ensuring that the presence of our brands is
evolving with the shopping habits of our consumers
+50 Global E-tailer Partnerships 178 Global Retail Partnerships
19,860 Points of Distribution Sold Online 25 Active Markets
12 Owned E-commerce Sites Globally 18,601 Retailing Outlets
24Direct-to-Consumer Focus
• Establishing BWX's D2C business unit led by
Julie Mathers, Founding CEO of Flora & Fauna,
with a vision to better service the fast-growing
online community of conscious consumers
• Combined scale and customer reach
positions BWX to benefit from the structural
market shift toward online shopping
• Opportunities to leverage supply chain,
procurement, and cross-selling to unlock
more growth and reinvestment
• Synergies to be realised across marketing;
NPD and range extensions; distribution and
efficiencies - supporting case for margin
enhancement
• EPS accretive in FY22 and strongly EPS
accretive by FY24
25Direct-to-Consumer Strategy
• Flora & Fauna and Nourished Life
are market-leading platforms
each bringing a unique customer
value proposition through
respective product and category
100% vegan eco-retailer with a core focus on ethical 100% Natural beauty and wellness retailer with a core
offerings, with minimal overlap in focus on inner and outer beauty
and sustainable products
customers (~13%) and SKUs Winning in categories of eco, eco home, skincare, Winning in categories of Natural beauty, health and
(Acquisition of
Founded in 2014 by Australian beauty editor and
• BWX has entered into a Share
entrepreneur Zoë Foster Blake, Go-To offers simple,
Purchase Agreement to acquire
effective, trustworthy skin care based on best-in-class
a 50.1% interest in Go-To for
botanical ingredients
~$89m
• Represents a strategically and Significant brand equity and loyal customer following
financially compelling with a focus on education and communication
opportunity for BWX to partner
with one of Australia’s leading
skin care brands
Best-in-class e-commerce platform capturing the
• Track record of growth with brand’s unique value proposition by offering
customers a seamless shopping experience
FY21 revenue of $36.8m and
EBITDA of $11.6m
• Pre-synergies, expected to be Significant acceleration of BWX’s strategy with a complementary product suite providing high
mid-single digit FY21 EPS quality growth and diversification for BWX via enhanced D2C channels and expansion into
accretive on a pro-forma basis “masstige” subcategory both domestically and internationally
from year one
27Sustainability
BWX aims to be a leader in sustainability and demonstrate excellence
in environmental, social and governance issues Sustainability Goals Environmental, Social
We’re taking positive steps to minimise our impact on the
& Governance Focus
environment, improve employee safety and wellbeing, and provide
natural and efficacious products to our customers and consumers
Carbon neutral for all brands by ESG & Sustainability Committee created
end FY23 (Sukin carbon neutral since at Board level to oversee ESG risks and
2008) and operations by 2030 identify sustainability opportunities.
Enhanced ESG report with GRI focus.
All packaging to be diverted from landfill AFR Best Places to Work Winner in
Manufacturing and Consumer Goods
category (2021)
Minimum 50% average recycled content Targeted reduction in gender pay
in all packaging and 100% recycled disparity in FY22, no gap by FY25
content across all PET bottles, cartons
and shippers
Become a certified B-Corporation at BeXtra Safe program driving significant
Group level (verification now underway) drop-in long-term injury frequency rates
Achieved ISO 45001 Stage 1 Certification
in Australian operation
28New Operations Facility
All key milestones being met and on track to open in December
calendar year 2021
Expected to deliver material EBITDA growth over and above the current
Three Year Strategic Plan
• Automated, high-speed production lines that will drive significant per unit
cost reduction and deliver margin expansion to help fuel future growth
• Triple throughput compared to existing site, with total manufacturing
capacity expected to increase to >100m+ units
• Enhanced control over end-to-end supply chain, more flexibility and
scalability for future growth
• Investment in R&D, laboratory facilities and pilot plant to accelerate
our innovation and speed to market
Artist’s impression
4
Labour productivity and efficiency gains
Material cost reduction
years(1) Material waste reduction of ~50%
expected Enhanced sustainability goals
pay back Expected to be EPS accretive in FY23 and onwards
(1) Expected payback of four years from completion in relation to the full capital investment of $33.7m to fund the new operations July 2021 August 2021
facility
August 2021 29Scaling the Natural Trend Globally
Supportive macro trends Growth of Natural by Market
Self-care trends sustained across all categories of
skin, body, hair with growing category demand for
Natural beauty
The rise of the conscious consumer helping Skin, Body & Australia USA (inc Cos) United Kingdom Global
to accelerate growth Hair Categories
Combined
Digital penetration will continue to grow
globally, complementing BWX’s in-store brand (All values in USD)
footprint
Australia is behind other developed markets $1.5 billion $31.3 billion $5.6 billion $260 billion
for retail penetration with ~10% of all retail sales +6.0% CAGR +5.8% CAGR +4.7% CAGR
online, versus 20% (USA, UK)
E-commerce revenue growth in Australia
Value
is growing at 9% versus 6% for department store
revenue (CAGR 2020-2024)(1)
of Natural $230m $2.5b $340m $33.2b
Market(2)
BWX Share ($)
(1) Euromonitor database. Online retail penetration rate calculated
of Natural 26% 1.5% 1.3%
as E-Commerce Sales over Retail Sale.
(2) Approximated category size based on all available category data
Market
and classification of natural.
30FY22 Outlook
IT IS THE RIGHT STRATEGY AND NATURAL IS GOING MAINSTREAM
The Group continues to closely monitor external conditions with key BWX markets and regions remaining at varying stages of the COVID-19
pandemic recovery.
In Australia, the Group has experienced some variability to sales as a result of state based COVID-19 Restrictions.
In North America, 2H21 performance showed encouraging signs of recovery vs 1H21, however the 1H22 performance remains subject to the
COVID-19 situation in this region which remains uncertain.
Notwithstanding the near-term uncertainty, the Group expects FY22 to benefit from:
• Full year contribution from Woolworths, which commenced in 2H21;
• Full year contribution from Flora & Fauna;
• Continued strong performance of the Group’s direct-to-consumer operations;
• Full year benefits from the Chemist Warehouse Strategic Partnership; and
• Recent distribution gains achieved in key retail channels
As the natural category continues to gain momentum and attract more consumers, BWX is ideally placed to benefit from and accelerate this trend
with important investments made in our brands and manufacturing capability
31Questions
Colin Lai Group Financial Controller
Page 32You can also read


