Allegro.eu Q3 2021 Results presentation - 9 November 2021
←
→
Page content transcription
If your browser does not render page correctly, please read the page content below

| 1

Allegro.eu
Q3 2021
Results presentation

9 November 2021
| 2

Disclaimer

This presentation (“Presentation”) has been prepared by Allegro.eu, a public limited liability company (société anonyme) incorporated and existing under the laws of the Grand
Duchy of Luxembourg, having its registered office at 1, rue Hildegard von Bingen, L – 1282 Luxembourg, Grand Duchy of Luxembourg and being registered with the
Luxembourg Register of Trade and Companies (Registre de Commerce et des Sociétés, Luxembourg) under number B 214830 (“Allegro.eu”), and its subsidiaries (together the
“Allegro Group”). Copying, mailing, distribution or delivery of this Presentation to any person in some jurisdictions may be subject to certain legal restrictions, and persons who
may or have received this Presentation should familiarize themselves with any such restrictions and abide by them. Failure to observe such restrictions may be deemed an
infringement of applicable laws.
This Presentation was prepared for information purposes only and is neither a purchase or sale offer, nor a solicitation of an offer to purchase or sell any securities or financial
instruments or an invitation to participate in any commercial venture. This Presentation is neither an offer nor an invitation to purchase or subscribe for any securities in any
jurisdiction and no statements contained herein nor the fact of its distribution may serve as a basis for any agreement, commitment or investment decision, or may be relied
upon in connection with any agreement, commitment or investment decision.
This Presentation contains neither a complete nor a comprehensive financial or commercial analysis of Allegro Group, nor does it present its position or prospects in a
complete or comprehensive manner. Allegro Group has prepared the Presentation with due care, however certain inconsistencies or omissions might have appeared in it. No
warranties or representations can be made as to the comprehensiveness or reliability of the information contained in this Presentation. Neither Allegro Group nor its directors,
managers, advisers or representatives of such persons shall bear any liability that might arise in connection with any use of this Presentation. Furthermore, no information
contained herein constitutes an obligation or representation of Allegro Group, its managers or directors, its shareholders, subsidiary undertakings, advisers or representatives
of such persons.
The Presentation may and does contain forward-looking statements. Examples of these forward looking statements include, but are not limited to statements of plans,
objectives or goals and statements of assumptions underlying those statements. Words such as “may”, “will”, “expect”, “intend”, “plan”, “estimate”, “anticipate”, “believe”,
“continue”, “probability”, “risk”, and other similar words are intended to identify forward looking statements but are not the exclusive means of identifying those statements. By
their very nature, forward looking statements involve inherent risks and uncertainties, both general and specific, and risks exist that such predictions, forecasts, projections and
other forward looking statements will not be achieved. A number of important factors could cause Allegro Group actual results to differ materially from the plans, objectives,
expectations, estimates and intentions expressed in such forward looking statements. Past performance of Allegro Group cannot be relied on as a guide to future
performance. Forward looking statements speak only as at the date of this presentation. Any forward looking statements in this Presentation must not be understood as
Allegro Group’s assurances or projections concerning future expected results of Allegro Group. The Presentation is not and shall not be understood as a forecast of future
results of Allegro Group and as a consequence, no undue reliance shall be placed on any forward-looking statement contained in this Presentation. Allegro.eu expressly
disclaims any obligations or undertaking to release any update of, or revisions to, any forward looking statements, except as required by applicable law or regulation.
| 3

         1            2
         Highlights   Financial
                      results
Agenda
         3            4
         Summary      Q&A
| 4
1 Allegro GMV growth accelerates to 19.9% in Q3 with full year expectations
unchanged
Growth driven by solid progress on business inputs with Allegro Pay and delivery projects reaching important milestones:
GMV growing to PLN 9,897m, +19.9% YoY for Q3 and to PLN 29,933m, +23.4% YoY for 9M 2021
Revenue for Q3 was PLN 1,234m, up by 32.9% YoY, and reached PLN 3,752m, +39.0% for 9M 2021
Active Buyers grew to 13.3m in Q3, +5.6% YoY and +0.8% QoQ, reflecting successful retention of clients acquired during the
pandemic
LTM GMV per Active Buyer increased to PLN 3,067, +24.5% YoY, and +3.3% QoQ, underpinned by retail basics execution and
rising Smart! penetration
Consistently high Customer Service NPS1 score of 77.4 in Q3
Adjusted EBITDA for Q3 was PLN 472m, +15.5% YoY, and for 9M PLN 1,567m, +28.8% YoY
Adjusted net profit up +128.1% YoY in Q3 and +102.2% in 9M 2021
Capex grew by 120.0% YoY in Q3 and by 54.8% YoY in 9M, reaching 8.4% of Q3 and 6.8% of 9M revenue in line with plans
Continued organic deleveraging down to 1.8x as at Q3
On track to meet 2021 expectations
Allegro announced an agreement to acquire Mall Group a.s. and WE |DO CZ s.r.o., nearly doubling TAM, targeting
completion by late H1 2022
1. NPS – net promoter score
Source: Company information
| 5

1          Q3 2021 key results

           GMV                                                      Active Buyers                                            GMV per Active Buyer1               Take Rate2

            PLN 9,897m Q3’21                                        13.3m Q3’21                                              PLN 3,067 Q3’21                     10.29% Q3’21
            +19.9% YoY                                              +5.6% YoY                                                +24.5% YoY                          +0.90pp YoY

            PLN 29,933m 9M’21                                                                                                                                    10.40% 9M’21
            +23.4% YoY                                                                                                                                           +1.20pp YoY

           Revenue                                                  Adjusted EBITDA                                          Adjusted EBITDA / GMV               Cash Conversion3
                                                                                                                             margin
           PLN 1,234m Q3’21                                         PLN 472m Q3’21                                           4.77% Q3’21                         78.1% Q3’21
           +32.9% YoY                                               +15.5% YoY                                               -0.18pp YoY                         -10.40pp YoY
           PLN 3,752m 9M’21                                         PLN 1,567m 9M’21                                         5.24% 9M’21                         83.6% 9M’21
           +39.0% YoY                                               +28.8% YoY                                               +0.22pp 9M’21                       -2.74pp YoY

1. GMV for the twelve months preceding the end of a period (excluding eBilet’s tickets sales) divided by the number of Active Buyers at the end of such period
2. Defined as 3P Marketplace Revenue / (GMV – 1P GMV)
3. Defined as (Adjusted EBITDA – Capex ) / Adjusted EBITDA
Source: Company information
| 6

1         Key business developments for Q3 2021

                                                                                                                             Adjacent    International
                                                                                                 Consumer        B2B                      expansion
                                                                                 International                               verticals
                                                         Smart!    Advertising                    FinTech
                                            Delivery                                sellers
                              Retail                                               inbound
           Benefit from                    experience
                              Basics
            underlying
          market growth

                                  “Accelerate the flywheel”                                      “Incubate and maximise future levers”

                                                              While considering opportunistic M&A

                                       Retail Basics               Delivery experience                           Smart!

                                       Allegro Pay                     International                               ESG

Source: Company information
| 7

1          Retail Basics: consumer-centric approach to providing the best selection, price,
           and convenience

                    Further selection growth                     Price leadership                        Improving convenience

            • Crossed the >250m offers milestone      • Continuously improving coverage of price   • New, faster and highly automated
            • In Q3 we added Dada and Sprandi local     benchmarking processes                       commission refund process now fully
               brands and a regional retailer Duka    • Strong take-up of the price support          rolled-out
                                                        program Allegro Ceny: 6X merchants QoQ     • Allegro Family driving new buyers
                                                        in Q3                                        acquisition and reactivation, unlocking
                                                      • Sequential improvement in price defect       multiple UX1 benefits for buyers
                                                        metrics                                    • First 1-click payment solution from Polish
                                                                                                     banks launched first on Allegro

1. UX – user experience
Source: Company information
| 8

1         Improvement in next day delivery; started commercial pilot of One Fulfillment and
          launched APM network One Box, complemented by same day courier acquisition

                  Improving delivery speed                                Fulfillment                                        Last Mile

                                               +8pp

                              % of parcels
                              delivered
                              next day
                                              Q3   Q3
                                             2020 2021

           • Significant improvement of next day           • One Fulfillment by Allegro – commercial         • One Box by Allegro – over 600 green APMs
             delivery share by nearly 8pp YoY thanks to      pilot with a limited merchants pool went live     available for the customers from 3
             continued tech innovation and Fast Delivery     on 13 September creating a new,                   November, and a total of 3,000 planned by
             Subsidy program for merchants                   comprehensive logistics service for               the end of 2022
           • Improved visibility of next day delivery        merchants                                       • Customer-friendly integration embedded in
             promise in search filters and results         • Further commercial scaling allowing more          the Allegro app, all the way from order to
           • XPC acquisition on 11 October: a local          merchants planned from Jan 2022                   pick-up
             same-day delivery company, to                 • Development, recruitment and fit-out in         • One Punkt by Allegro – partner PUDO
             complement fulfillment and lockers services     progress for automation phase and high            network developed by Allegro now
             in driving faster deliveries                    capacity operations, targeted for H1 2022         spanning 800 points across Poland

Source: Company information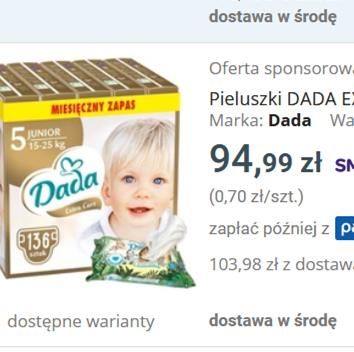
| 9

1           Further improving Smart! for customers and substantially growing the user base

                                         Growing the user base                                                          Improving Smart! for customers

            • Continuation of Smart! For Start campaign supporting substantial                              • Single PLN 40 MOV2 across all delivery methods driving
              growth in Smart! user base and driving conversion to paid                                       simplification of Smart! customer shopping funnel
              membership                                                                                    • Over 160 million offers now available in Allegro Smart! with rising
            • Record GMV performance of Smart! Week campaign (Sep 27-3 Oct),                                  share of 1-2 day deliveries, >25 million offers available for next-day
              boosted by Smart! For Start customers1:                                                         delivery, and several million available on the same day
              o >1.5 million promotional offers                                                             • 3 years of Smart! program: PLN 3bn savings by customers on free
              o Price cuts of up to 70%                                                                       deliveries and significant sales boost for merchants to drive the
                                                                                                              marketplace flywheel

1. Smart! For Start trial users were offered unlimited free deliveries and returns during the Smart! Week
2. MOV – minimum order value
Source: Company information
| 10

1          Allegro Pay: raising 2021 loans issued guidance with acceleration driven by full
           customer eligibility

                                                                                                                                 • Allegro Pay now open to all customers
                                                                                                                                   wishing to apply for up to PLN 4,200
                                                                                                                                   purchasing limit
                                                                                                                                 • Leveraging PSD21 access to widen
            Loans issued                                                                        >1,500                             credit checking capabilities to include
                                                                                                                                   new Allegro Active Buyers
            PLN m,
                                                                                     1,077                                       • NPS2 reached sector-leading 93 in Q3
            cumulative
                                                                                                                                 • Record-setting Smart! Week for
                                                                             526                            Initial 2021           Allegro Pay, with very high demand for
                                                                                                            guidance of >1,000     financing solutions
                                                                    179                                                          • Incrementality estimate from A/B test
                                                  76
                                                                                                                                   results: at least 35% higher spend
                                               Dec-20              Mar-21   Jun-21   Sep-21     Revised                            from Allegro Pay borrowers
                                                                                              2021 target
                                                                                                                                 • BNPL3 selected for majority of
            Gross loans                                                                                                            transactions, with short tenors driving
                                                                                                                                   up ROI on loan book
            balance
            PLN m                                                                                >500
                                                                                                                                 • Expected credit losses still
| 11
1 Agreement with AION to take instalment loans off-balance sheet allowing for Allegro
Pay growth acceleration and improved returns on investment
Key terms Key benefits
• Receivables Purchase Agreement signed between Allegro • Dedicated external funding for continued fast loan
Pay and Aion Bank on 11 October origination and multi-year scaling of Allegro Pay
• The total balance of outstanding loans to be financed • Virtually eliminates consumption of net working capital for
targeted to reach PLN 2bn within the 2-year agreement instalment loans, while fast-rotating BNPL1 loans remain on
• Funding expected to be used for instalment loans with balance sheet
BNPL1 exposure remaining on the balance sheet • Some positive net margin expected to be retained in Group
• 1st PLN 100-200m tranche to be sold by 2021 year-end, EBITDA on sold instalment loans
with project now in the implementation phase • Accelerated Allegro Pay driving marketplace GMV and
• Sold loans expected to be de-recognized from the Group's revenues, leveraging observed 35%+ incrementality
balance sheet • Utilizing off-balance sheet financing significantly increases
• No change from the customer perspective with continued our ROIC2 from Allegro Pay and enables faster growth
issuance and servicing of the loans by Allegro Pay
1. Buy now pay later
2. Return on Invested Capital
Source: Company information| 12
1 Strategic rationale for the acquisition of Mall Group announced on 4 November
Nearly doubles Allegro’s TAM in highly attractive countries PLN 1,139bn
Combined retail TAM
Scattered competitive landscape provides opportunity to #1-2
Combined positions
create best-in-class consumer proposition in 4/6 markets1
Leverage Allegro’s large merchant base to turbocharge Mall’s ~135k
3P marketplace Combined merchants
Instant access to massive customer base with significant >2.5x
Difference between Allegro
upside for wallet share expansion and Mall’s GMV / customer
Access to critical cross-border fulfilment and Last Mile 194k m2
infrastructure and operations Logistics footprint
Strong cultural alignment and opportunity to bolster the +7,200
team with further international talent Combined FTEs
Enhanced scale with an enlarged footprint provides ~18m
Combined
amplified platform growth opportunities number of customers
1. Based on e-commerce segment share (% of GMV 2020) as defined by Euromonitor
Source: Company information; Retail TAM sourced from Euromonitor, which excludes sales of motor vehicles, motorcycles and vehicle parts, fuel, foodservice, rental and hire, wholesale industries and C2C| 13
1 Mall Group transaction highlights
Transaction Allegro to acquire 100% of Mall Group a.s. (“Mall Group”) and WE|DO CZ s.r.o. (“WE|DO”) from selling shareholders PPF, EC
summary Investments and Rockaway Capital1
Acquisition Comprises the e-commerce and logistics businesses and brands of Mall Group based in Czech Republic, Slovakia,
perimeter Hungary, Slovenia, Croatia and Poland
In FYE Mar-21, Mall Group achieved GMV of EUR 915m (PLN 4.2bn), gross margin of 14%2 and breakeven EBITDA3
Valuation Enterprise Value of EUR 925m (+ an up to EUR 50m price adjustment)4,5 or PLN 4.3bn for 100% of Mall Group shares on a
cash and debt free basis
o This equates to ~1.0x6 LTM Mar-21 GMV and ~7.2x6 LTM Mar-21 Gross Profit
Equity Value of EUR 881m (or PLN 4.1bn) after an adjustment of EUR 44m for debt and debt-like items
Financing 53.7% of equity value paid via cash consideration of EUR 474m (or PLN 2.2bn) to be financed with cash in hand and new debt
46.3% of equity value settled via stock consideration of EUR 407m (or PLN 1.9bn)
o Share volume to be issued is fixed based on 3M VWAP of PLN 55.98; volume to be issued capped at 33.6m shares7
o Allegro shares issued to sellers are subject to a 12-months lock-up period8
o Allegro has discretion to pay all or part of stock consideration in cash instead of issuing shares
Allegro pro-forma leverage post-transaction expected to be| 14
1 Allegro’s mid term ambitions to transform and grow Mall Group (2022-2025)
(2022-2025)
Marketplace 3P GMV share rising from 10% in Sep-21 to at least 2/3rd of GMV
transformation
GMV Mid-term growth at ~30% CAGR, accelerated by the deployment of Allegro’s marketplace across Mall
Group’s markets
Revenue Single-digit mid-term CAGR, driven by shift towards growing 3P take-rate and advertising revenue while 1P
operations are relatively stable
Adjusted EBITDA 2 years of investment in retail basics and marketplace transformation; climbing towards 2.5-3.0% of GMV
thereafter
Capex and FCF PLN ~300m p.a. capex driving FCF-negative profile over the first 2 years; Capex stabilizing at 1-2% of GMV
and FCF turning positive in outer years
Transaction costs PLN ~52m1 transaction costs expected at closing
1. Of which PLN 8m accrued to H1 2021
Source: Company information| 15
1 Continued ESG effort reflected in MSCI ESG rating upgrade to A, up from BB
Selected Q3 achievements
• MSCI ESG Ratings upgraded Allegro.eu to A from BB
• Publication of the Allegro.eu’s Annual ESG Report,
in accordance with international reporting
standards1: https://raportesg.allegro.pl/en/
• Commitment to decarbonisation initiatives: Allegro
joined the Science Based Targets initiative (SBTi),
a group of businesses committed to reduce their
emissions in line with climate science
• Allegro.eu Board of Directors approved the target
of >50% of Directors to be independent within
5 years
• In October, after the quarter end, Allegro signed
Diversity & Inclusion Declaration
1. Global standards for sustainability reporting (GRI Standards) audited externally
Source: Company information| 16
2 Average annual spend per buyer up 24.5% YoY and crossed PLN 3,000, while
Active Buyers returned to growth in Q3, up 5.6% YoY and 0.8% QoQ
Active Buyers (period end)1 LTM GMV / Active Buyer (period end)1
m PLN
5.6% 24.5%
3.3% 2.0% -0.5% 0.8% 3.1% 3.3%
13.2 13.2 13.3 6.7% 3,067
12.6 13.0 9.6% 2,880 2,969
2,699
2,463
Q3 Q4 Q1 Q2 Q3 Q3 Q4 Q1 Q2 Q3
2020 2020 2021 2021 2021 2020 2020 2021 2021 2021
QoQ YoY QoQ YoY
1. Active Buyer (period end) is defined as a unique e-mail address that has made at least one transaction in the last 12 months. Active Buyers (period end) and LTM GMV / Active Buyer (period end) are for Allegro.pl marketplace only
(excluding eBilet)
Source: Company information| 17
2 GMV growth accelerated to 19.9% YoY in Q3 with 2-year CAGR at 34%
GMV1
PLN bn
48.7% 57.5% 46.1% 10.6% 19.9% • LTM GMV up by 30.9% YoY, reaching PLN 40.8bn
• YoY growth driven by retail basics and increasing
10.9 Smart! GMV share reflected in buyer engagement
10.4
9.6 9.9 • eBilet continued recovery contributing +0.5pp to YoY
8.3 GMV growth in Q3 and -0.1pp for YTD
• Low COVID-19 infection rates and no offline retail
lockdowns in Q3 of both years still delivers 2 year
GMV CAGR of 34%
Q3 Q4 Q1 Q2 Q3
2020 2020 2021 2021 2021
YoY
1. GMV of Allegro Group: Allegro.pl marketplace and eBilet
Source: Company information| 18
2 Revenue grows strongly ahead of GMV growth in Q3, up by 32.9% YoY
Revenue Quarterly revenue structure
PLN m PLN m
39.0% 49.7% 61.2% 61.1% 28.4% 32.9%
3,752.2
1,299.0 1,308.1
0.5% 1,210.2 0.4% 0.4% 1,233.9 0.8%
9.1% 4.9% 8.7% 3.1% 2.9%
4.1% 8.9%
2,698.8 8.4%
928.7 0.6%
8.4% 4.0%
32.9%
1,233.9 85.6% 87.8% 87.4%
87.0%
928.7 86.9%
Q3 Q3 9M 9M Q3 Q4 Q1 Q2 Q3
2020 2021 2020 2021 2020 2020 2021 2021 2021
YoY YoY Marketplace1 Price comparison (Ceneo)
Advertising2 Other3
1. Corresponds to 3P Marketplace revenue and 1P Retail revenue
2. Advertising revenue includes Allegro marketplace advertising and Ceneo advertising revenues
3. Other revenue is primarily from hosting services and financial services
Source: Company information| 19
2 Marketplace and advertising drive Q3 revenue growth
Revenue Bridge Take Rate1
PLN m %
31.0% 39.7% -5.2% 91.8% 75.8% 32.9% • Take rate up by 0.9pp YoY and down by 0.17pp
QoQ, in line with expectations
1,233.9
• Usual seasonal drop expected for Q4
31.1 32.6 4.4
238.9
-1.9
928.7
10.43 10.46 10.29
9.40 9.44
Q3 Market- Advertising Price Retail Other Q3 Q3 Q4 Q1 Q2 Q3
2020 place compa- (1P) 2021 2020 2020 2021 2021 2021
rison
YoY
1. Defined as 3P Marketplace Revenue / (GMV – 1P GMV)
Source: Company information| 20
2 Moderate increase in cost of sales as % of revenue, driven by rising number of Smart!
subscribers
Cost of sales as % revenue
32%
31%
30% • Net costs of delivery up by 60% YoY due to rising
29%
27% 8% 6% number of Smart! users, higher transactions per user,
5%
5%
4% with YoY share of courier deliveries up 10.8pp in Q3
3% 3%
3% 3% • CoGS growth reflects increase in 1P revenue growth
4%
and its bigger role in supporting price and selection
for buyers
• Payment charges continue to decline as % of revenue
21% 21% 22% 22% from cheaper payments mix and volume-driven
19%
discounts
Q3 Q4 Q1 Q2 Q3
2020 2020 2021 2021 2021
Net costs of delivery1 Payment charges Cost of goods sold (1P)
1. PLN 3.3m of delivery costs related to free Smart! users included in marketing costs for Q3 2020, down from PLN 71.7m in Q2 2020, PLN 9.5m in Q1 2020, and nil in 2021
Source: Company information| 21
2 1.6pp YoY increase in SG&A costs as % of revenue to support innovation roadmap
SG&A as % revenue1
31%
29% • SG&A costs net of adjustments increased by 40% YoY
28% 4%
27%
3% 27% 1% in Q3 driven by rising marketing and staff costs
1% 3%
3% 4% 1% 2%
2% 0.3% 2% • Marketing costs growth driven largely by pay-per-click
1% 1%
2% expenses up by 31% YoY to drive traffic and GMV
10% 11% performance
9% 10%
10% • Underlying staff costs up by 39% YoY as headcount
grew by 33% YoY in Q3 to drive further innovation
capacity and execute the growth strategy
13% 13% 12% 13%
10%
Q3 Q4 Q1 Q2 Q3
2020 2020 2021 2021 2021
Marketing2 Staff IT service Net impairment losses Other
1. In calculating the percentages, category expenses are after deduction of amounts relating to items included in the adjustments made to arrive at Adjusted EBITDA
2. PLN 3.3m of delivery costs related to free Smart! users included in marketing costs for Q3 2020, down from PLN 71.7m in Q2 2020, PLN 9.5m in Q1 2020, and nil in 2021
Source: Company information| 22
2 Adjusted EBITDA at PLN 472m in Q3 2021, up by 15.5% YoY with Adjusted EBITDA
to GMV margins up 0.22pp for 9M YoY at 5.24%
26.7% 38.8% 50.6% 23.8% 15.5% 28.8%
1,567.2
Adjusted EBITDA1 1,216.5
PLN m
533.5 535.6 559.9
408.5 471.7
Q3 Q4 Q1 Q2 Q3 9M 9M
2020 2020 2021 2021 2021 2020 2021
% Margin 44.0% 41.1% 44.3% 42.8% 38.2% 45.1% 41.8%
% GMV2 4.95% 4.92% 5.58% 5.36% 4.77% 5.01% 5.24%
YoY
1. Adjusted EBITDA defined as EBITDA pre transaction costs, management fees (monitoring fees), stock-based compensation, restructuring costs and other one-off items
2. GMV of Allegro Group: Allegro.pl marketplace and eBilet
Source: Company information| 23
2 EBITDA adjustments during Q3 2021
Reconciliation of Adjusted EBITDA [PLN m] YTD Q3 2021 YTD Q3 2020 Change % Q3 2021 Q3 2020 Change % 1 In 2021 includes mainly
expenses in respect of
Adjusted EBITDA 1,567.2 1,216.5 28.8% 471.7 408.5 15.5%
international expansion
Monitoring costs - 2.8 (100.0%) - 1.1 (100.0%)
advisory fees
Regulatory proceeding costs 0.8 2.6 (70.5%) 0.2 0.7 (65.5%)
1 Group restructuring and development costs 18.6 2.8 563.0% 10.2 0.1 10447.9% 2 AIP in prior year related to
IPO grants with 2021
Donations to various public benefit organisations 2.3 4.5 (48.5%) - 0.8 (100.0%)
charge related to recurring
Bonus for employees and funds spent on protective equipment 1.0 2.9 (67.2%) 0.4 0.4 (5.9%) employee incentive plans
2 Allegro Incentive Plan (AIP) 12.5 14.6 (14.1%) 3.8 14.6 (74.0%)
3 IPO-related one-offs in
3 Management Investment Plan - 52.2 (100.0%) - 45.3 (100.0%)
prior year
Transaction costs - 60.8 (100.0%) - 60.8 (100.0%)
4 50 bps margin reduction in
EBITDA 1,532.1 1,073.3 42.7% 457.1 284.7 60.5%
Q3 triggered PLN 105.9m
Amortisation and Depreciation (381.0) (345.2) 10.4% (133.9) (117.0) 14.5%
non-cash financial gains
Amortisation (320.8) (298.1) 7.6% (110.7) (100.7) 10.0% from amortized cost
Depreciation (60.1) (47.1) 27.7% (23.2) (16.3) 42.5% valuation, with prior year
Operating profit 1,151.1 728.1 58.1% 323.1 167.8 92.6% impacted by IPO related
4 Net Financial result (44.6) (436.1) (89.8%) 57.6 (252.4) N/A refinancing
Profit / (loss) before Income tax 1,106.6 292.0 278.9% 380.7 (84.7) N/A 5 Low effective tax rate in Q3
5 Income tax expenses (216.7) (134.0) 61.7% (56.3) (47.0) 20.0% caused by non-taxable,
Net profit / (loss) 889.9 158.0 463.2% 324.4 (131.7) N/A non-cash financial gain of
PLN 105.9m
Source: Company information| 24
2 120% YoY capex acceleration in Q3, reflecting investments in Allegro One Lockers
Capital expenditures1 • Other capex growth driven by Allegro’s
by type 54.8%
flagship projects in Delivery Experience:
PLN m One Fulfillment and One Box APMs3 by
256.7 Allegro – aimed at faster deliveries and
incremental revenue from logistics
94.5
165.9 • Significant lockers deliveries and
120.0%
installation acceleration to continue in Q4
59.8
103.2
• Investment in larger Tech Team drives
45.0 162.1 capitalisation of projects delivering new
46.9
106.1
10.4
58.2 functionality and platform development
36.5
to support future growth
Q3 Q3 9M 9M
2020 2021 2020 2021 • New office fit-outs ongoing in Q3 and
over next few quarters
% cash conversion2 88.5% 78.1% 86.4% 83.6%
% of revenue 5.1% 8.4% 6.1% 6.8%
YoY Capitalised development costs Other
1. Presented values are related to cash flow from investing activities and does not include leased assets (which are presented in balance sheet and financing cash flow)
2. Defined as (Adjusted EBITDA – Capex ) / Adjusted EBITDA
3. Automated parcel machines
Source: Company information| 25
2 Further organic deleveraging to 1.8x
[PLN m] Sep-20 Proforma1 Jun-21 Sep-21 • Lower leverage triggered 50 bps drop in
interest rate from August
Adjusted EBITDA LTM 1,600.8 2,037.6 2,100.7
• External financing from Aion bank
Borrowings at amortised cost 5,437.4 5,445.8 5,344.0
expected to release PLN 100-200m from
Lease liabilities 77.4 162.4 236.3 working capital by 2021 year-end and
Less Cash (851.6) (1,570.7) (1,788.5) provide PLN 2bn over 2 years for Allegro
= Net Debt 4,663.2 4,037.5 3,791.8 Pay
Leverage 2.9x 2.0x 1.8x Mall acquisition EV EUR 925m funding:
Equity 7,779.2 8,737.9 9,116.8 • Own cash EUR 298m
Net debt to Equity 60% 46% 42%
• EUR 220m from new debt
• EUR 407m in new shares at PLN 56 per
share issued to sellers (3.3% dilution)
• Proforma post completion leverage| 26
2 On track to meet expectations for 2021 with focus on GMV growth through leading
on value proposition for consumers and merchants
2020 FY 2021 FY 2021
Actual Last update Update Comments
GMV 54% High teens-Low 20s% Unchanged • Q4 growth headwind from lock-downs in 2020
YoY growth YoY growth
Revenue 54% Low 30s% Unchanged • Take Rate seasonally lower in Q4, incl. lower “Co-fi”
YoY growth YoY growth yield on Smart! courier
Adjusted EBITDA1 31% High teens-Low 20s% Unchanged • Driving Smart! penetration
YoY growth YoY growth • Smart! courier delivery mix up in Q4
• Investing in teams to support innovation
Capex PLN 230m PLN 475-525m Unchanged • Rolling out One Box and One Fulfillment by Allegro
• Improved competitive offers having limited impact • Short-term risk of new digital taxes has now receded
Update on Outlook for 2022
• Priority to invest in GMV growth through retail basics and scaling Allegro Pay, Allegro APM and Allegro fulfilment operations
• Operating margins may therefore be softer in 2022 while further growth in absolute Adjusted EBITDA is a key financial objective
1. Adjusted EBITDA defined as EBITDA pre transaction costs, management fees (monitoring fees), stock-based compensation, restructuring costs and other one-off items
Source: Company information| 27
3 Summary
Q3 GMV growth accelerated to 20% YoY as anticipated
Crossing PLN 3,000 average annual spend per buyer
with Active Buyers returning to QoQ growth
Allegro Pay roll-out scaling strongly and external
financing arranged
Speeding up delivery times with Last Mile projects
passing key milestones
Maintaining guidance while investing in the leading
value proposition for consumers and merchants
Continued investment in people to execute ambitious
development roadmap
Mall Group acquisition to come in 2022, doubling TAM
and bringing a major new long-term growth lever
Source: Company information| 28 4 Questions & Answers
| 29

Thank you
You can also read