ASCENDAS INDIA TRUST
Citi-SGX-REITAS REITS and Sponsors Forum 2021
25 August 2021
←
→
Page content transcription
If your browser does not render page correctly, please read the page content below
ASCENDAS INDIA TRUST Citi-SGX-REITAS REITS and Sponsors Forum 2021 25 August 2021
Disclaimer
This presentation on a-iTrust’s results for the 6-month period ended 30 June 2021 (“1H FY2021”) should be read in conjunction with
a-iTrust’s half-yearly results announcement, a copy of which is available on www.sgx.com or www.a-iTrust.com.

This presentation may contain forward-looking statements. Actual future performance, outcomes and results may differ materially from those expressed in
forward-looking statements as a result of a number of risks, uncertainties and assumptions. Representative examples of these factors include (without
limitation) general industry and economic conditions, interest rate trends, cost of capital and capital availability, availability of real estate properties,
competition from other developments or companies, shifts in customer demands, shifts in expected levels of occupancy rate, property rental income,
charge out collections, changes in operating expenses (including employee wages, benefits and training, property operating expenses), governmental
and public policy changes and the continued availability of financing in the amounts and the terms necessary to support future business.
You are cautioned not to place undue reliance on these forward-looking statements, which are based on the current view of management regarding
future events. No representation or warranty express or implied is made as to, and no reliance should be placed on, the fairness, accuracy, completeness
or correctness of the information or opinions contained in this presentation. Neither Ascendas Property Fund Trustee Pte. Ltd. (“Trustee-Manager”) nor any
of its affiliates, advisers or representatives shall have any liability whatsoever (in negligence or otherwise) for any loss howsoever arising, whether directly or
indirectly, from any use of, reliance on or distribution of this presentation or its contents or otherwise arising in connection with this presentation.
The past performance of Ascendas India Trust (“a-iTrust”) is not indicative of future performance. The listing of the units in a-iTrust (“Units”) on the Singapore
Exchange Securities Trading Limited (SGX-ST) does not guarantee a liquid market for the Units. The value of the Units and the income derived from them
may fall as well as rise. Units are not obligations of, deposits in, or guaranteed by, the Trustee-Manager. An investment in the Units is subject to investment
risks, including the possible loss of the principal amount invested. Investors have no right to request that the Trustee-Manager redeem or purchase their
Units while the Units are listed on the SGX-ST. It is intended that holders of Units may only deal in their Units through trading on the SGX-ST.
This presentation for information only and does not constitute an invitation or offer to acquire, purchase or subscribe for the Units.

All measurements of floor area are defined herein as “Super Built-up Area” or “SBA”, which is the sum of the floor area enclosed within the walls, the area
occupied by the walls, and the common areas such as the lobbies, lift shafts, toilets and staircases of that property, and in respect of which rent is
payable.
The Indian Rupee and Singapore Dollar are defined herein as “INR/₹” and “SGD/S$” respectively.
Any discrepancy between individual amounts and total shown in this presentation is due to rounding.

                                                                                                                                                                      2
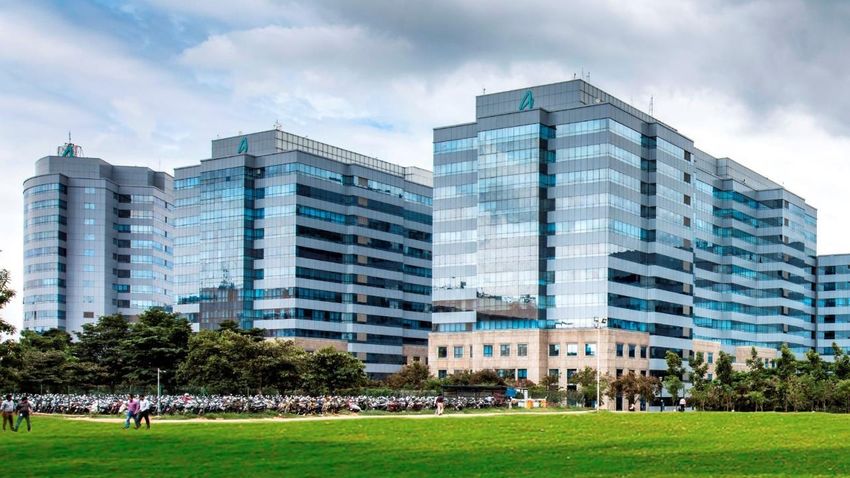
Overview

           International Tech Park Bangalore
Introduction to a-iTrust                                                                                       Mumbai
                                                                                                                 6%
Our presence                                                                 14.4 million sqft
                                                                                                       Pune
                                                                                                        10%
                                                                             of completed
                                                                             floor area                                          Bangalore
                                                                                                                                    36%

      Mumbai                                                                                      Chennai
      (Panvel)                                                                                      20%
                                                 Pune
      • Arshiya Panvel
                                                 • aVance Pune
        warehouses                                                                                                        Hyderabad
                                                                                                                             28%
      Bangalore                                                                                                 Chennai
                                                 Hyderabad
                                                                                                                  5%
      • International Tech                       • International Tech Park   7.7 million sqft1
        Park Bangalore                             Hyderabad                 of potential floor
                                                 • CyberPearl                area                                                 Bangalore
      Chennai                                    • aVance Hyderabad                                                                  40%
      • International Tech
        Park Chennai
      • CyberVale

                                                                                                   Hyderabad
                                                                                                      55%
Note: Percentages in graphs are by floor area.
1. Includes buildings under construction.                                                                                                     4
World Class IT Parks and Warehouses
Our products

                                                                                                   Arshiya warehouses

  Modern IT Parks built to international specifications   Modern warehouses with state of the art technology.
  & standards.

  Award winning properties                                Grade-A specifications
  •  ITPC: 2018 CNBC-AWAAZ Real Estate Awards             •  Up to G+6 racked structure
     Winner, “Best Commercial Project”                    •  13 metres ceiling height
  •  ITPC: 2013 FIABCI Prix d’Excellence Award Gold       •  M35 grade super flat floor
     Winner, Industrial Category                          •  Advanced fire detection system and security
  •  ITPB: 2012 FIABCI Prix d’Excellence Award Gold          services
     Winner, Industrial Category

                                                                                                                 5
FY2021 Investment Highlights
                                                           Proposed acquisition of a 6.6-acres greenfield site for the development of
                                                           a-iTrust’s maiden data centre (“DC”) campus in Navi Mumbai, India
                                                           • Site to be developed in phases into fully-fitted DC campus comprising two
                                                             buildings with total sanctioned load of 90MW
                                                           • Phase 1, with a total estimated investment of INR 12 billion / SGD 216.6 million 1, is
                                                             expected to be completed by 2Q 2024
                                                           • Acquisition reinforces a-iTrust’s proactive diversification strategy of entering new
                                                             economy asset classes
                Artist’s impression of the Data Centre

 Acquisition of aVance 6 building in HITEC City, Hyderabad which is primarily leased to Amazon
 Construction Funding/Forward Purchase of an Industrial Facility at Mahindra World City, Chennai (“Casa Grande”), marking a-iTrust’s first
 foray into the industrial asset class; facility is fully pre-leased to Pegatron, a leading Taiwanese contract electronics manufacturer
 Construction Funding/Forward Purchase of IT park at Hebbal, Bangalore (“Gardencity”), establishing our presence in North Bangalore, a
 premium IT/ITES micro-market where several Fortune 500 companies have a large presence

                       aVance 6         Artist’s impression of the industrial facility    Artist’s impressions of the IT park at Hebbal, Bangalore

1.   Based on exchange rate of SGD 1 to INR 55.0.                                                                                                     6
COVID-19 Updates
                       Second wave under control
                       •  Daily COVID-19 cases have fallen more than 90% from the peak of more than 410,000 cases in early May to average lower than 40,000 new
                          cases daily in the past week.
     COVID-19          •  Recovery rate remains high at more than 97% with fatality rates remaining low at about 1%.
      in India1
                       Lockdowns and restrictions lifted as India continues to ramp up vaccination drive
                       •   Lockdowns in many states have been lifted. India has administered more than 509 million doses of inoculation and about 113 million people
                           (about 8.3% of the population) have been fully vaccinated.

                       Operations
                       •  All our parks remain operational in support of our tenants’ operations.
                       •  Park population remains at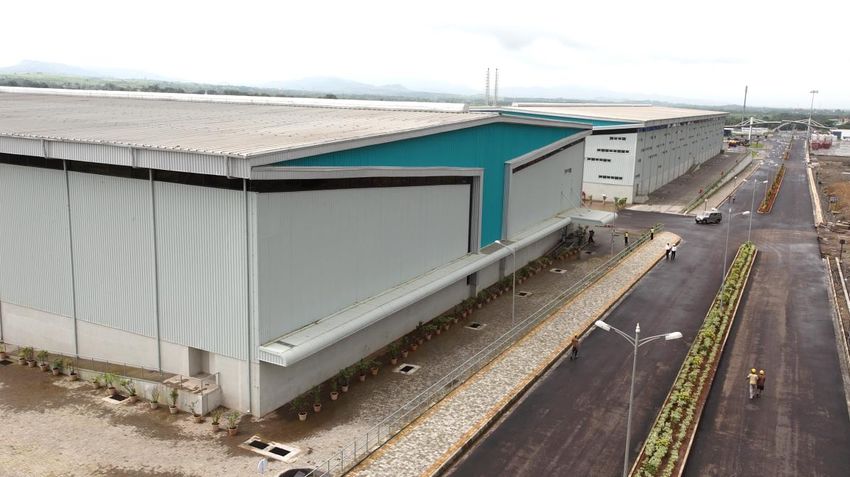
Key Safeguarding Provisions
Our structure
a-iTrust is a business trust that has voluntarily adopted the following SREIT restrictions:

Permissible investment                       Adheres to Property Fund Appendix’s definition of allowable investments

Investment restriction                       Invests at least 75% of the Trust property in income-producing real estate

Development limit                            20% of Trust property

Distributable income                         Minimum 90% to be distributed

Tax-exempt distributions                     Distributions exempt from Singapore tax

Gearing limit                                50%

                                                                                                                          8
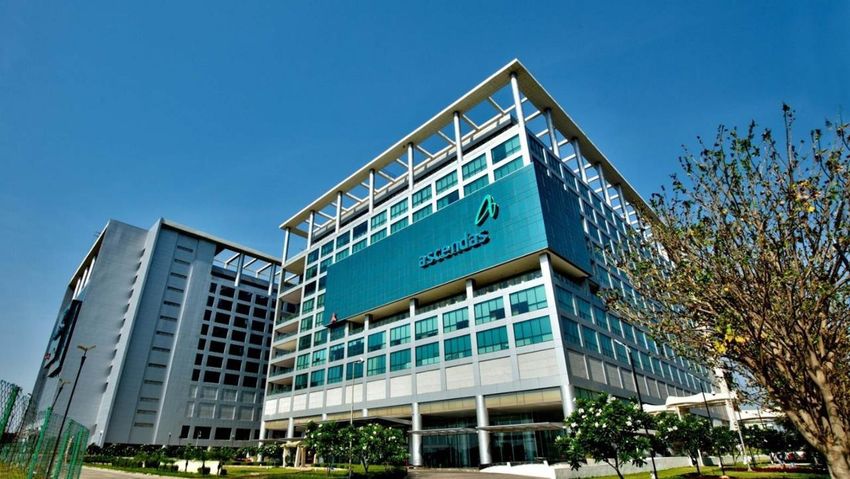
CapitaLand Limited
Our sponsor

•   CapitaLand is one of Asia’s largest diversified real estate
    groups, with assets under management of S$138.7 billion
    as at 30 June 2021.
•   CapitaLand’s portfolio spans across commercial, retail;
    business park, industrial and logistics; integrated
    development, urban development; as well as lodging
    and residential.
•   It manages six listed REITs and business trusts, as well as
    over 20 private funds.
•   CapitaLand has presence across more than 250 cities in
    over 30 countries, including Singapore, China, India,
    Vietnam, Australia, Europe and the USA.

                                                                  Capital Tower, Singapore

                                                                                             9
1H FY2021 Results
                                             1H FY2021   1H FY2020   Variance
                                                                                • Higher due to income contribution from
 SGD/INR FX rate1                              55.0        52.5        4.8%
                                                                                  Endeavour building at Bangalore and
                                                                                  aVance 6 building at Hyderabad;
                                             ₹5,246m     ₹5,199m        1%      • partially offset by lower portfolio
 Total property income
                                             S$95.4m     S$99.0m       (4%)       occupancy, lower utilities and carpark
                                                                                  income due to COVID-19.
                                             ₹4,251m     ₹3,861m       10%
 Net property income                                                            • Increase due to lower operations,
                                             S$77.3m     S$73.5m       5%
                                                                                  maintenance and utilities expenses; and
                                                                                • reversal of expected credit loss.
                                             ₹2,957m     ₹3,101m       (5%)
 Income available for distribution                                              • Mainly due to reversal of DDT provision in
                                             S$53.8m     S$59.0m       (9%)
                                                                                  1H FY2020;
                                                                                • partially offset by higher interest income
                                             ₹2,661m     ₹2,791m       (5%)       from investments in forward purchase
 Income to be distributed
                                             S$48.4m     S$53.1m       (9%)       projects.

                                               ₹2.31       ₹2.44       (5%)
 Income to be distributed (DPU2)
                                               4.20¢       4.64¢       (9%)     • After retaining 10% of income available
                                                                                  for distribution.
 Weighted average number of units
                                             1,151,014   1,145,365     0.5%
 (‘000)

1.   Average exchange rate for the period.
2.   Distribution per unit.
                                                                                                                            10
Consistent Growth
Our INR financial performance
INR million
10,188 10,250
Total property income 9,336
8,626
7,220
6,124 6,579
5,584
10% CAGR 4,658
5,550
4,078
CY2010 CY2011 CY2012 CY2013 CY2014 CY2015 CY2016 CY2017 CY2018 CY2019 CY2020
INR million
7,668 7,910
6,791
5,827
Net property income
4,790
4,249
3,654
3,197 3,260
13% CAGR 2,391 2,628
CY2010 CY2011 CY2012 CY2013 CY2014 CY2015 CY2016 CY2017 CY2018 CY2019 CY2020
11Consistent Growth
Our SGD financial performance
S$ million
197.6 191.7
183.0 184.0
Total property income
141.1 148.4
129.9 127.3
121.3 124.4 119.8
5% CAGR
CY2010 CY2011 CY2012 CY2013 CY2014 CY2015 CY2016 CY2017 CY2018 CY2019 CY2020
S$ million 148.6 147.9
133.8
123.6
Net property income
98.4
91.1
71.1 74.9 69.8 75.9
70.1
8% CAGR
CY2010 CY2011 CY2012 CY2013 CY2014 CY2015 CY2016 CY2017 CY2018 CY2019 CY2020
12Half-yearly DPU since Listing
INR/SGD exchange rate2
DPU1 (S¢) (Indexed)
12.00 Change since listing 130
INR depreciation against SGD: -52%
SGD DPU3: +53% 120
10.00
110
8.00 100
90
6.00
80
4.00 70
60
2.00
50
0.00 40
CY2007 CY2008 CY2009 CY2010 CY2011 CY2012 CY2013 CY2014 CY2015 CY2016 CY2017 CY2018 CY2019 CY2020 CY2021
1H 2H INR/SGD exchange rate
1. DPU (income available for distribution) refers to 100% of distributable income. 10% of distributable income was retained starting from 2Q CY2012.
2. Average daily spot INR/SGD exchange rate for the period, pegged to 1 August 2007 using data sourced from Bloomberg. 13
3. Last 12 months DPU compared against first 12 months DPU.Market Review
Global IT Powerhouse
India’s IT industry
                              Largest global IT                                                                                           Most cost competitive
                            sourcing destination1                                                                                        IT sourcing destination2

                                                                                                                                                  IT engineer’s salary
                                                                           India
                                                                            55%

                                                                                                                                                                  2 IT engineers in Singapore

                                                                                                                                      The salary of
             Rest of                                                                                                                1 IT engineer in
           the world                                                                                                                      USA
                                                                                                                                    is equivalent to              12 IT engineers in India
              45%

1.   Source: India Brand Equity Foundation.
2.   Source: June 2021 median salary from PayScale (provider of global online compensation data), converted into USD from local currencies using exchange rate from Bloomberg (30 June 2021).
                                                                                                                                                                                                15
IT Services Growth
Growth remains strong over the medium term
Global IT services spending growth
• Worldwide IT spending projected to increase to reach US$4.2 trillion in 2021, an increase forecast (%)
of 8.6% from 2020; India IT spending expected to grow 8% to reach US$92.7billion in 2021.
8 7.8 8 8
7.5
• Demand is witnessing a rapid recovery from firms across sectors looking to invest in their 7.2
digital transformation journey, with IT services among top three highest growth areas in
2021 due to boost in Infrastructure-as-a-Service (IaaS) spending. 5.7
• In the June 2021 quarter, Indian IT companies’ sequential revenue growth has been 3.9 4.1
broad based across verticals, geographies, service lines and across clients and healthy
deal win momentum continues despite COVID-19 situation. High net headcount
additions by both Tier-1 and mid-tier IT companies in these few quarters coupled with 1.7
increase in subcontractor usage and strong hiring outlook further indicates robust
demand expectations.
• Major Indian IT players report growth in earnings and continue to expand.
❑ TCS, Infosys, and Wipro reported year-on-year growth of more than 20% for the
quarter ended June 2021. World IT services spending growth (%)
❑ TCS headcount crosses 500,000 as at June 2021; while TCS, Infosys, and Wipro to
hire a total of 100,000 fresh graduates in the coming year.
Sources: Gartner (July 2021); Kotak Institutional Equities Research (Aug 2021) 16Office Markets Update
Bangalore (Whitefield) Hyderabad (IT Corridor I1)
16.3%
5.0 3.0
13.7%
4.0
8.9% 9.7% 2.0
3.0
7.6%
7.2%
2.0 6.2% 5.7%
5.1%
1.0
1.0 2.6%
0.0 0.0
CY 2017 CY 2018 CY 2019 CY 2020 YTD CY 2021 CY 2017 CY 2018 CY 2019 CY 2020 YTD CY 2021
Chennai (OMR) Pune (Hinjawadi) 17.7%
3.0 15.8% 2.0
13.8%
12.0%
2.0
1.0 8.6%
5.8% 6.0% 6.3%
1.0 3.3%
3.3%
0.0 0.0
CY 2017 CY 2018 CY 2019 CY 2020 YTD CY 2021 CY 2017 CY 2018 CY 2019 CY 2020 YTD CY 2021
Supply (million sqft) Gross Absorption (million sqft) Vacancy (%)
Source: CBRE Research
17
1. Includes HITEC City and Madhapur.Operational
Review
International Tech Park HyderabadQuality Tenants
% of base % of base
Top 10 tenants rents Top 5 sub-tenants of Arshiya Panvel rents
1 Tata Consultancy Services 14% 1 UPL Limited 9%
2 Arshiya Panvel 7% 2 DHL Logistics 8%
3 Amazon 6% 3 ZTE Corporation 7%
4 Renault Nissan 4% 4 Borochemie (India) 5%
5 Applied Materials 3%
5 Rolex Logistics (CISCO) 4%
6 Bank of America 3%
7 Societe Generale 3%
8 Technicolor 2%
Top 10 tenants
9 UnitedHealth Group 2%
accounted for 45% of
10 Larsen & Toubro 2%
portfolio base rent
All information as at 30 June 2021
19Diversified Portfolio
Portfolio breakdown by base rental
Customer Base
Mumbai
7%
Total number of tenants 264
Pune
10%
Average space per tenant 48,216 sqft
Bangalore
35%
Largest tenant accounts for
14% of the portfolio base rent
Chennai
19%
Hyderabad
29%
All information as at 30 June 2021
20Diversified Tenant Base
Tenant core business & country of origin by base rental
Telco & Oil & Gas
Network 2%
2% Retail
Healthcare & 1% F&B 1 Argentina
Pharmaceutical Others Others
2% 2%
1% UK 1%
Singapore 3%
1%
2%
Automobile
4%
France
Design, Gaming 10%
and Media
6%
Electronics, IT, Software & USA
Semiconductor &
Engineering Tenant core Application
Development and
Country of 52%
7%
business Service Support
58%
origin
Logistics
7%
2
India
31%
Banking &
Financial Services
8%
All information as at 30 June 2021
1. Food & Beverage. 21
2. Comprises Indian companies with local and overseas operations.Portfolio Occupancy
Committed portfolio occupancy: 90%
100%
95% 96%
92% 92% 94% 92%
91% 91%
87%
84% 84%
81% 82%
72%
2
ITPB ITPC CyberVale aVance CyberPearl ITPH aVance Arshiya3
1
Hyderabad Pune Panvel
a-iTrust occupancy Market occupancy of peripheral area4
All information as at 30 June 2021
1. Includes the newly acquired aVance 6.
2. Excludes Mariner building in ITPH which is being vacated for redevelopment.
3. There are no comparable warehouses in the micro-market that the Arshiya Panvel warehouses are located in.
4. CBRE market report as at 30 June 2021. 22Rental Reversion1
Bangalore Chennai
2
Hyderabad Pune
25%
21%
20%
16% 15%
15%
12%
10%
8%
7%
5%
0%
ITPB ITPC aVance Hyderabad CyberPearl ITPH aVance Pune
All information as at 30 June 2021
1. Rental reversion for a lease is defined as the percentage change of the new effective gross rent over the preceding effective gross rent. Only new and renewed
long-term leases transacted within the last 12 months are included, which comprise 12% of the portfolio by SBA.
2. There was no transaction in CyberVale within the last 12 months. 23Spread-out Lease Expiry Profile
Weighted average lease term: Weighted average lease expiry:
6.6 years 3.5 years
Monthly base rent expiring
(INR mil)
300
Millions
36%
250
200
23%
150 19%
100 12% 11%
50
-
FY2021 FY2022 FY2023 FY2024 FY2025 & beyond
All information as at 30 June 2021
Note: Retention rate from 1July 2020 to 30 June 2021 was 45%. 24Capital
Management
International Tech Park, ChennaiCapital Management
Currency hedging strategy Funding strategy
Balance sheet • The Trustee-Manager’s approach to equity
raising is predicated on maintaining a strong
• Trustee-Manager does not hedge equity.
balance sheet by keeping the Trust’s gearing
• At least 50% of debt must be denominated in ratio at an appropriate level.
INR. • Trustee-Manager does not borrow INR loans
onshore in India as it costs less to hedge SGD
borrowings to INR-denominated borrowings
Income using cross-currency swaps and derivatives.
• Income is repatriated semi-annually from India
to Singapore. Income distribution policy
• Trustee-Manager locks in the income to be • To distribute at least 90% of its income available
repatriated by buying forward contracts on a for distribution.
monthly basis.
• a-iTrust retains 10% of its income available for
distribution to provide greater flexibility in
growing the Trust.
26Debt Maturity Profile
Hedging ratio
Effective borrowings: S$962 million INR: 65% SGD: 35%
S$ Million
184.4
165.2 81.3 0.0
164.9
82.5
97.5
79.7
47.0 42.2
17.0
1
FY2021 FY2022 FY2023 FY2024 FY2025 FY2026
SGD-denominated debt INR-denominated debt
All information as at 30 June 2021
1. Entire amount pertains to short-term revolving credit facilities.
27Capital Structure
Indicator As at 30 June 2021
Interest service coverage 3.9 times
(EBITDA/Interest expenses) (YTD FY2021)
Percentage of fixed rate debt 77%
Percentage of unsecured borrowings 100%
Gearing: 33%2
Effective weighted average cost of debt1 5.3%
Gearing limit 50%
Available debt headroom S$980 million
Cash and cash equivalent S$178 million
1. Based on borrowing ratio of 65% in INR and 35% in SGD as at 30 June 2021.
2. As at 30 June 2021, the effective borrowings to net asset ratio and total borrowings less cash and cash equivalent to net asset ratio is 70.8% and 59.6% respectively.
28Growth Strategy
International Tech Park ChennaiGood Growth Track Record
Total developments: Total acquisitions:
5.6 million sqft 5.4 million sqft
11%
Floor area (million sqft) CAGR
14.4
13.8
0.6
13.1
12.6 1 0.7
11.9 0.5
0.8
1.9
9.7
0.4
8.8 0.3
0.6
7.5 1.3
6.9 6.9
6.5 0.6
6.0 0.4 13.8
0.5 12.6 13.1
11.9
4.7 4.8 4.8 1.2
0.1 9.7
3.6 1.1 8.8
6.9 6.9 7.5
6.0 6.5
4.7 4.8 4.8
3.6 3.6
IPO Dec-07 Dec-08 Dec-09 Dec-10 Dec-11 Dec-12 Dec-13 Dec-14 Dec-15 Dec-16 Dec-17 Dec-18 Dec-19 Dec-20 Jun-21
Portfolio Development Acquisition
1. Includes reduction in floor area due to the demolition of Auriga building (0.2m sqft) in ITPH as part of the redevelopment. 30Clear Growth Strategy
• 3.1m sqft in Bangalore
Development
• 4.2m sqft in Hyderabad
pipeline
• 0.4m sqft in Chennai
• 2.3m sqft from CapitaLand
Sponsor assets
• Ascendas India Growth Programme
Growth • 1.2m sqft aVance Hyderabad
strategy
• 2.1m sqft aVance Business Hub 2
3rd party
• 1.4m sqft AURUM IT SEZ
acquisitions
• 1.8m sqft BlueRidge 3
• 1.7m sqft Gardencity1
• 2.8m sqft2 Arshiya Panvel warehouses
Logistics / • 3.9m sqft Arshiya Khurja warehouses
Industrial / • 0.4m sqft Casa Grande1
Data Centre • 0.6m sqft Data Centre Campus at Airoli, Navi Mumbai
• Ascendas-Firstspace platform
1. “Gardencity” refers to the IT park at Hebbal; “Casa Grande” refers to the industrial facility at Mahindra World City.
2. Includes a 7th warehouse under construction (0.3m sqft).
31Diversification to New Asset Classes
• Proactive diversification into logistics, industrial assets, and data centres
• New economy asset classes make a-iTrust’s portfolio more resilient
Existing Portfolio Committed Pipeline Existing Portfolio + Committed Pipeline
Portfolio breakdown by area (%) Portfolio breakdown by area (%) Portfolio breakdown by area (%)
DC
Logistics DC Industrial 1% Industrial
3% 4% Logistics 2%
6% Logistics
5%
5%
14.4 million 10.8 million 25.2 million
sqft sqft sqft
Business Business Business
Park Park Park
94% 88% 92%
32Outlook
International Tech Park BangaloreGrowth based on Committed Pipeline
Floor area
(million sqft)
30.0
25.2
25.0 75% 0.3
1.7 0.4
0.2 Data Centre at Navi Mumbai (Phase 1)
1
1.8 0.3 Gardencity
20.0 1
Casa Grande
2.1
1.2 Arshiya Khurja
1.4 Arshiya 7th warehouse
15.0
14.4 1.4 BlueRidge 3 - Phase 1 & 2
aVance A1 & A2
aVance 5
10.0
AURUM IT SEZ
ITPH redevelopment - Phase I
14.4 14.4
Portfolio
5.0
0.0
Jun-21 Growth pipeline
1. “Gardencity” refers to the IT park at Hebbal; “Casa Grande” refers to the industrial facility at Mahindra World City.
34Growth Pipeline
aVance Arshiya Arshiya Casa
aVance Business Hub 2 AURUM IT SEZ BlueRidge 3 Gardencity1
Hyderabad Panvel Khurja Grande1
TOTAL
7th
aVance 5 aVance A1 aVance A2 Building 1 Building 2 Phase 1 Phase 2 Project I Project II 1 warehouse Phase 1
warehouse
Floor area 1.16 1.05 1.05 0.60 0.80 1.41 0.43 1.26 0.39 0.33 0.19 0.42 9.09
(million sqft)
Time of 2H 2H 2024 Timeline OC5 2H 2H 2H 2H 2024 2H 2024 OC5 Upon 2H 2021 N.A.
completion2 2021 to be received 2021 2021 2023 received completion
finalised of CP5
Expected total ₹8.4b ₹14.0b ₹9.3b ₹9.8b ₹11.2b ₹3.2b ₹2.1b6 ₹1.0b6 ₹2.1b ₹61.1b
consideration3 (S$168m) (S$278m) (S$186m) (S$194m) (S$209m) (S$59m) (S$42m) (S$19m) (S$38m) (S$1,193m)
Amount ₹4.3b ₹0.5b4 ₹4.6b ₹4.2b ₹0.2b ₹0.2b ₹0.7b - ₹1.2b ₹15.9b
disbursed3 (S$86m) (S$10m) (S$91m) (S$83m) (S$4m) (S$3m) (S$14m) (S$22m) (S$313m)
Remaining ₹4.1b ₹13.5b ₹4.7b ₹5.6b ₹11.0b ₹3.0b ₹1.4b ₹1.0b ₹0.9b7 ₹45.2b
commitment3 (S$82m) (S$268m) (S$95m) (S$111m) (S$205m) (S$56m) (S$28m) (S$19m) (S$16m) (S$880m)
All information as at 30 June 2021
1. “Gardencity” refers to the IT park at Hebbal; “Casa Grande” refers to the industrial facility at Mahindra World City.
2. Refers to building completion. For Arshiya Khurja, completion refers to the acquisition of 1 Grade-A warehouse.
3. Based on exchange rate at the time of investment/announcement.
4. Excludes disbursement of ₹3.1 billion (S$58 million2) towards refinancing of loan taken by the vendor towards acquisition of additional land.
5. OC refers to occupancy certificate; CP refers to Conditions Precedent.
6. Net consideration after deduction of security deposit. 35
7. Funding for 0.02 million sqft in phase 2 (where a letter of intent has been signed with a tenant) will commence once certain conditions precedent have been met.Tan Choon Siang Chief Financial Officer Ascendas Property Fund Trustee Pte Ltd (Trustee-Manager of a-iTrust) Office: +65 6713 2888 Email: choonsiang.tan@a-iTrust.com Website: www.a-iTrust.com
Appendix
Glossary
Trust properties           : Total assets.

Derivative financial       : Includes cross currency swaps (entered to hedge SGD borrowings into INR), interest rate swaps, options and
instruments                  forward foreign exchange contracts.
DPU                        : Distribution per unit.

EBITDA                     : Earnings before interest expense, tax, depreciation & amortisation (excluding gains/losses from foreign
                             exchange translation and mark-to-market revaluation from settlement of loans).
Effective borrowings       : Calculated by adding/(deducting) derivative financial instruments liabilities/(assets) to/from gross borrowings,
                             including deferred consideration.
Gearing                    : Ratio of effective borrowings to the value of Trust properties.
ITES                       : Information Technology Enabled Services.
INR or ₹                   : Indian rupees.
SEZ                        : Special Economic Zone.
SGD or S$                  : Singapore dollars.
Super Built-up Area or SBA : Sum of the floor area enclosed within the walls, the area occupied by the walls, and the common areas such
                             as the lobbies, lift shafts, toilets and staircases of that property, and in respect of which rent is payable.

                                                                                                                                                37
Balance Sheet
As at 30 June 2021 INR SGD
Total assets ₹159.72 billion S$2,904 million
Total borrowings ₹54.29 billion S$987 million
Derivative financial instruments (₹1.39 billion) (S$25 million)
Effective borrowings1 ₹52.90 billion S$962 million
Long term receivables ₹18.98 billion S$345 million
Net asset value ₹60.50 per unit S$1.10 per unit
Adjusted net asset value2 ₹77.16 per unit S$1.40 per unit
1. Calculated by adding/(deducting) derivative financial instruments liabilities/(assets) to/from gross borrowings, including deferred consideration.
2. Excludes deferred income tax liabilities of ₹19.2 billion (S$347 million) on capital gains due to fair value revaluation of investment properties.
38Growth strategy
Development: ITPH redevelopment
Existing Master Plan (1.5m sqft) Proposed Master Plan (5.7m sqft)
MLCP
BLOCK E
Capella
Vega BLOCK D
Atria Atria
Phase I Phase I
BLOCK C
BLOCK B
Orion BLOCK A
Auditorium Auriga Mariner
Key Highlights
Redevelopment to increase the development potential, rejuvenate the existing park, and leverage strong demand
in Hyderabad:
• Net increase of 4.2m sqft of leasable area
• Development planned in multiple phases over the next 7 to 10 years
• Construction for Phase I has commenced and superstructure work is in progress
39Growth strategy
Development: ITPH redevelopment – Phase I
Artist’s impression
Name International Tech Park Hyderabad (ITPH) redevelopment – Phase I
Floor area 1.36m sqft
Superstructure work has commenced.
Development status
Completion expected by 2H 2022.
40Growth strategy
Development: Data Centre Campus, Navi
Mumbai
Artist’s impression
Name Navi Mumbai Data Centre – Phase I
Floor area 0.33m sqft
Site is under acquisition, expected to be concluded by end August 2021.
Development status Phase 1 (0.33m sqft) development to commence post transaction closing.
Total development potential (including Phase 2) is 0.58m sqft.
41Growth strategy
Sponsor: Assets in India
Sponsor presence1 International Tech Park, Pune
• All 4 phases of construction comprising 2.3
million sqft is completed and fully leased.
Gurgaon
Pune
Chennai
Private funds managed by sponsor
• Ascendas India Growth Programme
• Ascendas India Logistics Programme
1. Excludes a-iTrust properties.
42Growth strategy
3rd party: Acquisition Criteria for Commercial
Space
Target cities:
• Bangalore
• Chennai
• Hyderabad
• Pune
• Mumbai
• Delhi
• Gurgaon
Investment criteria:
• Location
• Tenancy profile
• Design
• Clean land title and land tenure
• Rental and capital growth prospects
• Opportunity to add value
43Growth strategy (3rd Party Forward Purchase)
IT Park: aVance Hyderabad
Acquisition details Investment details
Owned by a-iTrust
Property details
• aVance 1 – 4 with total floor area of 1.5 million sqft.
• On 2 March 2021, aVance 6 with leasable area of 0.64
million sqft was acquired.
Construction funding & forward purchase agreement of
aVance 5
• As at 30 June 2021, ₹4.3b (S$86m1) has been disbursed
towards the construction of aVance 5.
• aVance 5 is expected to complete in 2H 2021.
Location HITEC City, Hyderabad • Total consideration for aVance 5 is not expected to
Site area 25.7 acres/10.4 ha exceed ₹8.4b2 (S$168m1).
Floor area 2.14m sqft • 100% pre-committed to a leading US-based
Forward purchase of aVance 5 1.16m sqft healthcare MNC.
ROFR on (7), (8), (9) & (10) 1.16m sqft
1. Based on exchange rate of S$1 to INR 50.04.
2. Dependent on the leasing commitment at the time of acquisition. 44Growth strategy (3rd Party Forward Purchase)
IT Park: aVance Business Hub 2, Hyderabad
Acquisition details
Investment details – aVance A1 & A2
Property details Construction funding
• Total construction funding towards aVance A1 & A2:
Up to ₹8.0b (S$158m2).
• Construction completion timelines are to be finalised
depending on leasing demands.
• As at 30 June 2021, ₹0.5b (S$10m2) has been disbursed.
Forward purchase agreement
• Total consideration not expected to exceed ₹14.0b3
(S$278m2).
Location HITEC City, Hyderabad
Site area 14.4 acres/5.8 ha
Forward purchase of (A1) & (A2)1 2.10m sqft
Proposed acquisition of (A3) to (A5)1 2.44m sqft
1. Master Agreement executed for proposed acquisition of Vendor assets. The total leasable area of A1 to A5 has been reduced from 5.20 million sqft to 4.53 million sqft due to changes
in the Master Plan.
2. Based on exchange rate of S$1 to INR 50.44.
3. Dependent on the leasing commitment at the time of acquisition. 45Growth strategy (3rd Party Forward Purchase)
IT Park: AURUM IT SEZ, Navi Mumbai
Acquisition details Investment details
Construction funding
Property details
• Total construction funding towards Building 1 and Building
2: Up to ₹5.0b (S$100m1).
(3) (2)
• As at 30 June 2021, ₹4.6b (S$91m1) has been disbursed.
(1)
Forward purchase agreement
• Total consideration not expected to exceed ₹9.3b2
(S$186m1).
Buildings 1 & 2 (0.6 & 0.8 million sqft respectively)
• Building 1: Occupancy Certificate received; 55% pre-
Artist’s impression committed.
Location AURUM IT SEZ, Navi Mumbai
• Building 2: Expected completion in 2H 2021.
Site area 16.06 acres/6.50 ha
Forward purchase of (1) & (2) 1.40m sqft
Strategic location
• Marks entry into Navi Mumbai, an important market for
ROFR on (3) 1.13m sqft large MNCs.
• Located next to Thane-Belapur Expressway; close
1. Based on exchange rate of S$1 to INR 50.04.
proximity to the Ghansoli train station.
2. Dependent on the leasing commitment at the time of acquisition. 46Growth strategy (3rd Party Forward Purchase)
IT Park: BlueRidge 3, Pune
Acquisition details
Investment details – Phase 1 & Phase 2
Property details
Loan re-financing and balance land funding
• ₹0.6b (S$12m1) disbursed.
Construction funding
• Total construction funding towards Phase 1 & 2: Up to
₹5.6b (S$110m1).
• As at 30 June 2021, ₹3.6b (S$71m1) has been
disbursed.
Forward purchase agreement
Artist’s impression • Total consideration not expected to exceed ₹9.8b
Location Hinjawadi Phase 1, Pune (S$194m1).
Site area 10.45 acres/4.23 ha Phase 1 & 2 (1.4 & 0.4 million sqft respectively)
Forward purchase of (1) & (2) 1.84m sq ft • Phase 1: Expected completion in 2H 2021; 15% pre-
committed for long-term space.
• Phase 2: Expected completion in 2H 2023.
1. Based on exchange rate of S$1 to INR 50.48.
47Growth strategy (3rd Party Forward Purchase)
IT Park: Gardencity, Bangalore
Acquisition details
Investment details – Project I & Project II
Property details
Construction and additional funding
• Total construction funding towards Project I & II: Up to
₹8.3b (S$154m1).
• As at 30 June 2021, ₹0.4b (S$7m1) has been disbursed.
Forward purchase agreement
• Total consideration not expected to exceed ₹14.4b2
(S$268m1).
Project I & II (1.3 & 0.4 million sqft respectively)
• Project I: Expected completion in 2H 2024.
Artist’s impression
Location Hebbal, Bangalore • Project II: Expected completion in 2H 2024.
Site area 8.2 acres
Project I: 1.3m sqft
Forward purchase of (I) & (II)
Project II: 0.4m sqft
1. Based on exchange rate of S$1 to INR 53.75.
2. Dependent on the leasing commitment at the time of acquisition.
48Growth strategy
Logistics: Arshiya Panvel, Mumbai
Acquisition details – 6 operating warehouses
Property details Investment details
6 operating warehouses (0.83m sq ft)
• Acquired in February 2018.
• Upfront payment of ₹4.3b (S$91m2) and deferred
consideration of up to ₹1.0b (S$21m2) to be paid over
the next 4 years.
• As at 30 June 2021, ₹0.5b (S$11m2) deferred
consideration has been paid.
• Operating lease arrangement with vendor to lease-
back the warehouses for 6 years.
Location Panvel, near Mumbai Forward purchase agreement
Site area 24.5 acres/9.9 ha • Additional future development potential of at least
2.80m sqft1.
Floor area 0.83m sqft
• Right to provide co-financing of construction loan.
Forward purchase At least 2.80m sqft1 • Exclusive right to acquire all future warehouses.
1. Includes the 7th warehouse under construction (0.33 million sqft).
2. Based on an exchange rate of S$1 to INR 47.50. 49Growth strategy (3rd Party Forward Purchase)
Logistics: Arshiya Panvel, Mumbai
Acquisition details – additional 7th warehouse
Property details Investment details
Additional 7th warehouse (0.33 million sqft)
• In July 2019, a-iTrust has exercised its right under the
forward purchase agreement to extend
construction funding and finalise the acquisition
terms for an additional warehouse.
Construction funding
• Total construction funding: up to ₹0.7b (S$14m2).
• As at 30 June 2021, ₹0.7b (S$14m2) has been
disbursed.
Location Panvel, near Mumbai
Acquisition
Site area 24.5 acres/9.9 ha
• Total consideration not expected to exceed ₹2.1b
Floor area 0.33m sqft (S$42m2).
Forward purchase At least 2.80m sqft1 Master lease structure
• Operating lease arrangement with a subsidiary
company of the vendor to lease-back the
1. Includes the 7th warehouse under construction (0.33 million sqft). warehouse for 6 years.
2. Based on an exchange rate of S$1 to INR 51.00. 50Growth strategy (3rd Party Acquisition/Forward Purchase)
Logistics: Arshiya Khurja, NCR
Acquisition details Investment details
Property details
Share Purchase Agreement1
• Acquisition of 1 Grade-A warehouse (0.19m sqft)
• Upfront payment of ₹0.2b (S$5m2) and deferred
consideration of up to ₹0.7b (S$14m2) to be paid over
the next 4 years.
Lease Arrangement
• Operating lease arrangement with an affiliate of the
vendor to lease-back the warehouse for 6 years.
Framework Agreement
Location Khurja, NCR • Right to finance construction of future warehouses.
• Right to acquire another 2 existing warehouses (0.30m
Site area 4.5 acres/1.8 ha sqft) and future warehouses (approximately 3.55m
Floor area 0.19m sqft sqft).
Right to acquire 3.85m sqft Growing warehouse footprint in North India
• Transaction provides opportunity to expand our
warehousing presence to North India and further
1. Entered into with Arshiya Limited, the same vendor as Arshiya Panvel forward purchase deal.
Acquisition is subject to fulfilment of certain Conditions Precedent. diversify business parks portfolio.
2. Net of security deposit. Based on an exchange rate of S$1 to INR 51.30. 51Growth strategy (3rd Party Forward Purchase)
Industrial: Casa Grande – Phase 1, Chennai
Acquisition details
Investment details – Phase 1
Property details
Construction funding
• Total construction funding towards Phase 1: Up to
₹1.4b (S$25m1).
• As at 30 June 2021, ₹1.2b (S$22m1) has been
disbursed.
Forward purchase agreement
• Total consideration not expected to exceed ₹2.1b
(S$38m1).
Artist’s impression
Phase 1 (0.4 million sqft)
Location Mahindra World City, Chennai
• Expected completion by 2H 2021.
Site area 8.81 acres/3.57 ha
Forward purchase 0.42m sqft
• Fully pre-leased to Pegatron, a leading Taiwanese
contract electronics manufacturer.
1. Based on exchange rate of S$1 to INR 55.00. 52World-class IT and Logistics Parks
City Bangalore Chennai Hyderabad Pune Mumbai
• Intl Tech Park • Intl Tech Park • Intl Tech Park • aVance Pune • Arshiya Panvel
Property Bangalore Chennai Hyderabad warehouses
• CyberVale • CyberPearl
• aVance Hyderabad
Type IT Park IT Park IT Park IT Park Warehouse
68.3 acres 33.2 acres 51.2 acres1 5.4 acres 24.5 acres
Site area
27.6 ha 13.5 ha 20.5 ha1 2.2 ha 9.9 ha
Completed floor
5.2m sqft2 2.8m sqft 4.0m sqft2 1.5m sqft 0.8m sqft
area
Number of
12 6 12 3 6
buildings
Park population 55,000 21,600 38,000 13,100 -
Land bank
(development 3.1m sqft 0.4m sqft 4.2m sqft3 - -
potential)
1. Includes land not held by a-iTrust.
2. Only includes floor area owned by a-iTrust.
3. Includes buildings under construction and additional development potential.
53Lease Expiry Profile by Base Rental
FY2025
City FY2021 FY2022 FY2023 FY2024 Total
& beyond
Bangalore 5.1% 5.7% 1.5% 5.5% 17.4% 35.2%
Hyderabad 2.7% 11.2% 4.8% 3.0% 7.4% 29.1%
Chennai 3.9% 6.1% 4.0% 2.8% 2.3% 19.1%
Pune 0.0% 0.4% 0.4% 0.2% 8.4% 9.4%
Mumbai 0.0% 0.0% 0.0% 7.1% 0.0% 7.1%
Total 11.7% 23.5% 10.6% 18.6% 35.6% 100.0%
54a-iTrust Unit Price versus Major Indices
Indicator
(Indexed)
Trading yield
175 6.0%1
a-iTrust
(as at 30 June 2021)
FTSE STI Index Average daily trading
150 2,252,200 units
FTSE ST REIT Index
volume (YTD FY2021)
Bombay SE Realty Index
125 a-iTrust
INR/SGD FX rate
100
FTSE STI Index
FTSE ST REIT Index
75
50 INR/SGD FX Rate
25 Bombay SE
Realty Index
0
Dec 14
Dec 07
Dec 08
Dec 09
Dec 10
Dec 11
Dec 12
Dec 13
Dec 15
Dec 16
Dec 17
Dec 18
Dec 19
Dec 20
Jun 08
Jun 09
Jun 10
Jun 11
Jun 12
Jun 13
Jun 14
Jun 15
Jun 16
Jun 17
Jun 18
Jun 19
Jun 20
Jun 21
IPO
Source: Bloomberg
1. Trading yield based on annualised 1H FY2021 DPU of 8.40 Singapore cents at closing price of S$1.39 per unit as at 30 June 2021. 55Structure of Ascendas India Trust
Unitholders
Holding of units Distributions
Trustee’s fee & management fees
Ascendas Property Fund Trustee Pte. Ltd.
a-iTrust (the Trustee-Manager), a wholly owned subsidiary of
Acts on behalf of unitholders/ CapitaLand
Dividends, principal management services
100% ownership &
shareholder’s loan repayment
of shareholder’s loan
Singapore SPVs
1. Ascendas Property Fund (India) Pte. Ltd.
2. Ascendas Property Fund (FDI) Pte. Ltd.
Ownership of ordinary shares; Subscription to Fully &
Compulsory Convertible Debentures (“FCCD”) and Dividends on ordinary shares, proceeds from share buyback
Non-Convertible Debentures (“NCD”) & interest on FCCD and NCD Singapore
The VCUs India
• Ascendas Panvel FTWZ • Information Technology Park Limited (92.8% shareholding)2
Limited1 • Ascendas Information Technology Park Chennai Ltd. (89.0% shareholding)2
(100.0% shareholding) • Cyber Pearl Information Technology Park Private Limited (100.0% shareholding)
• VITP Private Limited (100.0% shareholding)
• Hyderabad Infratech Private Limited (100.0% shareholding)
• Avance-Atlas Infratech Private Limited (100.0% shareholding)
• Deccan Real Ventures Private Limited (100.0% shareholding)
• Phoenix IT Infrastructure India Private Limited (95.0% shareholding)3
Ownership Master rental income Ownership Net property income
The Properties Provides property
• Arshiya Panvel warehouses • ITPB • ITPH management services Ascendas Services
• ITPC • aVance Hyderabad (India) Private Limited
• CV • aVance Pune (the property manager)
• CP Property management fees
1. Entered into a master lease agreement with Arshiya Limited (“AL”) to lease back the warehouses to AL for a period of six years. AL will operate and manage the warehouses and pay pre-
agreed rentals.
2. Karnataka State Government holds 7.2% shareholding of ITPB & Tamil Nadu State Government holds 11.0% shareholding of ITPC. 56
3. Remaining 5.0% shareholding in PIIIPL is held by the Phoenix Group currently and will be acquired by a-iTrust at a later date.You can also read