New Jersey Coastal Community Resilience Demonstration Project - Pilot Communities: December 2010
←
→
Page content transcription
If your browser does not render page correctly, please read the page content below

New Jersey Coastal Community
Resilience Demonstration Project

           Pilot Communities:
             Cape May Point
               Little Silver
               Oceanport

            December 2010
New Jersey Coastal Community Resilience Demonstration Project Report
Ida Leigh Wood, Jenny Tirrito and Mariana Leckner

Project Partners
New Jersey Sea Grant Consortium
      (PI) Peter Rowe: prowe@njseagrant.org
           Jenny Tirrito

New Jersey Department of Environmental Protection, Office of Coastal Management
      Dorina Frizzera: dorina.frizzera@dep.state.nj.us
      Ida Leigh Wood (NOAA Coastal Management Fellow)

Monmouth University, Urban Coast Institute
     Tony MacDonald: amacdona@monmouth.edu
     Mariana Leckner: mariana@lecknerconsulting.com

Stevens Institute of Technology
       Jon Miller (NJSGC Coastal Processes Specialist): jmiller@stevens.edu

Acknowledgements
This publication is the result of work sponsored by New Jersey Sea Grant
with funds from the National Oceanic and Atmospheric Administration
(NOAA) Office of Sea Grant, U.S. Department of Commerce, under
NOAA grant number NA10OAR4170075 and New Jersey Sea Grant
Consortium. The statements, findings, conclusions, and recommendations
are those of the author(s) and do not necessarily reflect the views of New
Jersey Sea Grant or the U.S Department of Commerce. NJSG-10-787.

Images: Ida Leigh Wood, Jenny Tirrito and Brian Harris

 New Jersey Coastal Community Resilience Demonstration Project                    2
Contents
New Jersey Coastal Community Resilience Demonstration Project ............................................................ 1
   Project Partners ........................................................................................................................................ 2
   Acknowledgements ................................................................................................................................... 2
Contents ........................................................................................................................................................ 3
   Table of Maps ........................................................................................................................................... 4
Introduction ................................................................................................................................................... 5
   Background of the Problem....................................................................................................................... 5
   Project Scope ............................................................................................................................................ 6
   Project Phases .......................................................................................................................................... 6
   Related Work in the State and Region...................................................................................................... 7
   Community Descriptions ........................................................................................................................... 8
Methodology................................................................................................................................................ 10
   Outreach Phases .................................................................................................................................... 10
   Vulnerability Mapping.............................................................................................................................. 11
   Getting to Resilience Questionnaire ....................................................................................................... 13
Coastal Community Outreach and Assessments ....................................................................................... 14
Borough of Cape May Point ........................................................................................................................ 15
   Vulnerability Assessment ........................................................................................................................ 16
       Built Environment ................................................................................................................................ 20
       Natural Environment ........................................................................................................................... 22
       Social Vulnerability.............................................................................................................................. 23
       Coastal Vulnerability Index.................................................................................................................. 24
       Sea Level Rise Vulnerability ............................................................................................................... 26
   Getting to Resilience ............................................................................................................................... 29
   Cape May Point Findings & Recommendations ..................................................................................... 30
Borough of Little Silver ................................................................................................................................ 32
   Vulnerability Assessment ........................................................................................................................ 33
       Built Environment ................................................................................................................................ 37
       Natural Environment ........................................................................................................................... 39
       Social Vulnerability.............................................................................................................................. 40
       Coastal Vulnerability Index.................................................................................................................. 41
       Sea Level Rise Vulnerability ............................................................................................................... 43
   Getting to Resilience ............................................................................................................................... 46

   New Jersey Coastal Community Resilience Demonstration Project                                                                                                 3
Little Silver Findings & Recommendations ............................................................................................. 47
Borough of Oceanport................................................................................................................................. 49
Vulnerability Assessment ........................................................................................................................ 50
Built Environment ................................................................................................................................ 54
Natural Environment ........................................................................................................................... 56
Social Vulnerability.............................................................................................................................. 57
Coastal Vulnerability Index.................................................................................................................. 58
Sea Level Rise Vulnerability ............................................................................................................... 60
Getting to Resilience ............................................................................................................................... 63
Oceanport Findings & Recommendations .............................................................................................. 64
Outreach Findings and Recommendations................................................................................................. 67
Works Cited................................................................................................................................................. 70
Table of Maps
Map 1: Pilot Communities ............................................................................................................................. 8
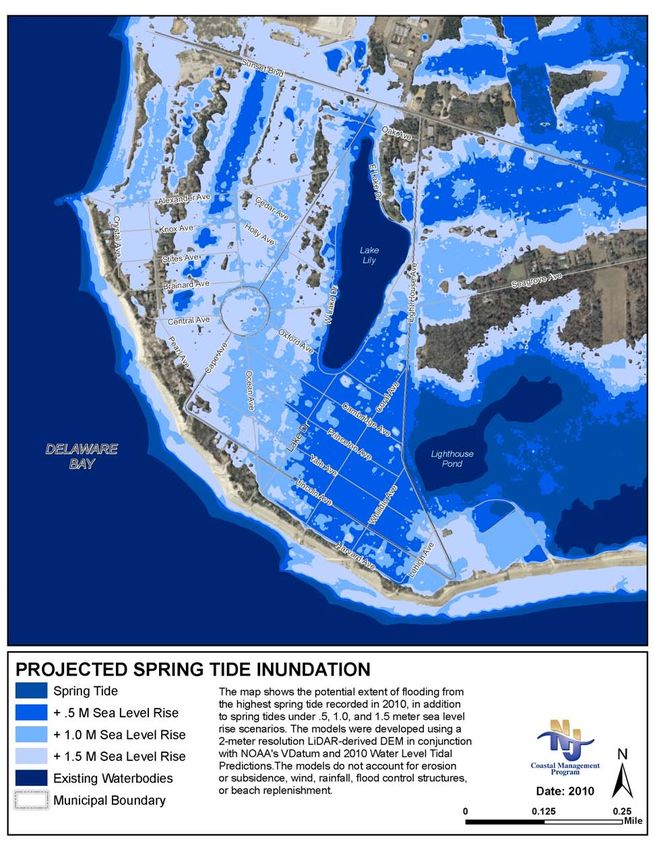
Map 2: Spring Tide Inundation, Cape May Point ........................................................................................ 18
Map 3: Storm Surge Inundation, Cape May Point ...................................................................................... 19
Map 4: Built Environment Inundation Vulnerability, Cape May Point ......................................................... 21
Map 5: Natural Environment and Inundation Vulnerability, Cape May Point.............................................. 22
Map 6: Social Vulnerability and Potential Inundation Exposure, Cape May Point...................................... 23
Map 7: Coastal Vulnerability Index, Cape May Point.................................................................................. 25
Map 8: Future Spring Tide Inundation, Cape May Point............................................................................. 27
Map 9: Coastal Vulnerability Change Due to Sea Level Rise, Cape May Point......................................... 28
Map 10: Storm Surge Inundation, Little Silver ............................................................................................ 36
Map 11: Built Environment Inundation Vulnerability, Little Silver................................................................ 38
Map 12: Natural Environment and Inundation Vulnerability, Little Silver.................................................... 39
Map 13: Social Vulnerability and Potential Inundation Exposure, Little Silver............................................ 40
Map 14: Coastal Vulnerability Index, Little Silver........................................................................................ 42
Map 15: Potential Sea Level Rise Inundation, Little Silver ......................................................................... 44
Map 16: Coastal Vulnerability Change Due to Sea Level Rise, Little Silver............................................... 45
Map 17: Storm Surge Inundation, Oceanport ............................................................................................. 53
Map 18: Built Environment Inundation Vulnerability, Oceanport ................................................................ 55
Map 19: Natural Environment and Inundation Vulnerability, Oceanport..................................................... 56
Map 20: Social Vulnerability and Potential Inundation Exposure, Oceanport ............................................ 57
Map 21: Coastal Vulnerability Index, Oceanport......................................................................................... 59
Map 22: Potential Sea Level Rise Inundation, Oceanport .......................................................................... 61
Map 23: Coastal Vulnerability Change Due to Sea Level Rise, Oceanport................................................ 62
New Jersey Coastal Community Resilience Demonstration Project 4
Introduction

Coastal communities across the nation are faced with the challenge of how to adapt to coastal
inundation associated with climate change and sea level rise. As part of the National Sea Grant
Coastal Communities Climate Adaptation Initiative (CCCAI), the New Jersey Sea Grant
Consortium (NJSGC) and its partners, New Jersey Department of Environmental Protection
Office of Coastal Management (NJOCM), Monmouth University Urban Coast Institute (UCI)
and Stevens Institute of Technology, conducted community-based, climate adaptation
demonstration projects in Cape May Point, Little Silver and Oceanport, New Jersey. The
objective of these projects was to provide the participating communities with an assessment of
their vulnerabilities to help local decision-makers identify opportunities to improve their
resiliency to coastal hazards and sea level rise. In order to accomplish this goal, virtual mapping
was used to illustrate the potential scenarios for coastal inundation along with facilitated
questionnaires that evaluated the communities’ existing planning strategies. The findings from
these tools were presented to the communities and are summarized in this report.

Background of the Problem
The scientific community has arrived at a strong consensus that global climate change is
occurring and resulting in changes to shoreline dynamics1. Climate change threatens to
accelerate sea level rise and increase the frequency and intensity of coastal storms. As a result,
citizens, development, and ecosystems will become more vulnerable to the impacts of coastal
hazards, making it imperative to identify areas where special needs communities, vital public
facilities and roads, and sensitive natural resources overlap areas of potential inundation. These
issues need to be considered as New Jersey’s coastal communities plan to become more resilient.

New Jersey is truly a coastal state with 127 miles of Atlantic coastline and 1,792 miles of tidal
shoreline, including Delaware Bay. Seventeen of twenty-one counties in New Jersey border
tidally-influenced estuarine or oceanic waters. Nearly 9 million people live within these coastal
counties, and these numbers increase dramatically during the summer months as people vacation
along the shore. New Jersey’s economy is highly dependent upon its marine and coastal
resources, which annually generate nearly $65.5 billion, with $39 billion generated through ports
commerce (Genevieve Boehm-Clifton, NJDOT, personal communication, December 15, 2010),
$22 billion through coastal tourism2 and $4.5 billion through recreational and commercial
fisheries and aquaculture.3

Historically, sea levels have risen approximately 0.4 meters (1.3 feet) in New Jersey since the
early 20th Century4. While such an increase appears to be minimal, low-lying areas are becoming

1
  The Parliament of the Commonwealth of Australia, Managing our Coastal Zone in a Changing Climate (October
2009). http://www.aph.gov.au/house/committee/ccwea/coastalzone/report/Final%20Report.pdf ,
New York State Sea Level Rise Task Force Report to the Legislature, Draft for Public Comment (November 2010).
http://www.dec.ny.gov/docs/administration_pdf/slrtdrpt.pdf
2
  IHS Global Insight, NJ Tourism: Holding Its Own During Difficult Times (2009).
http://www.visitnj.org/sites/visitnj.org/files/tourism-ecom-impact-2008.pdf
3
  State of New Jersey Department of Agriculture, New Jersey Fishing and Aquaculture: Harvesting the Garden
State’s Waters (2005). http://www.state.nj.us/seafood/seafoodreport.pdf
4
  NOAA. (2010). Sea Level Rise Trends. http://tidesandcurrents.noaa.gov/sltrends/
    New Jersey Coastal Community Resilience Demonstration Project                                           5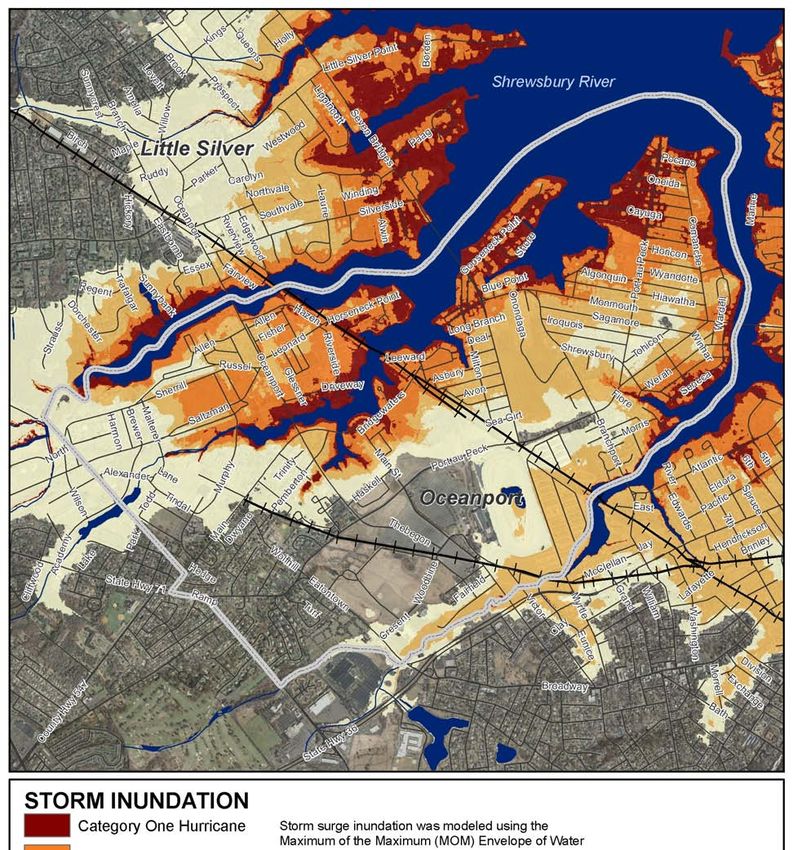
more susceptible to shallow coastal flooding and coastal erosion. Coastal communities need to
improve efforts to adapt to climate change but face hindrances such as political will, resource
scarcity, personnel availability or other institutional variables. To take action, resources, tools
and science-based information are needed to adequately plan for and address imminent impacts,
to make informed decisions to become resilient, and to collaborate for multi-disciplinary
planning. Local decision-makers often have the greatest capacity to influence the resiliency of
their community as they already address coastal flooding issues and protect the health, safety and
welfare of their constituents.

Project Scope
NJSGC piloted two innovative tools developed by the NJOCM: Coastal Community
Vulnerability Assessment Protocol (CCVAP) and Getting to Resilience to perform the virtual
mapping and questionnaire.

Coastal Community Vulnerability Assessment Protocol (CCVAP) is a GIS-based methodology to
assist land use planners, hazard mitigation planners, emergency managers, and other local
decision-makers in the identification of their community’s vulnerability through virtual mapping.
By applying the methods defined in CCVAP to the pilot communities, areas were identified
where built infrastructure, sensitive natural resources, and special needs populations overlapped
areas of potential inundation. This vulnerability mapping supports community efforts to make
the connection between the potential consequences of sea level rise and inundation to their
vulnerability – ultimately to guide the community for resilience planning.

Getting to Resilience is a questionnaire developed as a non-regulatory tool to help coastal
communities build capacity for resilience to coastal hazards and sea level rise. The application of
the survey was intended to highlight positive actions already underway within the pilot
communities and to identify opportunities to improve local resilience through planning, public
outreach, mitigation, and response mechanisms. This questionnaire validates the hazard planning
that the communities have begun to implement and identifies opportunities to incorporate
adaptation strategies in broader community planning.

Project Phases
The New Jersey Coastal Community Resilience Demonstration Project was conducted in three
phases as an integrated process of virtual mapping, plan reviews, collaborative meetings and
questionnaires.

   •   Phase 1: Initial meetings with the communities to review project objectives, identify
       known vulnerabilities and other relevant social, geographic and environmental factors,
       and review community plans

   •   Phase 2: Virtual mapping using Coastal Community Vulnerability Assessment Protocol to
       show vulnerable areas in the communities and presenting these results to the community
       leaders

  New Jersey Coastal Community Resilience Demonstration Project                                  6
•   Phase 3: Administration of Getting to Resilience questionnaire and final summary
       reporting and presentations to the communities

Related Work in the State and Region
The New Jersey Sea Grant Consortium built upon existing partnerships within the state to
provide outreach to coastal communities on their vulnerability to coastal hazards and sea level
rise. Partners in this project included:

    • NJSGC for coordination, presentations, summary reporting, and website outreach
    • Stevens Institute of Technology for support with mapping analysis and outreach to
      communities
    • Monmouth University, Urban Coast Institute for community engagement, coordination
      with mapping partners and refinement of Getting to Resilience questionnaire
    • NJDEP Office of Coastal Management for mapping, analysis and the development and
      implementation of the Getting to Resilience questionnaire

These coastal partners have worked on projects in coastal hazards and sea level rise, including
the acquisition of LiDAR in the state and the installation of tidal gauges for flood warnings.

The New Jersey Office of
Coastal Management
partially funded the use of
LiDAR technology in the
state to improve
inundation visualization.
Improvements in
elevation data and the
development of tools like
VDatum, which allows
GIS users to identify tidal
elevations, have greatly
improved the ability to
identify areas of potential
inundation under various
storm scenarios. It can
also be used to identify
potential sea level inundation scenarios, which can inform communities about how their
vulnerability to flooding may change over the course of the next century. The image above
demonstrates how elevation data has improved due to the use of LiDAR technology.

Monmouth University Urban Coast Institute and Stevens Institute of Technology have
previously worked with two of the pilot communities, Little Silver and Oceanport, to install tide
gauges on the Shrewsbury River and to identify impacts related to coastal flooding. The newly
developed Shrewsbury Early Flood Warning System is being used to provide flood height

 New Jersey Coastal Community Resilience Demonstration Project                                 7
information to constituents and emergency managers so that they may respond more quickly to
the threat of coastal flooding.

Community Descriptions
Although fourth smallest in area, New Jersey is the most densely populated state in the country.
It is also located within the New York-New Jersey Metropolitan area, one of the most highly
urbanized and industrialized regions in the nation. The health and management of New Jersey’s
coastal waters is coupled tightly to these demographics. However, there is a strong north-south
gradient from the urban north to the rural and agricultural south with coastal towns that support
the thriving tourism industry. Because the character of coastal communities varies throughout the
state, the NJSGC and its partners identified the opportunity to assess the hazard vulnerability and
resiliency of coastal communities with differing environmental, social, and infrastructure
composition. The boroughs of Cape May Point, Little Silver, and Oceanport were selected to
participate in the NJSGC’s Coastal Community Climate Adaptation Initiative due to their
willingness and history of dealing with similar challenges.

Cape May Point
The Borough of Cape May Point is located at the most southerly end of the Cape May peninsula
where the Delaware Bay meets the Atlantic Ocean. This small, residential resort community and
its surrounding areas have proven to be vulnerable to coastal erosion, storms, and saltwater
intrusion. The community has taken multiple strides to reduce the impacts of these hazards
through beach replenishment, the placement of offshore breakwaters, and the installation of a
stormwater pumping system. The community has also worked to protect habitat and vegetation
through a local landscape ordinance that reduces stormwater runoff. Because the community is
governed by a three-person commission, all of which lead efforts that influence community
resiliency, it proved to be difficult to meet in an informal setting. Municipal representatives
from the community’s environmental commission, emergency management, and planning board
informally participated in the pilot study to learn more about their vulnerability to coastal
hazards.

Little Silver and Oceanport
The Boroughs of Little Silver and Oceanport are located along the Shrewsbury River, which is a
tidal watercourse in the northern portion of Monmouth County that is fed by the Raritan Bay.
Both of these communities are nearly built out and are mainly residential with a smattering of
commercial uses. Fort Monmouth is located in the middle of these adjoining communities and
is slated for redevelopment after the base closes, presenting an opportunity for planning for
hazard resiliency. These communities are most susceptible to coastal storms and riverine
flooding, which is most prevalent during nor’easters when water levels can remain elevated for
days at a time, preventing water from draining. In order to protect the lives and property of local
residents, these municipalities have participated in the coordination efforts to install the
Shrewsbury River Flood Warning System (SRFWS). While these communities have taken
proactive steps to reduce their vulnerability to flooding, local and county decision-makers were
eager to participate in NJSGC’s pilot study. Community representatives from Monmouth
County Planning and Office of Emergency Management and municipal emergency managers and
environmental commissioners were engaged throughout the outreach process.

  New Jersey Coastal Community Resilience Demonstration Project                                  8

Map 1: Pilot Communities

New Jersey Coastal Community Resilience Demonstration Project   9
Methodology
The NJSGC and its partners worked with the boroughs of Cape May Point, Little Silver, and
Oceanport to explore coastal community vulnerability, hazard resilience, and opportunities for
climate adaptation on the municipal level. Through this project, the NJSGC piloted two
innovative tools developed by the NJOCM to further the state’s knowledge of coastal hazard
vulnerability. These tools include the Coastal Community Vulnerability Assessment Protocol
(CCVAP) and the Getting to Resilience questionnaire, both of which were developed through the
NOAA Coastal Zone Management Section 309 enhancement grant.

CCVAP is a GIS-based vulnerability assessment methodology developed to help local
governments understand their community’s vulnerability under present and future inundation
scenarios. While CCVAP provides communities with a visualization of local vulnerabilities to
inundation, the Getting to Resilience questionnaire was developed to help local governments
validate existing hazard planning efforts and identify opportunities to incorporate adaptation
strategies into local planning, public outreach, disaster preparedness, and mitigation efforts.
Through the combined application of the mapping visualization and the Getting to Resilience
questionnaire, the NJSGC and its partners intended to provide the pilot communities with a
strong knowledge base in coastal hazard and climate change vulnerability, building the case for
local governments to take proactive steps to improve their disaster and climate resilience.

While the NJSGC applied the NJOCM’s tools to just a few pilot communities in New Jersey, the
experience and knowledge gained through the application of these tools will assist in their
refinement prior to their widespread application throughout the state’s coastal zone. As these
tools continue to be applied, coastal municipalities will obtain the knowledge to move beyond
traditional planning and mitigation practices to improve local hazard and climate change
resilience.

Outreach Phases
The NJSGC and its partners met with local decision-makers and knowledgeable volunteers in a
focus group setting for a series of four meetings throughout the project. Each meeting was
intended to broaden participants’ understanding of their community’s vulnerability to coastal
inundation and to initiate a dialogue about disaster avoidance, resilience, and adaptation. The
timing of the municipal outreach meetings coincided with the completion of the research phases
of the project.

Meeting 1: The project team met with municipal representatives to introduce the purpose, goals,
and objectives of the Coastal Community Adaptation Initiative, along with the role of the project
partners and the participating municipality.

Meeting 2: A series of maps developed by the NJOCM to identify high hazard areas under
present and future inundation scenarios were presented to the pilot communities. The maps not
only represented current inundation threats of spring tides and hurricanes, they revealed how
projected sea level rise scenarios may augment the inundation extent of future spring tides and
hurricanes. By incorporating the inundation scenarios into a series of coastal vulnerability
 New Jersey Coastal Community Resilience Demonstration Project                                10
indexes, along with other natural variables, the NJOCM modeled how high hazard areas may
increase and move inland over the next century. These maps were shared with community
leaders to help them target future mitigation, public outreach, disaster preparedness, planning,
and zoning opportunities.

Meeting 3: The project team facilitated Getting to Resilience to a group of local representatives,
typically consisting of an emergency manager, planner, and environmental commission member.
The application of the Getting to Resilience questionnaire involved a thorough evaluation of
existing plans, public engagement, disaster preparedness, and mitigation projects in regards to
coastal hazards and sea level rise. By bringing community and county leaders to the table, the
participants were able to discuss current limitations and future opportunities to improve hazard
resilience.

Meeting 4: The final meetings with the pilot communities summarized the project team’s
findings, which were revealed through the application of the CCVAP methodology and the
Getting to Resilience questionnaire. During the final meetings, the project team identified
priority actions that the pilot communities may want to consider implementing in order to reduce
their vulnerability to coastal storms and to prepare for the onset effects of sea level rise.

Vulnerability Mapping
Coastal Community Vulnerability Assessment
Protocol (CCVAP) is a GIS-based methodology
to assist land use planners, hazard mitigation
planners, emergency managers, and other local
decision-makers in the identification of their
community’s vulnerability to coastal hazards and
sea level rise. Based off of a number of existing
risk and vulnerability assessment
methodologies,5 CCVAP defines the necessary
steps to classify vulnerable land areas under
present and future inundation scenarios. The
vulnerability mapping was an iterative process
that required the development of multiple
inundation scenarios. Through the use of 2-3         Figure 1: Coastal Community Vulnerability
                                                     Assessment Protocol (DRAFT), NJOCM
meter resolution Light Detecting and Ranging
(LiDAR) elevation data and NOAA’s Vertical Datum Transformation Tool (VDatum),6 the
NJOCM developed geospatial models representing the extent of mean higher high water
(MHHW), storm surge, and sea level rise inundation for each pilot community. The inundation
scenarios were then fed into a coastal vulnerability index (CVI), which is a composite raster
overlay model that defines high hazard areas under present and future conditions using six
geospatial inputs, including storm surge inundation scenarios, low slopes, flood prone areas,
poorly drained soils, erosion prone areas, and geomorphology. By incorporating sea level rise

5
  Cutter, S.L.; Mitchell, J.T.; and M.S. Scott. (2000). NOAA: CSC. (1999); Thieler, E.R and E.S Hammar-Klose
(1999); Lennon et al (1996); Gornitz, V. M., Daniels, R. C., White, T. W., and Birdwell, K. R. (1994)
6
  NOAA. Vertical Datum Transformation Tool (VDatum). http://vdatum.noaa.gov/
    New Jersey Coastal Community Resilience Demonstration Project                                              11
scenarios into existing storm surge models, the NJOCM was able to visualize how climate
change may shift inundation and high hazard areas further inland overtime.
By applying the methods defined in CCVAP to the boroughs of Cape May Point, Little Silver,
and Oceanport, it was possible to identify where built infrastructure, sensitive natural resources,
and special needs populations intersect areas of potential storm surge and sea level rise
inundation. The NJOCM then mapped the built and natural features in and around areas of
potential inundation. To obtain a better understanding of the portions of the community that may
need assistance in the event of a coastal storm, the NJOCM developed a social vulnerability
index7 using socio-economic data available through the Census. Community representatives
assisted the NJSGC and its partners in the identification of these vulnerabilities by identifying
the built and natural environmental features and social characteristics that pertain to their
community.
Figure 2: Vulnerability Mapping Considerations Checklist
The pilot communities utilized this checklist to inform the NJOCM of vulnerabilities they were interested in having
assessed within their community.
By working with community leaders and local decision-makers to identify local vulnerabilities to
coastal hazards, the project team was able to bring to light the connection between local
decision-making, disaster resilience, and long-term sustainability. The NJSGC and its partners
shared the mapping with the pilot community representatives not only to inform them of their
vulnerabilities, but also with the anticipation to inform future planning and zoning, development
siting, and mitigation decisions.
7
Hazards & Vulnerability Research Institute. (2008). The SoVI Recipe. University of South Carolina.
http://webra.cas.sc.edu/hvri/docs/SoVIRecipe.pdf .
New Jersey Coastal Community Resilience Demonstration Project 12Getting to Resilience Questionnaire Getting to Resilience is a questionnaire developed by the NJOCM as a non-regulatory tool to help coastal communities build capacity for resilience to coastal hazards and sea level rise. The questionnaire was prepared by compiling the efforts of many academics, international and federal agencies, and planning practitioners in regards to land use plan development and design, hazard mitigation and planning, and coastal resilience. Getting to Resilience incorporates many of the key components of existing local government evaluation tools into a brief and easy to facilitate questionnaire. The questionnaire is divided into five sections: (1) Risk Figure 3: Getting to Resilience, NJOCM and Vulnerability Assessments, (2) Public Engagement, (3) Planning Integration, (4) Disaster Preparedness and Recovery, and (5) Hazard Mitigation Implementation. It highlights the importance of local plan integration and stresses the need for consistency among municipal building codes, ordinances, and zoning. The questionnaire also identifies the importance of linking localized risk and vulnerability assessments to land use planning, public expenditures, mitigation, and disaster preparedness and response because the responsibilities of limiting hazard exposure and reducing vulnerability to coastal hazards are dispersed among many local departments and offices. The following types of professionals were requested to be involved in the piloting of the tool on the municipal level: • Land Use Planners • Hazard Mitigation Planners • Floodplain Managers • Emergency Managers • Stormwater Managers • Natural Resource Planners In each pilot community, the questionnaire was facilitated in a focus group setting to initiate a dialogue among local decision-makers about coastal hazards, vulnerability, and community resilience. The application of the tool was intended to highlight positive actions already underway within the pilot communities and to identify opportunities to improve local resilience through existing planning, public outreach, mitigation, and response mechanisms. Over the course of approximately two hours, community leaders completed the portions of the questionnaire in which they were most familiar. The application of Getting to Resilience not only acted as a forum for discussing ways to improve resilience, it also gave NJSGC and its partners insight on ways that they could provide technical and educational assistance to coastal communities. The NJOCM intends to use its experience in piloting Getting to Resilience to improve the tool so that it may be applied ubiquitously throughout coastal communities in New Jersey. New Jersey Coastal Community Resilience Demonstration Project 13
Coastal Community Outreach
                                   and Assessments

New Jersey Coastal Community Resilience Demonstration Project   14
Borough of Cape May Point
Cape May Point is located at the most southerly point of Cape May peninsula where the
Delaware Bay meets the Atlantic Ocean. The community now known as Cape May Point was
founded as Sea Grove in 1875. Sea Grove transitioned from a resort community to a religious
retreat center. Today, Cape May Point is characterized as a quiet, residential shore community
and vacation destination. While the 191-acre community only has 241 year-round residents8,
Cape May Point contains 583 residential units9 and hosts nearly 2,500 residents during the
summer months.10 Because of Cape May Point’s historic nature, many of its homes date back to
the late 1800s to mid-1900s.11 The mixture of historic homes and modest cottages characterize
this quaint residential community which is nearly void of all other land uses. While Cape May
Point is not densely developed, the subdivision of existing properties or expansion of dwellings
could result in increased development in the community. Even so, Cape May Point’s year-round
population is only projected to increase to 280 by 2020.12
Cape May Point’s precarious position along
the New Jersey shore makes it subject to
beach erosion, coastal storms, flooding, and
saltwater intrusion into freshwater
resources. Since the majority of Cape May
Point lies within the 100-year floodplain and
most residential development sits 10 feet or
below in elevation (in relationship to mean
sea level), a Category 1 hurricane is a
significant threat to the community.
Historically, Cape May Point has
experienced the impacts of hurricanes,
tropical storms, and nor’easters. These Figure 4: Historic Shorelines near Cape May Point
episodic storm events, in addition to daily coastal processes, have resulted in extensive shoreline
change. Shoreline erosion and the impacts of the 1944 hurricane and 1950 nor’easter washed
away the former neighboring community of South Cape May. Periodically, bricks wash up on
the beaches of Cape May Point, a reminder of nature’s volatility.
Cape May County has been identified as the 6th most difficult county to evacuate in the
country.13 Cape May Point’s location, low-lying topography, and soil composition make it highly
vulnerable to coastal storms when compared to other portions of the New Jersey shore.
Recognizing the threat of coastal erosion, storms, flooding, and even saltwater intrusion, Cape
May Point has taken steps to reduce their vulnerability to these hazards. Despite municipal,
state, and federal efforts to reduce Cape May Point’s vulnerability, climate change and sea level
rise threaten to exacerbate the existing threat of coastal hazards.
8
American Factfinder, Census 2000
9
American Factfinder, Census 2000
10
Cape May Point Municipal Master Plan. (2007).
11
Cape May Point Municipal Master Plan. (2007).
12
Cape May County Comprehensive Plan. (2002).
13
Cape May County Disaster Preparedness Conference. (2010).
New Jersey Coastal Community Resilience Demonstration Project 15Cape May Point has experienced approximately 4 mm/year of sea level rise since 1965. If this
trend were extrapolated without the consideration of glacial and ice sheet melting, Cape May
Point would experience approximately 0.4 meters (16 inches) of sea level rise over the next
century. Unfortunately, sea level rise projections incorporating global climate trends indicate the
Delaware Estuary will experience
approximately 0.5 – 1.5 meters (20 – 60
inches) or greater of sea level rise by
2100.14 As climate change alters the
natural processes of the New Jersey
shore, Cape May Point will likely
experience increased rates of erosion
and saltwater intrusion, more frequent
flooding, and changes in and loss of
critical habitat, and changes in the
Figure 5: Cape May Point's Historic Sea Level Rise Trends
frequency and intensity of coastal
Source: NOAA. 2010. Sea Level Rise Trends
storms.
In order to obtain a better understanding of the vulnerabilities that presently threaten Cape May
Point, the Coastal Community Vulnerability Assessment Protocol and the Getting to Resilience
questionnaire were piloted in the community. By working with municipal leaders and volunteers,
the project team was able to assess the existing vulnerabilities within the community and identify
how high hazard areas may shift inland over time due to sea level rise. The partners used this
information to validate the hazard planning that the community has already begun to implement
and to identify opportunities to incorporate mitigation and adaptation strategies into broader
community planning to ensure the long-term resilience of Cape May Point.
Vulnerability Assessment
The New Jersey Sea Grant Consortium piloted NJOCM’s Coastal Community Vulnerability
Assessment Protocol in Cape May Point as part of the demonstration project. The application of
CCVAP not only validated the risk and vulnerability protocol, it allowed the partners to identify
infrastructure, natural resources, and vulnerable populations that may be exposed to storm surge
inundation and sea level rise. The application of the protocol also informed the partners of the
local government’s data and technical needs regarding coastal hazards and sea level rise.
By applying CCVAP, the New Jersey Office of Coastal Management developed multiple
inundation scenarios, including spring tide, storm surge, and sea level rise models. Two-meter
resolution, digital elevation models (DEMs) derived from LiDAR15 technology enhanced the
identification of inundation prone areas, helping to accurately map surges and sea level rise.
Elevation data was used in conjunction with the National Hurricane Center’s Sea, Lake, and
Overland Surges from Hurricanes (SLOSH)16 models and NOAA’s Vertical Datum
Transformation Tool (VDatum)17 to define the extent and depth of storm surge at a high tide.
14
Partnership for the Delaware Estuary. 2010. Climate Change and the Delaware Estuary. P. 6
15
Cape May County LiDAR (Light Detecting and Ranging) elevation data was funded by NOAA, FEMA, the New
Jersey Department of Environmental Protection, and the New Jersey Office of Coastal Management.
16
National Hurricane Center. SLOSH Model. http://www.nhc.noaa.gov/HAW2/english/surge/slosh.shtml
17
NOAA. 2010. Vertical Transformation Tool (VDatum). http://vdatum.noaa.gov
New Jersey Coastal Community Resilience Demonstration Project 16Figure 6: Elevation Data Improvements
The mapping revealed that Cape May Point does not presently experience flooding during spring
tides. It does, however, indicate that the majority of Cape May Point is susceptible to flooding
during a Category 1 hurricane and that the entire community will likely be inundated under a
Category 2 hurricane. While the presence of dunes and beach restoration activities will likely
dampen the impacts of a major coastal storm, Cape May Point remains susceptible to back-bay
flooding from low lying tidal creeks and marsh areas such as Higbee Beach Wildlife
Management Area and surges flowing from Cape Island Creek, located behind Cape May.
Higher intensity storms correlate with greater flood depths and greater areas of inundation. For a
storm traveling up the Delaware Bay at high tide, storm surge elevations may reach upwards of
14 feet without accounting for potential wave heights (see table below).18 In all cases, Sunset
Boulevard, Cape May Point’s only evacuation and reentry route, is expected to flood.
Table 1: Potential Water Depths (in feet)
CATEGORY HURRICANE
LOCATION SPRING TIDE ONE TWO THREE FOUR
Yale Avenue at Fire House 0 1.5 6.3 9.9 12.9
Cape Avenue at Pavilion Circle 0 1.1 6.4 10.0 12.9
East Lake Drive at Lighthouse Avenue 0 .9 6.0 9.5 12.3
Cape May Lighthouse 0 2.5 7.1 10.7 13.4
Sunset Boulevard at Higbee Beach WMA 0 2.8 8.3 11.9 14.6
18
Surge depths modeled with the National Hurricane Center’s SLOSH, two-meter resolution LiDAR, and NOAA’s
VDatum are accurate within ± (20 percent + approximately 1 foot).
New Jersey Coastal Community Resilience Demonstration Project 17Map 2: Spring Tide Inundation, Cape May Point New Jersey Coastal Community Resilience Demonstration Project 18
Map 3: Storm Surge Inundation, Cape May Point

New Jersey Coastal Community Resilience Demonstration Project   19
Built Environment
Cape May Point is comprised mainly of residential structures and churches. Many of these
structures date back to the late 1800s and early 1900s and were not built to withstand a major
flooding event. Luckily, Cape May Point has never been directly hit by a hurricane, even though
it has experienced the flooding due to nor’easters and large snowfalls. Unfortunately, the
majority of the community is susceptible to storm surge inundation of a Category 1 hurricane,
and the entire community will likely be submerged under a Category 2 storm. The destruction
resulting from a hurricane or major nor’easter could have an immense impact on the community.
Failing to install flood vents, elevate low-lying homes, and install proper window protection
could threaten historically significant structures, community character, and public safety.
Knowing this, existing and new development should be retrofitted or designed to withstand
hurricane wind and flood impacts; otherwise, homeowners should be prepared to rebuild or
relocate when a major storm impacts Cape May Point. Unquestionably, residents should always
evacuate when a hurricane is approaching the Cape May peninsula.

Table 2: Potential Spring Tide and Hurricane Inundation versus the Built Environment
                                                         SPRING           CATEGORY HURRICANE
PROPERTY                                                   TIDE      ONE       TWO   THREE FOUR
1. Municipal Building                                        -          -        X     X     X
2. Fire House                                                -          X        X     X     X
3. Post Office                                               -          X        X     X     X
4. Fire Siren and Sewage Pumping Station (1)                 -          X        X     X     X
5. Sewage Pumping Station (2)                                -          X        X     X     X
6. Stormwater Pumping Station                                -          X        X     X     X
7. Water Tower & Future Public Works Barn                    -          -        X     X     X
8. Public Works                                              -          -        X     X     X
9. Wastewater Treatment Plant & Verizon Cell Tower           -          -        X     X     X
10. Beadle Presbyterian Church                               -          -        X     X     X
11. St. Agnes Mission Church                                 -          X        X     X     X
12. Union Chapel                                             -          -        X     X     X
13. Marianist Family Retreat Center                          -          X        X     X     X
14. St. Peter’s By the Sea                                   -          X        X     X     X
15. St. Mary’s By the Sea                                    -          X        X     X     X
16. General Store                                            -          X        X     X     X
17. Sunset Beach Businesses                                  -          -        X     X     X
18. Cape May Bird Observatory                                -          -         -    X     X
19. Cape May Lighthouse                                      -          X        X     X     X
Historic Properties 1875-1900 (69 total)                     -         48        69    69    69
Historic Properties 1901-1955 (133 total)                    -        113       130   133   133
TOTAL PARCELS (906 total)                                    -        757       903   906   906

 New Jersey Coastal Community Resilience Demonstration Project                              20
Map 4: Built Environment Inundation Vulnerability, Cape May Point New Jersey Coastal Community Resilience Demonstration Project 21
Natural Environment
Cape May Point, Cape May Point State Park, Cape May Migratory Bird Refuge, and surrounding
salt and freshwater wetlands all provide significant habitat for wildlife. Cape May Point and the
surrounding areas are a well known stopover location for migratory birds, and the beaches of the
Delaware Bay are one of the most significant spawning grounds for horseshoe crabs in the world.
Dragonflies and monarch butterflies also use Cape May Point as a stopover location during their
migration. All of these species rely upon the diverse habitat available in Cape May Point,
including beaches, freshwater wetlands, and lush canopy. The vitality of these habitats have
previously been challenged, and recently, Cape May Point, the NJDEP Office of Coastal
Engineering, the US Army Corps of Engineers and other partners have worked to restore the
beaches of Cape May Point and the freshwater wetlands in Cape May Meadows. These
collaborative efforts will help reduce the rate at which these resources change or are lost, but will
require continuous efforts to maintain the condition of the habitat. Significant storms threaten to
disrupt, alter, or destroy existing habitats through erosion, saltwater intrusion, and high winds.
Map 5 represents the potential extent of storm surge in relationship to ecosystems in and around
Cape May Point. Accelerated rates of sea level rise will challenge the integrity of these natural
resources, which may alter or be lost over time.

 Map 5: Natural Environment and Inundation Vulnerability, Cape May Point

  New Jersey Coastal Community Resilience Demonstration Project                                   22
Social Vulnerability
Approximately, 240 residents live year round in the Borough of Cape May Point. The
community consists mainly of married retirees with no children. Residents are well-educated
and have a moderate to high income. The most vulnerable populations within the community
include elderly and disabled residents. In the event of a coastal storm, all residents will be
equally exposed to the impacts of flooding and should evacuate. In order to identify the location
of the most susceptible people to coastal storms and to identify the areas of the community to
focus evacuation assistance, the New Jersey Office of Coastal Management developed a social
vulnerability index for Cape May Point. Many of the socio-economic data inputs were only
available at the Census Block Group level, and the community’s low year-round residential
population qualified it for only one Census Block Group, limiting the ability to discern where the
most vulnerable populations in the community reside. Additionally, the Census does not account
for seasonal populations, which are perhaps the most vulnerable residents because they are not
aware of their geographic vulnerability, nor are they likely aware of the proper measures to
evacuate if a storm threatens the New Jersey shore. By applying the social vulnerability index in
a small, vacation community, it was determined that the social vulnerability index does not
adequately define the location of the most vulnerable residents in relationship to storm hazards at
this scale. Municipal leaders and emergency managers have a greater capability to identify the
individuals that may need evacuation or recovery assistance in the event of a storm.

 Map 6: Social Vulnerability and Potential Inundation Exposure, Cape May Point

  New Jersey Coastal Community Resilience Demonstration Project                                 23
Coastal Vulnerability Index
Inundation mapping can inform planners, emergency managers, and environmental leaders of the
potential exposure of built and natural resources and socio-economically vulnerable populations,
while a coastal vulnerability index (CVI) can inform local government of land areas that are the
most prone to the impacts of coastal hazards. The CVI is a composite, environmental constraint
model that incorporates six overarching inputs, including geomorphology, low slopes, flood
prone areas, storm surge scenarios, and poorly drained and erosion prone soils. While these
factors contribute to the vulnerability of coastal lands, other geospatial factors can be
incorporated into a coastal vulnerability index. By combining the available data sets, the CVI
revealed that the most hazard prone areas in and around Cape May Point include the freshwater
wetlands within Cape May Meadows and the beaches surrounding the community. These
vulnerable areas correspond with the National Flood Insurance Program’s designated V-zones
and lands within the Coastal Barrier Resource System, both of which are the most risk prone
areas within the NFIP.

 New Jersey Coastal Community Resilience Demonstration Project                               24
Map 7: Coastal Vulnerability Index, Cape May Point

New Jersey Coastal Community Resilience Demonstration Project   25
Sea Level Rise Vulnerability
Sea level rise is a highly likely threat to Cape May Point over the next century. Historically,
Cape May and the surrounding areas have experienced approximately 4 mm/year of sea level rise
since 1965. While 4 mm/year appears to be insignificant, if this trend were extrapolated into the
future, the peninsula of Cape May will experience 0.4 meters (16 inches) of sea level rise by
210019. Unfortunately, sea level rise in the Delaware Estuary is anticipated to increase 0.5 – 1.5
meters (20 – 60 inches) or greater by 2100 due to glacial and ice sheet melting20. Even under a
low scenario, over a third of the properties in Cape May Point will be susceptible to flooding
during a spring tide and Sunset Boulevard will be permanently inundated. If sea levels increase
by 1.0 meter, the extent of flooding during a spring tide will reflect the extent of inundation
during a present day, Category 1 hurricane. And under a 1.5 meter sea level rise scenario, nearly
all of the properties in the community will be inundated during a spring tide. The map on the
following page reveals the extent of future spring tides, highlighting the threat to Cape May
Point over the next century. Residential development and coastal habitats will be the first land
areas impacted by sea level rise and the future extent of spring tides. By adding sea level rise
into the storm surge scenarios of the coastal vulnerability index, Map 9 indicates how high
hazard areas may increase in size and shift inland over time. The beachfront and adjacent
freshwater wetlands appear to be very highly vulnerable to coastal hazards, while the majority of
Cape May Point becomes highly vulnerable over time. Understanding how the coastal landscape
may change due to sea level rise can inform future development and hazard mitigation decisions.

Table 3: Built Environment and Sea Level Rise Inundation
                                                       SPRING                 SEA LEVEL RISE (METERS)
PROPERTY                                                 TIDE                0.5        1.0       1.5
1. Municipal Building                                      -                  -       LAND         X
2. Fire House                                              -                  -          X         X
3. Post Office                                             -                  -          X         X
4. Fire Siren and Sewage Pumping Station (1)               -                  -          X         X
5. Sewage Pumping Station (2)                              -                  X          X         X
6. Stormwater Pumping Station                              -                  X          X         X
7. Water Tower & Future Public Works Barn                  -                  -          X         X
8. Public Works                                            -                  -          -         X
9. Wastewater Treatment Plant & Verizon Cell Tower         -                  -      PARTIAL    PARTIAL
10. Beadle Presbyterian Church                             -                  -          -         X
11. St. Agnes Mission Church                               -                  -          X         X
12. Union Chapel                                           -                  -          -         X
13. Marianist Family Retreat Center                        -                  -          X         X
14. St. Peter’s By the Sea                                 -                  -          X         X
15. St. Mary’s By the Sea                                  -                  -          X         X
16. General Store                                          -                  -          X         X
17. Sunset Beach Businesses                                -                  -          X         X
18. Cape May Bird Observatory                              -                  -          -         X
19. Cape May Lighthouse                                    -                  -          X         X
Historic Parcels developed from 1875-1900                  -                  7         26         65
Historic Parcels developed from 1901-1955                  -                 38         90        131
TOTAL PARCELS (906 Total)                                  -                 340       621        867

19
     NOAA. (2010). Sea Level Rise Trends. http://tidesandcurrents.noaa.gov/sltrends/
20
     Partnership for the Delaware Estuary. 2010. Climate Change and the Delaware Estuary. P. 6
     New Jersey Coastal Community Resilience Demonstration Project                                    26
Map 8: Future Spring Tide Inundation, Cape May Point New Jersey Coastal Community Resilience Demonstration Project 27
Map 9: Coastal Vulnerability Change Due to Sea Level Rise, Cape May Point

New Jersey Coastal Community Resilience Demonstration Project               28
Getting to Resilience
Cape May Point is governed by a three commission form of government, supported by a number
of volunteer organizations within the community. The commissioners and community leaders
are dedicated to taking proactive measures to protect the people and properties within the
community. Due to staffing constraints, Cape May Point informally participated in the
demonstration project. Community leaders from the environmental commission, emergency
management, and the planning board provided their knowledge of existing planning documents
and local initiatives to complete the Getting to Resilience questionnaire. Through the completion
of the questionnaire, the participants identified actions the community has taken to address their
vulnerability to coastal hazards and discussed future opportunities to continue to improve their
resilience to episodic storm events and gradual changes in the coastal environment. The
following are some of the highlights from the five-part questionnaire:

Risk and Vulnerability Assessments
   • The Cape May Point portion of the Cape May County Hazard Mitigation Plan identifies
       the threat and location of potential hazards, along with the existing planning and funding
       mechanisms to support hazard protection and mitigation.
   • State and federally funded beach and wetland restoration projects have required such
       assessments.
   • Beach erosion information is provided through New Jersey’s Beach Profile Network21
       maintained by Stewart Farrell, Director of the Coastal Research Center at Richard
       Stockton College.

Public Engagement
   • Municipal leaders provide homeowners with information on storm hazards, evacuation
       procedures, and the appropriate contents of emergency kits.
   • Storm and sea level rise education materials have been disseminated through mailers
       from the tax payers association.
   • Cape May Point’s “Ready” Program is available on the municipal website.
   • Information on the Community Rating System, flood hazards, and evacuation routes are
       also available on the municipal website.
   • Emergency managers are challenged by ways to educate and prepare vacationers on
       storm hazards and evacuation measures.

Planning Integration
   • Cape May Point’s Municipal Master Plan identifies coastal hazards as a threat to the
      community.
   • Cape May County’s Hazard Mitigation Plan identifies residential mitigation, stormwater
      management, wetland maintenance, and dune and beach restoration as actions to reduce
      community vulnerability to coastal hazards.
   • Landscape and Vegetation Plan requirement protects natural habitat to ensure wildlife
      and migration patterns are not threatened by development; in turn, the planning
      requirement limits future impervious coverage.

21
     Funded by New Jersey Shore Protection
     New Jersey Coastal Community Resilience Demonstration Project                             29
You can also read