Sustainability Report - 15 FY - International Sustainable Campus ...
←
→
Page content transcription
If your browser does not render page correctly, please read the page content below
FY
Sustainability Report                15

© Nanyang Technological University
2 NTU Sustainability Report FY2015
About this report                                                          4

Message from our President                                                 5

Key highlights                                                             6

About Nanyang Technological University                                     8

Sustainability at NTU                                                  12

Resource use and emissions                                             18

Campus operations                                                      30

Sustainability education and research                                  36

Community engagement                                                   44

GRI index                                                              58

                                        NTU Sustainability Report FY2015   3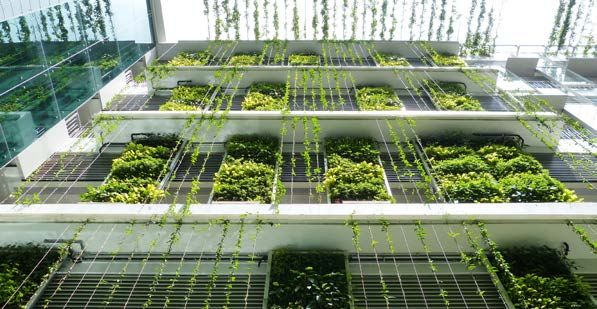
About this Report

In keeping with our ambition to become the                 sections of the report are based on the GRI G4
world’s greenest campus in the coming years, NTU           guidelines, we felt that the Sustainability Tracking,
Singapore is pleased to present our stakeholders           Assessment & Rating System (STARS), a set of
with the 2015 Sustainability Report. For us at NTU,        reporting standards developed by the Association
the release of this publication marks an important         for the Advancement of Sustainability in Higher
milestone in our sustainability journey, as not only       Education (AASHE), offered a more appropriate
is this our first sustainability report, but we are also   framework for us to report on material issues more
the first university in Singapore to accomplish such       specific to our university life, such as education
an undertaking. We hope to release a sustainability        and research.
report every year.
                                                           Although this report has not been externally
NTU’s 2015 Sustainability Report transcribes our           assured, we will look to do this for future
University’s sustainability efforts over the financial     sustainability reports. NTU is also in the
year from 1 April 2015 to 31 March 2016. This              continuous process of evaluating our data
year, we have grown further with the opening of            collection processes on the basis of their accuracy,
our Novena Campus, the Hive (a state-of-the-art            impartiality and transparency and look forward
learning hub) and two new buildings for the School         to sharing more of our sustainability journey with
of Medicine. Most of the data reported in this report      our stakeholders. A soft copy of the report can
is for the NTU main campus and inclusion of data for       be downloaded from the NTU website (www.ntu.
other campuses shall be sought for future reports.         edu.sg/AboutNTU/pages/sustainabilityreport.
                                                           aspx). Any queries or comments regarding our
For our inaugural report, we have chosen to report in      sustainability report can be addressed to Regula
accordance with the Global Reporting Initiative (GRI)      von Büren (ecocampus@ntu.edu.sg).
‘Core’ option.
                                                           Our stakeholders are also advised to read NTU’s
This report communicates our policies, practices,          Annual Report 2015, NTU At a Glance 2015 and
performance and targets in four key areas that             Sustainable Earth Peak Year 5 for a complete
are material to NTU. These aspects are detailed            view of the University’s strategy, performance and
in the materiality assessment section. While some          prospects.

4   NTU Sustainability Report FY2015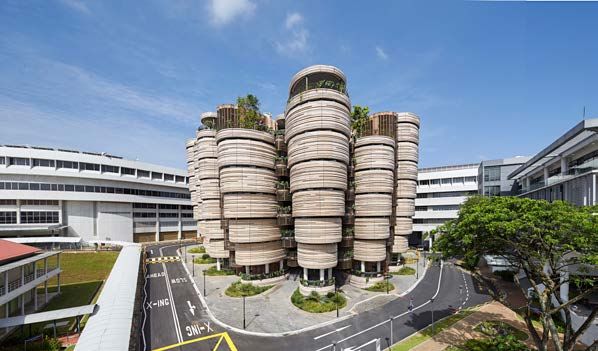
Professor Bertil Andersson
Message from our President                                                                              President
                                                                                  Nanyang Technological University

I am delighted to present NTU’s inaugural                  success in securing competitive grants of which more
Sustainability Report.                                     than a third is dedicated for sustainability research
                                                           projects. NTU’s mandatory sustainability course
NTU is a global university on a rapid rise. Ranked         provides all students with a basic understanding of the
13th in the world according to Quacquarelli Symonds        current environmental, social and economic challenges
(QS) university ranking 2015/16, it is also the world’s    and solutions facing Singapore and the world. Awards
top young elite university. Our international reputation   like the Excellence in Integration Award by the
and standing has enabled us to attract the best and        International Sustainable Campus Network (ISCN) are
brightest students. As a small island, Singapore           a motivating recognition of our efforts.
is facing challenges like limited alternative energy
options, limited local resources and transboundary         NTU aims to tackle complex sustainability issues like
issues like haze. We at NTU prepare our students to        clean energy, climate change or urbanisation with
be global citizens of the world and aspire to carry out    an integrated approach which includes participation
research that will improve our lives, environment and      from all colleges, schools, institutes and centres
benefit humanity as well its ecosystem.                    within NTU. Furthermore, industry collaborations are a
                                                           cornerstone for NTU to foster sustainable development
We have identified sustainable earth as one of its five    through the successful commercialisation of projects
major research thrusts. Sustainable Earth was already      from R&D to real life applications. As part of the
an integral part of NTU’s five year strategic plan 2015    EcoCampus Initiative, NTU’s 200-hectare campus
and continues to be the major focus of the current         and adjacent 50-hectare CleanTech Park are being
strategic plan 2020. Our vision is “Sustainapore,          transformed into a super test-bed for research projects
Greenest Campus in the world!”. We want to nurture         in cutting-edge green, clean and smart technologies.
leaders and develop and implement innovative               Collaborations with university networks like ISCN and
solutions to address some of the major sustainability      the Global Alliance of Technological Universities have
challenges facing Singapore and other cities in the        strengthened our sustainability efforts further.
world. The ambitious nature of our vision can provide
a speedy boost to NTU’s sustainability efforts. Our        Our first NTU sustainability report (which is in
goal to reduce energy intensity by 35% until 2020          accordance with the GRI) will support us in having
contributes to Singapore’s intention to reduce its         a better overview of our activities and shape our
emissions intensity by 36% by 2030 (as submitted           future plans and actions. As the report indicates,
to the United Nations Framework Convention on              NTU focuses on the four areas of resource use and
Climate Change Secretariat).                               emissions, campus operations, sustainable education
                                                           and research and community engagement. The overall
In FY15/16, NTU has managed to accomplish some             performance data indicates that we are on our way to
impressive achievements. We recently received the          reach most of our goals – for example to achieve 35%
first Green Mark PlatinumStar Champion Award by            reduction in energy intensity. To achieve our ambitious
Singapore’s Building and Construction Authority            goals, strategic focus is required for the next few years.
(BCA) for all our efforts done up to date – the highest    This aligns with our strategic plan NTU 2020. I am
accolade in Singapore for outstanding commitment           confident that we will reach our goals and make our
to sustainable building design. We have continuing         vision a reality.

                                                                                      NTU Sustainability Report FY2015   5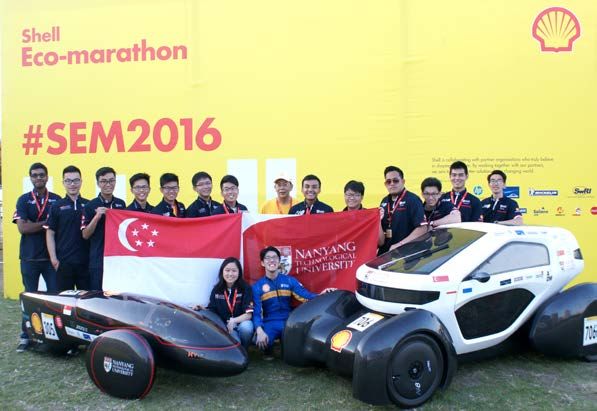
Key highlights
Reduced energy intensity
per sqm by 7% since 2011
Reduced waste intensity
per capita by 21% since 2011
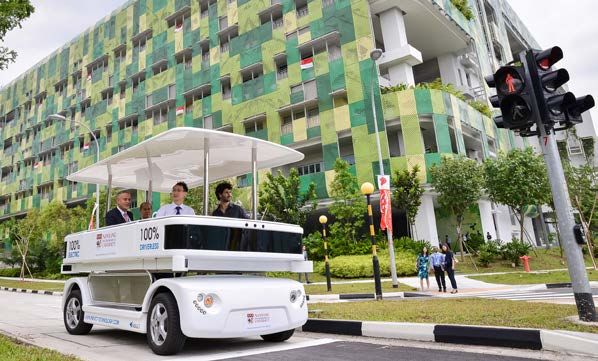
Trial of driverless electric shuttle
bus service for NTU employees
and students in FY15
Largest solar panel
installation in Singapore
18 Green Mark
Platinum buildings
as of 31 March 2016
Winner of the FY15
Singapore Environmental
Achievement Award
283 IPs and patents related to
sustainability and 24 start-ups
as of 31 March 2016
6 NTU Sustainability Report FY2015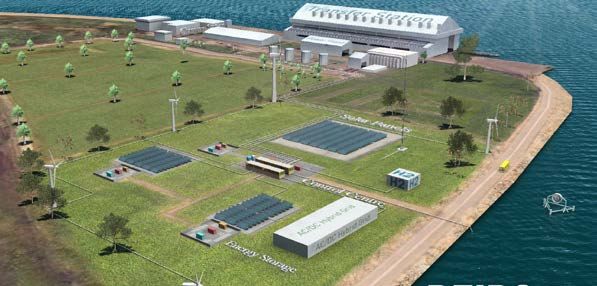
Sustainability awards

April 2015
BCA Universal Design
Mark Award
8 BCA Green Mark
Platinum Awards

June 2015
Excellence in Integration
Award, ISCN Sustainable
Campus Excellence Award

August 2015
Singapore Environment
Council – Singapore
Environmental
Achievement Award

January 2016
South West ECo Award

                            NTU Sustainability Report FY2015   7
About Nanyang Technological University

                                       Young and research-intensive, Nanyang Technological University
                                       (NTU Singapore) is ranked 13th globally. It is also placed
                                       1st amongst the world’s best young universities.

                                       The university has colleges of Engineering, Business, Science,
                                       Humanities, Arts and Social Sciences, and an Interdisciplinary
                                       Graduate School. It also has a medical school, Lee Kong Chian
                                       School of Medicine, set up jointly with Imperial College London.

                                       NTU is also home to world-class autonomous entities such
                                       as the National Institute of Education, S Rajaratnam School
                                       of International Studies, Earth Observatory of Singapore, and
                                       Singapore Centre on Environmental Life Sciences Engineering.

                                       In accordance with our well-designed curriculum backed by
                                       strong industry partnerships, we provide outstanding education
                                       to approximately 33,000 undergraduate and postgraduate
                                       students, which include medal winning Olympiads and high-
                                       performing scholars. We have over 4,547 faculty and researchers
                                       from 85 countries who enrich the NTU community with a range
                                       of cross-border perspectives and offer in-depth expertise across
                                       a variety of disciplines.

                                       Research in NTU is carried out within and across the colleges/
                                       schools and Research Centres of Excellence (RCEs). They
                                       are supported by 8 university-level research institutes with
                                       15 research centres under the institutes, 2 National Research
                                       Foundation (NRF) Corporate Labs, 60 research centres under
                                       the colleges/schools, and 24 joint centres with external
                                       organisations. NTU spearheads research into sustainability
                                       through the Energy Research Institute @ NTU (ERI@N),
                                       Nanyang Environment & Water Research Institute (NEWRI),
                                       Sustainable Earth Office (SEO) and EcoCampus Initiative.
                                       All activities are coordinated by Sustainable Earth Office (SEO).

8   NTU Sustainability Report FY2015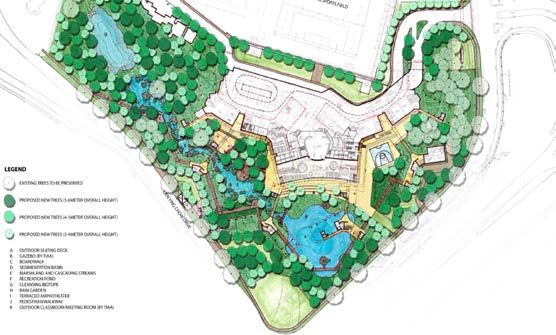
Photo Credit: Hufton and Crow

Memberships

NTU is a member, signatory or participant of many national
and international multi-stakeholder initiatives. These initiatives
enable us to leverage our influence and drive collective action on
sustainability. Engaging in partnerships is an important way to
share our knowledge and expertise and learn from others as well.
Some of the memberships we are active in are:

•   International Sustainable Campus Network (ISCN)
•   Association for the Advancement of Sustainability in Higher
    Education (AASHE)
•   Global Alliance of Technological Universities (GlobalTech)
•   Global Compact Network Singapore (GCNS)
•   Sustainable Energy Association of Singapore (SEAS)
•   Alliance for Research on Corporate Sustainability (ARCS)

                                              NTU Sustainability Report FY2015   9
Our NTU community                                                NTU has a Code of Conduct
                                                                                                         that expresses our commitment
                                        NTU is driven by a team of 7,307                                 to the ethical, professional and
                                        faculty, research, management                                    legal standards we use as the
                                        and support staff. All our                                       basis for our decisions and
                                        employees are employed under a                                   dealings inside and outside the
                                        permanent or temporary contract.                                 University. The University Cabinet
                                        NTU schools, research centres or                                 is responsible for upholding the
                                        departments may hire temporary                                   Code of Conduct. Members of
                                        (hourly paid) staff. These numbers                               the University community are
                                        are not captured in the NTU                                      also individually and collectively
                                        database. In future reports, NTU                                 responsible for upholding this
                                        aims to report on these numbers                                  Code. The Code of Conduct can
                                        as well. All eligible employees who                              be found on our NTU website and
                                        are bargainables are covered by                                  all our employees are expected to
                                        the Collective Agreement with the                                uphold the Code. New employees
                                        union. These comprise 17% of the                                 are asked to read the Code during
                                        total employee population of NTU.                                orientation.

                                                 100%

                                                                        444                    999
                                                   80%
                                                                                                                      669                   1125
                                                   60%

                                                   40%                  1216                  1888

                                                   20%                                                                438                    528

                                                     0%
                                                                      Faculty1             Research            Management                 Support

                                                                                                   Male         Female

                                        Figure 1. Total number of employees2
                                        1. Includes visiting faculty (115 in total, 101 males and 14 females). NTU also works with adjunct faculty who
                                           are not included in the figures above (303 in total, 239 males, 64 females).
                                        2. Total number of employees represent employees under permanent contracts. NTU defines permanent
                                           employees as employees that do not work on hourly rates. These employees may be under term contracts.

10   NTU Sustainability Report FY2015
As at 31 July 2015, NTU had 33,166 students.
25000 10000
20000 8000
4271 3940 4000 3908
11625 11743 11822
15000 12086 6000
10000 4000
11893 11741 11891 12214 2000 5197 5054 4986 4958
5000
0 0
Academic 2012 2013 2014 2015 Academic 2012 2013 2014 2015
Year Year
Male Female Male Female
Figure 2. Undergraduate Population by Gender Figure 3. Graduate Students Population by Gender
7000 3500
6000 3000
5000 2500
2949 3349 2981 2802 1266 1316 1382 1258
4000 2000
3000 1500
2000 1000
2967 3213 3098 2997 1662 1643 1651 1561
1000 500
0 0
2012 2013 2014 2015 2012 2013 2014 2015
Male Female Male Female
Figure 4. First Degree Graduate Output by Gender Figure 5. Higher Degree Graduate Output by Gender
NTU Sustainability Report FY2015 11Sustainability @ NTU
Sustainability is one of the core values of NTU. NTU aspires to be
the most sustainable university in the world, an ambition based on
Our vision and the grand challenges of the world and our objective to distinguish
mission goes ourselves academically. Our five-year strategic blueprint (NTU 2015)
labelled Sustainable Earth Peak as our “peak of peaks” amongst our
beyond the norm Five Peaks of Excellence, and this has been further reinforced in our
latest five-year strategic blueprint, NTU 2020. Throughout the past
of sustainability few years, NTU has leveraged our collection of academic expertise,
our high-tech facilities and our strong ties with industry to lead the
Vision: way in the development and implementation of a diverse range of
sustainability initiatives in Singapore. We have dedicated ourselves
Sustainapore, Greenest to the idea of a “living laboratory” on campus, and have set bold
Campus in the world! targets for our performance.
Mission:
Governance structure for sustainability
To nurture leaders, In 2011, NTU formalized the governance of sustainability with
the launch of Sustainable Earth @ NTU (SE@N). The Sustainable
develop and implement
Earth Office (SEO) aspires to make sustainability sustainable at
innovative solutions to
NTU. Sustainability in research, education, collaborative projects,
address some of the commercialisation, and outreach will thrive and endure if undertaken
major sustainability voluntarily by coalitions of the willing, enthusiastic, and most
challenges facing capable within a supportive administrative and departmental
Singapore and other environment. The SEO encourages collaboration between NTU’s
cities in the world. departments, divisions and offices and creates a sense of unity
towards NTU’s sustainability goals.
Our campus operations are managed by the Office of Development
and Facilities Management (ODFM) and the Office of Housing and
Auxiliary Services (HAS). The ODFM oversees all new development,
operation and maintenance of the University’s facilities and grounds
and is committed to creates a green & sustainable environment,
conducive for life-long learning and creativity. The HAS manages
NTU’s residential and auxiliary services.
12 NTU Sustainability Report FY2015NTU’s interdisciplinary research institutions such as ERI@N,
NEWRI and Earth Observatory of Singapore (EOS) contribute to
NTU’s sustainability efforts through ground-breaking research and
industry collaborations that bring new technology and ideas to life.
These institutions play a big role in establishing NTU as a leading
university that is committed to sustainability.
At the heart of NTU’s sustainability ambition is the EcoCampus
initiative, which was launched in 2014 to develop a novel campus-
wide sustainability framework. EcoCampus aims to be the leading
example for high impact energy efficiency and sustainability for
urban developments in Singapore. Led by the NTU Provost, the
EcoCampus Steering Committee provides strategic oversight for
the initiative. It also provides guidance to establish the development
of the requisite organisational structure and framework in alignment
with the programme’s overall mission, objectives and targets. The
Steering Committee’s members also include senior management
representatives from several public agencies in Singapore. Aiding
the Steering Committee is the EcoCampus technical review
committee, which provides technological and policy-related
perspectives that can enable holistic decision making.
NTU Sustainability Report FY2015 13NTU also has an informal network of student and staff
groups that help to promote the sustainability agenda in
NTU. Sustainability Officers are Management and Support
staff members who serve as contact points within the
individual schools and facilitate the conveyance of key
sustainability information to our students and employees.
Earthlink is a student-led group that aims to increase
the NTU community’s awareness on environmental
issues. They do this by creating opportunities for the
NTU community to make a positive difference for the
environment and are proactive in organising events and
campaigns to engage the NTU community.
14 NTU Sustainability Report FY2015Materiality assessment
NTU carried out a materiality assessment to determine the
aspects which are material to us and our stakeholders.
We utilised the GRI G4 Reporting Framework and STARS
guidelines, which is specifically for universities, as well as the
International Sustainable Campus Network/Global University
Leaders Forum Sustainable Campus Charter to develop a
global list of material topics. We also benchmarked ourselves
against other leading universities to identify other aspects
that they address in their reports.
A workshop was organised in mid-February 2015 at NTU
using this collection of topics as a base. Major stakeholders
were invited to evaluate the relative importance (low, medium
or high) of each topic from both the Stakeholder (external)
and the Business or Strategic Impacts (internal) viewpoints.
The Stakeholder view reflects the view of major stakeholders,
such as students, faculty and staff, donors and funding
agencies, business and industrial partners, the community
where NTU operates and others with a vested interest in
NTU and our success. The Business or Strategic Impacts
view refers to the impact of a topic on NTU’s capability to
fulfil our key objectives, namely supporting research and
providing education. Aspects that were deemed highly
important from both viewpoints were considered to be
“material” and incorporated into our sustainability roadmap
development and our reporting processes. Those that
have low importance from both perspectives are initially
considered to be immaterial. Those that were important from
only one perspective were evaluated and, depending on how
organisations generally report on sustainability-associated
topics, either included or excluded.
NTU Sustainability Report FY2015 15Table 1: An overview of the material aspects identified which are applicable for NTU’s operations
Strategic Material aspects Impact within Impact outside
sustainability pillar organisation organisation
Green campus ‑ • GHG emissions • All operations • Business
resource use • Energy community
• Water government
• Waste suppliers
Green campus ‑ • Transportation • All operations • Business
campus operations • Procurement community
• Green buildings government
suppliers
Sustainable curriculum • Education • All operations • Business
programmes community
• Research government
programmes
Community • Internal: • All operations • Local
engagement student, faculty community
and staff
engagement
• External: local
community
engagement
Stakeholder engagement
NTU’s sustainability strategy was developed after a series of comprehensive
surveys. A thorough landscape assessment of major higher education institutions
worldwide was first conducted. Subsequently, a materiality assessment whereby
stakeholders were consulted to identify the issues most pertinent to NTU and our
stakeholders was carried out. Finally, a collection of strategic foci and related
criteria for us to track our sustainability performance were selected.
Based on interviews with senior management, key stakeholders for NTU were
determined. In the years to come, NTU will continue to strive to enhance our
engagement with stakeholders through improving communication channels and
embedding stakeholder input into our strategy.
16 NTU Sustainability Report FY2015Stakeholder group Engagement goals Frequency of Means of engagement Concerns raised
engagement
Students We hope to provide Annual, Student Experience Degree Programme,
a conducive learning as required Survey, workshops, Campus Facilities,
environment and improve events, orientation Campus Life,
student satisfaction, while programmes Teaching etc
grooming a new generation
of leaders who understand
sustainability issues.
Faculty and staff We hope to recruit and Regular basis, Newsletters, Update Office comfort,
retain talented employees at least once from President’s Office, safety
by improving job a month Notice boards/digital
satisfaction, and generate displays
value for NTU by supporting
research projects.
Business community We hope to deepen industry As required Industry workshops, Collaboration
collaboration to foster meetings, campus/ opportunities,
learning and innovation. lab tours funding, research IP,
recruitement
Board of trustees We hope to improve At least 4 Board meetings, sub Overall development
governance at the university times a year, committee meetings, of NTU (driving
and develop roadmaps for as required retreat, informal for international
the future. meetings distinction as a
university of science
and technology),
Finance
Government We hope to align NTU’s As required Workshops, meetings Collaboration
sustainability strategy opportunities,
with national goals. funding, R&D
roadmap, curriculum
Suppliers We hope to source quality As required Limited engagement Business
products from sustainable through official protocols, opportunity,
suppliers. e.g. tenders commercial aspects
Affiliated universities / We hope to strengthen As required Research Partnerships, Collaboration
institutes partnerships and leverage joint phd/masters- opportunities,
expertise to enhance the programms, workshops, exchange
quality of our programmes. conferences opportunities
Residents We hope to enhance the Throughout Survey, email Living conditions,
well-being of residents on the semester, communication rental fees, transport
campus while decreasing as required arrangements, food
resource consumption & beverage
and wastage.
Parent community We hope to improve Annual, Open house, website, Rankings, donations,
parental satisfaction as required media articles, NTU fest tuition fees, quality
with our programmes. of education
Local community We hope to improve the Annual, Open house, website, Safety/noise, rental
well-being of the local as required media articles, NTU fest, opportunities,
community to cultivate tours community
social consciousness in engagement
students and employees.
Alumni We hope to foster life-long Annual, Newsletter, engagement Rankings, giving
relationships that creates as required activities like tours, back, networking
value for NTU and our events, workshops,
alumni. seminars
NTU Sustainability Report FY2015 17Resource use & emissions
NTU is committed to reducing our consumption of natural
resources and greenhouse gas (GHG) emissions. Our aim
is to maintain a campus that fosters a resource and energy
conservation culture that utilises innovative technologies.
We have identified our key material topics in this area as
being: Energy, GHG emissions, Water and Waste. The earth
has finite resources and we recognize that we have a role
to play in protecting the environment for future generations.
NTU proactively seeks new ways to reduce our resource
consumption and collaborates with industry experts to try
and achieve our goals.
Our 2020 goals
35% 35% 35% 35%
Reduction in Reduction in Reduction Reduction
energy GHG emissions in water in waste
intensity intensity consumption intensity
(per sqm) (Scope 2 only) intensity (per capita)
(per sqm)
18 NTU Sustainability Report FY2015Table 2: FY15 carbon emissions
Scope of emissions kg CO2e
Scope 1 41,405
Scope 2 91,890,181
Scope 3 15,826,928
*Note: 18 flights to Singapore (From Overseas) has been excluded.
Performance Air travel distance is taken into consideration as round trips. Data
excludes travel by LKCMedicine, RSIS and NTUitive.
780 0.7
760
Thousand GigaJoules (‘000GJ)
0.6
740
Energy intensity (GJ/per sqm)
0.5
720
700 0.4
680 0.3
660
0.2
640
0.1
620
600 0
FY11 FY12 FY13 FY14 FY15 FY11 FY12 FY13 FY14 FY15
Figure 6. Total energy consumption Figure 7. Energy intensity per square metre
21 100
Emissions intensity (kgCO2e/per sqm)
90
Energy intensity (GJ/per capita)
20 80
70
19
60
18 50
40
17 30
20
16
10
15 0
FY11 FY12 FY13 FY14 FY15 FY11 FY12 FY13 FY14 FY15
Figure 8. Energy intensity per capita Figure 9. Emissions intensity per square metre
3000
7%
Emissions intensity (kgCO2e/per capita)
2500
4%
2000 11%
NTU Academic Building
1500 Auxiliary and Common Services
Employee, Student and commercial residences
52%
1000 National Institute of Education
26% Commercial
500
0
FY11 FY12 FY13 FY14 FY15
Figure 10. Emissions intensity per capita Figure 11. Breakdown of energy consumption by building type for FY15
NTU Sustainability Report FY2015 19Energy & emissions
The management of energy reduction, efficiency and renewable
energy sources forms an important and conspicuous component
of NTU’s sustainability programme. We are committed to
achieving our target to reduce our energy intensity and emissions
intensity by 35% by 2020 and have undertaken several measures
such as collaborating with industry partners to test-bed new
energy efficiency technology and continuously updating our older
facilities and buildings. We also ensure that all our new buildings
are as energy-efficient as possible and commit to the highest
green building standards.
Performance
In FY15, NTU consumed a total of 766,944 GJ of energy. Although
absolute consumption has increased, the energy intensity ratio
per square metre has actually decreased by 7% since FY11.
This means that eventhough our gross floor area increased by
over 58,000m2 since FY14, we have been able to reduce the
amount of energy consumed per square metre.
Further analysis of our data has shown that more than 80% of the
energy consumed on campus was by the academic and auxiliary
buildings as well as the residences. NTU is committed to reducing
energy consumption wherever possible and has implemented
numerous energy conservation initiatives over the years. Some of
these include the adoption of high efficient chiller plant systems,
installing motion sensors for common areas, replacing existing
lighting to LEDs and installing electronic air cleaners to improve
AHU efficiency. The newly implemented in-line pumping for
domestic water transportation eliminates the need for transfer
tanks and reduces the transfer pump size by 80% for all buildings
in NTU.
We will continue to focus our efforts in reducing our energy
intensity to achieve our target.
20 NTU Sustainability Report FY2015Emissions
Total Scope 1 and 2 emissions were 91,932 tCO2e for FY15.
This included emissions from NTU’s internal shuttle bus as well
as purchased electricity. Scope 3 emissions was 15,827 tCO2e
and comprised of air travel by our staff and faculty.
We have yet to fully encompass all our emissions sources into
our calculations. We hope to do so in the future.
Renewable energy
NTU has recently completed the installation of a 5 MW Solar
Photovoltaic (PV) system on campus. The PV modules are
placed on the rooftops of 32 buildings across the campus
and is the largest solar PV installation at any single location in
Singapore to date. It is estimated that the PV system will reduce
the campus reliance on grid power by approximately 3% of the
current total campus consumption and reduce greenhouse gas
emissions by 3,000 tons of CO2 a year. It will also save NTU
approximately $1.5 million in electricity costs annually. The
installation puts NTU on the same playing field as some of the
top universities tracked by AASHE in terms of total installed
capacity and largest roof top mounted solar PV system.
In 2016, NTU plans to carry out a wide-ranging investigation
into other energy efficiency opportunities, aiding it in planning
and target-setting.
NTU Sustainability Report FY2015 21Industry collaborator: Siemens
What: Intelligent, Demand Based, Algorithmic Chiller
Optimization. This system automatically adjusts the
chiller load to a state of dynamic balance, which reduces
overall power consumption. The system is being tested
in the School of Mechanical and Aerospace Engineering.
Period: September 2014 – July 2017
Estimated savings: 10 - 20% energy reduction
A living laboratory
NTU is a living laboratory for
cutting-edge energy efficiency Industry collaborator: 3M / AlfaTech
technologies. As part of our What: Liquid Immersion Cooling for Data Centers.
efforts towards this goal, Using a 2-phase system, electronic components are
we are working with industry submerged into a bath of dielectric heat transfer liquids,
partners to test-bed new which are much better heat conductors than air, water
energy efficiency technology or oil. This eliminates the need for conventional cooling
that can be used across our hardware and results in better cooling efficiency.
campus to help reduce our Compared to traditional air, water or oil cooling, this
energy consumption. We have passive process results in the use of much less energy.
numerous ongoing projects
Period: March 2015 – February 2017
on campus and some of the
Estimated savings: 35% energy reduction
projects are demonstrating a
high potential for substantial
energy savings. These include:
Industry collaborator: JouleAir
What: Demand Control Ventilation System. DCV is
a centralised control system which uses measuring
devices like TVOC, particulates, CO, CO2 and dew
point temperature sensors to modulate the volume
of air supply into the spaces during occupied and
unoccupied periods. It has been installed in the common
facilities and laboratories of the School of Physical and
Mathematical Sciences.
Period: December 2014 – April 2017
Estimated savings: 15-25% energy reduction
Industry collaborator: ENGIE Lab Singapore
What: The PowerZee app was designed by ENGIE
Lab Singapore in partnership with NTU as a fun tool
to engage everyone in increasing the energy efficiency
of the campus. By developing a smartphone virtual
experience, the PowerZee app brought together campus
users to do their bit in reducing everyday electricity
consumption.
Period: Ongoing since February 2015
Estimated savings: 5-10% energy reduction
Industry collaborator: Murata
What: Smart Energy Management Systems. Improved
grid stability and self-sufficiency with the system
operating autonomously by deciding how to distribute
grid power and electricity from solar PV or storage
batteries to household appliances, and controls energy
allocation accordingly.
Period: September 2014 – September 2017
Estimated savings: 35% energy reduction
22 NTU Sustainability Report FY2015Casestudy: Passive Displacement Ventilation (PDV)
Cooling coils
Warm Air
Chilled Water
Cool air
In Singapore, the conventional air-conditioning PDV systems have significant financial benefits
system uses fan coil units, or air handling compared to conventional air-conditioning
units where treated outdoor air is supplied into systems. These include cost savings from the
conditioned spaces after blowing it over coils reduction of construction materials required
that run chilled water for cooling. The system like ductwork and accessories as well as
components such as fans, duct works, terminal reduced operating costs and servicing costs
units or diffusers and related fittings are the main on the mechanical components and more.
contributors to capital and operating costs. PDV systems are also quieter than conventional
Air-conditioning is the single biggest energy overhead systems and have better ventilation
consumer in most buildings in Singapore, often efficiency, which enhances indoor air quality and
accounting for more than 60% of the total energy provides a more desirable acoustic environment.
consumed. The other issues associated with PDVs are also more appropriate for spaces
traditional air distribution systems is that they where high ventilation is required, such as
can be noisy and lead to localised areas of over- classrooms, conference rooms and offices.
cooling especially near the overhead terminal
units where the air blows directly on the person, The PDV system was first tested at a few tutorial
causing a lot of discomfort. rooms on the campus. There were also scientific
studies done to understand the air flow patterns
Passive displacement ventilation (PDV) system and the temperature distribution. With a positive
is an air-conditioning concept that relies on the user experience and knowledge from the tests,
fundamentals of natural convection to drive the the PDV implementation was scaled-up to
conditioned air to the occupants. Without the the whole building level at The Hive Building,
mechanical fan, the air travels at lower velocity which included 55 tutorial rooms. The
and more naturally due to the buoyancy effect operational electricity savings due to improved
of air, in which hot air rises while cold air sinks. ventilation efficiency are estimated to be more
In the PDV system, cold air is introduced at the than $1 million over a period of five years
floor level and the warm air is extracted at the of operation. The Hive building has been
ceiling level. The treated air flows through a operational since September 2015 and the
cavity created using a small vertical partition PDV system there has been running smoothly
next to the wall that has cooling coils on the top. ever since.
NTU Sustainability Report FY2015 23Outdoor
Rain Garden
Seating Deck
Sedimentation
Basin
M
ar
sh
lan
d
&
Ca
Cleansing
sc
Biotope
ad
in
g
St
re
am
s
49.2%
Recreation
Pond
of site area
treated by ABC
stormwater
management
Water
NTU is highly cognizant of the importance of water, NTU also has a rainwater collection system that has
especially in Singapore. We are committed to been integrated into the design of our School of
supporting Singapore’s efforts in conserving water Art, Design and Media. The building has a sloping
by reducing our consumption and treating and green roof that is not only an aesthetic feature, but
recycling water effectively. also creates open space, insulates the building,
cools the surrounding air and harvests rainwater for
NTU is an active supporter of the Active, Beautiful, landscaping irrigation. Under the grass roof are four
Clean Waters (ABC) Programme that was launched layers of interrelated matter which include crushed
in 2006 by Singapore’s National Water Agency, volcanic rocks, pumice and washed sand (for the
PUB. Through this programme, all developers are grass to root), as well as a moisture retention mat.
encouraged to implement environmentally sustainable The turfgrass remains green and healthy year round
green features or ABC Waters design features in via an automatic sprinkler system using harvested
their developments. NTU recently designed a natural rainwater. There are also rain sensors installed on the
stormwater runoff treatment system within its new green roof to automate the irrigation process whereby
Crescent and Pioneer residential halls, which involved irrigation is ceased when it rains. This system, along
diverting stormwater runoff from the upstream with the other green features of the building, has
catchment and creating a natural water body. saved more than 1,170m3 of water a year (equivalent
A full treatment train of ABC Waters design features to the average water consumption of five 4-room
consisting of a sedimentation basin, linear wetlands, HDB flats a year), leading to lower operation and
bioretention basins and cleansing biotope was maintenance costs.
integrated with the natural water body to cleanse the
stormwater runoff before discharging the clean water Greywater recycling is also practised at one of our
into a landscaped cascading pond. The pond also student residential halls where all greywater from
helps to improve the aesthetics and provide a calming showers and wash basins is treated on-site and
environment for our students. re-used for flushing toilets.
24 NTU Sustainability Report FY2015Performance
In FY15, NTU consumed 1.67 million cubic
metres of water. Water intensity per square
metre has decreased by 3% since FY11,
although on a per capita basis, it has
increased by 5%.
More than 40% of water was consumed by
our academic buildings, with half of that
being used for cooling towers. The next two
largest consumers of water were the student
residences and commercial areas, comprising
over 20% each of the total water consumed.
Our ODFM team continues to identify areas
for improvement as part of our refurbishment
efforts and we will work harder to accelerate
our efforts to achieve our target to reduce
water intensity by 35% by 2020.
2.0 46
Million Cubic Metres (m3 per capita)
1.8 45
Million Cubic Metres (‘000,000 m3)
1.6
44
1.4
43
1.2
1.0 42
0.8 41
0.6
40
0.4
39
0.2
0 38
FY11 FY12 FY13 FY14 FY15 FY11 FY12 FY13 FY14 FY15
Figure 12. Total water consumption Figure 13. Water intensity per capita
1.7
Water intensity (m3 per sqm)
1.6
1.5
21%
1.4 31% NTU Academic Building
Auxiliary and Common Services
1.3 4% Employee, Student and commercial residences
National Institute of Education
1.2
Commercial
1.1 33% 11%
1
FY11 FY12 FY13 FY14 FY15
Figure 14. Water intensity per square metre Figure 15. Breakdown of water consumption by building type for FY15
NTU Sustainability Report FY2015 25Waste
We are committed to reducing our waste to landfill through
recycling and waste management programs.
With a number of different waste streams from residential
halls, commercial areas and academic buildings, NTU has a
responsibility to try and minimise waste generation and ensure
that all waste is disposed of in a proper manner.
Waste reduction initiatives
In an effort towards a zero waste campus, at least 1 set of
recycling bins (4 bin system) is available at each building complex
(about 200 complexes and growing). Earthlink NTU also organises
regular recycling drives and e-waste recycling. In addition, we are
also committed to implement composting of agriculture waste on
campus residential area. All canteens also use reusable cutlery
and tableware for dine-in service and to discourage the use of
disposable containers, take-away containers cost an extra $0.20.
NTU was the first Institution of Higher Learning to implement
Managed Print Services campus-wide, which has helped to
actively manage and optimise printing devices and services to
reduce wastage. On-going for the past 4 years, this initiative
has helped to reduce printing and energy costs by 50% as
well as improve workplace efficiency and productivity. It has
also considerably reduced paper consumption and reduced
the university’s carbon footprint. In addition, default double-
sided black and white printing was implemented since 2011 in
all libraries, computer labs and printing rooms to reduce paper
wastage and conserve resources. NTU has also been practicing
a process of ‘paperless admission applications’ since 2003.
In a new initiative since 2014, the university sent admission offer
letters to students electronically.
26 NTU Sustainability Report FY2015Addressing food waste across NTU
Food Bank @ NTU was launched in January 2016 to support
The Food Bank Singapore, a registered charity that strives to
bridge the gap in the market by collecting surplus food in the
market and providing it to organisations and people in need of
food. A collaborative effort between Welfare Services Club (WSC)
and Earthlink NTU, the aim of this initiative is to encourage the
NTU community to donate their unwanted yet unopened and
unexpired food items, which might otherwise be thrown away.
The student team is responsible for monitoring the four collection
boxes that have been placed in prominent locations around the
campus, and handing collected items over to The Food Bank
Singapore on a regular basis. They also organise outreach
campaigns on campus to increase awareness about food waste.
To further support this effort, Earthlink NTU is currently exploring
the inclusion of food items in its end-of-semester recycling
drives, which traditionally collects notes and paper-related items
from students staying in the halls. WSC has also leveraged on
their existing programmes, such as their annual food collection
and distribution drive, Food For Hope, to help spread the word
about food banking. Residents in the nearby neighbourhood
have been informed about Food Bank @ NTU and the various
collection points on campus.
Through Food Bank @ NTU, it is envisioned that the NTU
community will be more aware of food as an important resource
that some families and individuals are struggling to obtain, and
do their part to ensure that food waste is reduced.
NTU Sustainability Report FY2015 27Performance
NTU has been collecting waste data since 2011 to track our progress
against our target of reducing waste intensity by 35% by 2020. In FY15,
2,892 tons of waste was collected in the NTU main bin center. Waste
generation and intensity has been decreasing, which has led to a 27%
reduction in waste intensity per square metre and 21% reduction in
waste intensity per capita from FY11 baseline levels.
Recycling rates on campus, however, has also significantly decreased.
In FY11, recycled waste comprised 18% of total waste, but in FY15,
it was only 2.4% of total waste. It has been observed that the reduction
in the amount of recyclables might be due to an increase in personal
recycling activities.
Hazardous waste is treated separately by each of the schools and the
different institutions at NTU. In FY16, we will check with all institutions
what type of data is available and we aim to develop an easy-to-use
data template in FY17 to start collecting data. We hope to report on
this in FY18.
In January 2016, EcoCampus undertook a qualitative study of waste
management at the NTU main campus to understand the current waste
management system and identify areas of improvement. The main
campus is divided into 11 zones for the purpose of waste collection.
Interviews and site visits were conducted and a number of issues
and gaps were identified; general waste bins were contaminated with
other types of waste that could be recycled, food waste was a large
proportion of the waste and there was lack of data on the exact amount
and type of waste being disposed.
To further our progress in this area, we will look into conducting a
campus-wide waste audit to better determine the key issues and how
we can manage them in order to achieve our waste intensity target.
28 NTU Sustainability Report FY2015Table 3: Breakdown of waste generation in NTU from FY11 – FY15*
FY11 FY12 FY13 FY14 FY15
Paper 221 90 25 42 33
Plastics 281 100 10 27 24
Glass 59 22 4 8 7
Metal scrap 83 13 4 4 3
General waste (Tons) 2983 3061 2926 2884 2824
Total waste (Tons) 3628 3286 2970 2964 2892
* Waste data only available until December 2015. Hence, FY15 data has to be partially
estimated. Data does not include hazardous waste, which is managed separately by
individual NTU schools.
3.5
3.0
Waste intensity (tons per sqm)
2.5
2.0
1.5
1.0
0.5
0.0
FY11 FY12 FY13 FY14 FY15
Figure 16. Waste intensity per square metre
100
90
Waste intensity (tons per capita)
80
70
60
50
40
30
20
10
0
FY11 FY12 FY13 FY14 FY15
Figure 17. Waste intensity per capita
NTU Sustainability Report FY2015 29Campus operations
100%
of NTU campus We have identified our key material topics in this area as
buildings to be being: Transportation, Procurement and Green Buildings.
certified Green NTU aims to provide a conducive teaching and learning
environment and endeavours to do so in the most
Mark Platinum
sustainable way. We showcase state-of-the art technology
by 2020 and construction around our campus and aim to have a
sustainable supply chain for our operations.
100%
carbon free
shuttle vehicles
and campus
fleet by 2020
Sustainable
Procurement
Policy in place in
FY 2017
30 NTU Sustainability Report FY2015Transportation
We aim to be recognised globally as a leader in implementing
sustainable mobility planning and technologies in our campus.
Sustainable transportation on campus
NTU’s sprawling campus covers over 200 hectares, which presents
some challenges in getting around. Walking from one end of the campus
to the other can take up to one hour. To facilitate the movement of
students, employees and visitors across the campus, NTU provides an
internal shuttle bus that runs two different routes – the red and blue line,
both of which stop at several key buildings on campus. In addition, NTU
encourages cycling around campus and there are around 1,650 bicycle
racks on campus with almost every building equipped with a bicycle
rack and shower facilities.
Encouraging the use of public transport
NTU provides a free shuttle bus service, Campus Rider, to and from
Pioneer MRT station that can be used by anyone visiting NTU. We
further encourage the use of public transport by students by providing
free shuttle services for our students to and from seven other MRT
stations. We will continue to expand our shuttle services from other MRT
stations as demand from other areas increases.
Electric Mobility on Campus
NTU is designing a future-ready campus. The campus has created
2 designated electric-vehicle and hybrid car charging stations and has
special parking lots for electric or hybrid cars. NTU is also test-bedding
several electric and autonomous vehicles on campus and has 2 electric
cars, 2 driverless vehicles and 2 electric bicycles for research purposes.
One of the major projects NTU is test-bedding is NAVYA, an electric
driverless shuttle bus. In March this year, the ERI@N e-mobility team
began providing thrice weekly shuttle services using NAVYA to transport
passengers from point to point on campus. The pre-determined routes
were from CleanTech One to Hall 11 Residences and The Hive to North
Spine, which takes 20 minutes and 15 minutes respectively.
NTU Sustainability Report FY2015 31Procurement
We aim to procure our resources in an ecologically sound,
socially just, and economically viable manner and proactively
engage with our key suppliers on their sustainability performance.
Our supply chain includes goods and services required for our
campus operations, as well as the procurement of contractors
for the construction of new facilities. In FY15, NTU had a supplier
base of over 3,780 suppliers with the top 90% from Singapore
and Europe. Our total spend on suppliers was over $250 million.
Sustainable procurement is currently being practised by the
ODFM. The ODFM adheres to a Sustainable and Environmental
Friendly Procurement Policy which was developed in 2014, and
provides guidance on the purchasing and requisition of products
and services. The policy is used internally to ensure that due
consideration is taken to purchase products that conserves energy
and water or are produced in an environmentally-friendly way.
The ODFM also screens contractors before they start work to
ensure that they adhere to the Safety and Health Handbook
for Contractors, which includes stipulations on environmental
protection and waste disposal. Contractors are also evaluated
by ODFM once their work is completed and scored according
to their performance in 5 key areas.
NTU is currently looking to develop a campus-wide sustainable
purchasing policy and we will provide an update on this in
future reports.
32 NTU Sustainability Report FY2015Green Buildings oversees all new developments and existing
facilities and is responsible for achieving the Green
Our commitment to sustainability is most visible in Mark certifications. A winner of BCA’s Green Mark
the built infrastructure on its campus. We envision Champion award in 2014, NTU has been expanding
having a campus with the highest percentage its campus as well as retrofitting its existing buildings
(by floor space) of certified sustainable ‘green’ to meet higher BCA Green Mark standards in recent
buildings among major universities. Therefore, years. As of December 2015, 20 building projects in
we ensure that all new construction projects and NTU have been Green Mark-certified, out of which
all renovation projects adhere to the highest 18 have attained the highest Platinum status.
practical sustainable construction standards.
Retrofitting existing buildings
Campus Sustainability Guidelines
We currently have over 760 buildings on campus,
The management and refurbishment of campus with some dating back to 1954. With such a large
facilities is governed by the Campus Sustainability range of building ages, it has been a challenge to
Guidelines which was developed by the ODFM in retrofit our buildings with more sustainable features
2014. It serves as a guide for NTU’s Project Managers due to limitations in the infrastructure. However,
and Consultants to work towards NTU’s vision of we have strived to continue our efforts in identifying
being the greenest campus in the world. It encourages opportunities to upgrade our buildings and, in 2015
the use of green technology and eco-friendly features alone, we have managed to achieve over 3,600
and provides guidelines on energy conservation MWh in estimated energy savings from refurbished
measures, water efficiency and rainwater collection, buildings that have met Green Mark standards.
material and waste management. The policy is This has been achieved through a number of
evaluated every two years to ensure the efficacy of initiatives including installing more efficient water-
the measures proposed and continual improvement cooled chiller plants, motion sensors for common
of the environmental performance of the campus. areas and extensive use of LED lighting.
Leading the way with Green Mark NTU also offers employees the opportunity to
undertake training to become a Certified Green Mark
NTU is committed to helping achieve the national Manager as well as refresher courses when needed.
target to green at least 80% of Singapore’s buildings This enables us to ensure that relevant employees
by 2030. The University has been on a rapid drive are kept up to date on the Green Mark standards as
to green all its new campus buildings, as well well as new and innovative ways to achieve more
as to retrofit the existing ones. The ODFM team efficient buildings.
NTU Sustainability Report FY2015 33Casestudy: NTU Sports Hall
NTU is building the region’s first sports flowing through them. This will cool the wind
hall with a unique long-span timber roof that enters the hall and removes hot air quickly
structure that provides five times better heat through convection, giving students a unique
insulation than concrete. The three-storey sports experience. Students will be able to
hall, which is set to open at the end of 2016, play badminton without any wind disruption
is the first building in South-east Asia to use from fans or the need for air-conditioning to
engineered wood on such a large scale. It stay cool. These eco features will save over
involves engineered wood systems such as 40% in energy consumption and 30% in water
cross-lamination and glulamination, in which consumption.
numerous laminated small pieces of timber
form a single large piece. This is much lighter Key Green Features:
than steel, which allows for a design that 1. Energy-efficient Induction Air Distribution
does not need supporting pillars. It will also System which contributes about 7.3%
feature a 72m-long wave roof made of timber. of overall energy saving.
2. Sustainable façade using Engineered
Apart from sustainable features such Wood System, namely cross laminated
as energy-saving LED lighting and solar timber (CLT) and glued laminated timber
powered systems, the sports hall is (Glulam) for the whole building.
designed to take advantage of their natural 3. Heat Recovery System for hot water which
surroundings. Using computer modelling contributes 3.7% of overall energy saving.
of the sun and wind patterns on-site, the 4. Daylight sensors in the common areas
buildings’ designers aim to harness natural and motion sensors for all toilets.
winds so students will enjoy good ventilation. 5. Energy-efficient Chiller Plant System.
The sports hall will also have two-layer walls 6. Extensive use of LED lights and energy-
designed for heat insulation on hot days and efficient lighting system.
will have special metal coils with cold water 7. Extensive use of sustainable products.
34 NTU Sustainability Report FY2015Casestudy: North Hill Residential Halls
NTU’s three new residential halls at
North Hill will be Singapore’s first public
high-rise buildings using a new “Lego-
style” construction method that allows
prefabricated individual rooms to be
stacked on top of each other. Whole rooms
complete with internal fixtures such as
lighting, windows, and fans, are built at the
factory and then put together on-site, which
ensures consistency in workmanship and
better overall construction quality.
Known as “Prefabricated Pre-Finished The new 13-storey residential halls will be
Volumetric Construction” (PPVC), this a one-stop integrated hub with eateries,
method saves up to 40% in manpower and shops and common spaces such as rooftop
20% in construction time. It also reduces gardens with BBQ pits, lounges and study
noise and dust pollution on-site as more rooms. It will accommodate over 1,850
activities are done off-site. To reduce the students, and will house the campus’
need for air-conditioning, all rooms in the largest fully-equipped gym, which is about
residential hall will have windows that reflect five times the size of a four-room HDB flat.
heat using a special coating, and louvres
that shield any direct sunlight.
NTU Sustainability Report FY2015 35Sustainability education and research
NTU is committed to investing our resources in providing
opportunities for our students, researchers and faculty to learn
and conduct research on important sustainability issues.
We have identified our key material topics in this area as being:
Education Programmes and Research Programmes. NTU tightly
couples its sustainability strategy to its core mission of research and
education by preparing students for entering the global workforce as
leaders, driving change for a sustainable world. NTU will leverage its
position as a leading academic institution in the region and aims to
be a collaborative partner of choice for major corporations, funding
partners and NGOs who share its vision regarding sustainability.
Our 2020 goals
450 60 500 30 3,000
courses ongoing patents spin-offs/ academic
related to industry related to start-ups publications
environment/ collaboration sustainability related to related to
sustainability projects per sustainability sustainability
year
36 NTU Sustainability Report FY2015Education programmes
We are committed to embedding sustainability throughout our
educational programmes by offering our students an integrated
perspective on how sustainability applies to their chosen fields of study.
A multidisciplinary approach
Sustainability at NTU is a multidisciplinary subject that is covered across
various degrees and programmes. NTU offers over 200 undergraduate
courses and over 110 graduate courses across its 12 schools that
are related to sustainability. Since 2014, NTU introduced a mandatory
sustainability module for all first year undergraduate students entitled
‘Introduction to Sustainability: Multidisciplinary Approaches and
Solutions’. The course covers topics like Sustainability and the Earth,
Sustainable Business and the Political Economy of Sustainability and
provides a holistic view of sustainability and the world. About 7,000
new undergraduate students are introduced to sustainability through
this course each year.
NTU’s Interdisciplinary Graduate School (IGS) has been in operation
since June 2012 and is dedicated to multi-disciplinary research and
postgraduate training – the first of its kind in Asia. The IGS offers
a 4-year PhD scholarship worth about S$200,000 for successful
applicants to undertake research within NTU’s Peaks of Excellence in
Sustainable Earth, Secure Community, Healthy Society and Global Asia.
The IGS currently has 167 postgraduate students in its Sustainable
Earth programme who are attached to leading research institutes such
as the Earth Observatory of Singapore, ERI@N and NEWRI.
An Asian focus
The Asian School of the Environment (ASE) was recently created in
2014 as a new interdisciplinary School that focuses on environmental
research on Asian environmental challenges. The ASE integrates earth
and environmental life science, ecology, engineering and technology,
human ecology, humanities, and the social sciences to address key
issues of the environment and sustainability. The School offers three
courses dedicated to the Asian environment: Ph.D. in Earth Sciences,
Bachelor of Science degree in Environmental Earth Systems Science
and a Minor in Environmental Sustainability.
NTU Sustainability Report FY2015 37You can also read