OCEAN RACING CLUB OF VICTORIA MODULE 3 - TRANS OCEANIC (KNOWLEDGE) - ORCV
←
→
Page content transcription
If your browser does not render page correctly, please read the page content below
OCEAN RACING CLUB OF VICTORIA

WEATHER FOR
SAILORS
MODULE 3 - TRANS OCEANIC (KNOWLEDGE)
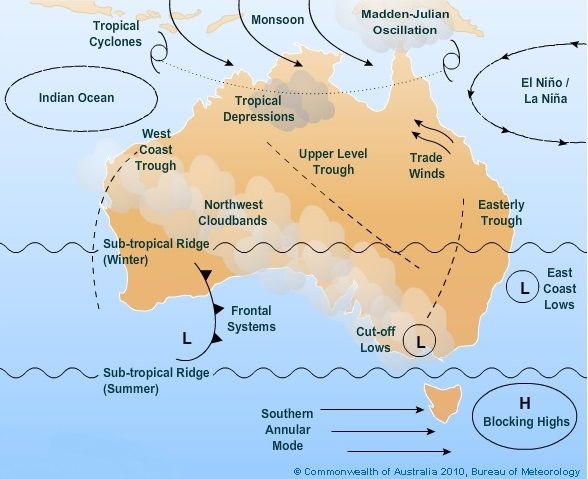
Weather for Sailors: Module 3 – Trans Ocean

Weather for Sailors – Module 3, Trans Ocean
This course has been developed not only for sailors interested in sailing to or planning for an
extended international voyage, but also for practical students of weather and for those
sailing extended periods well offshore. There is an explosion of science occurring with
weather, bringing huge benefits in predictability and understanding. Much of this will require
an awareness of the terminology and concepts involved with the science in order to better
use the information to our advantage. The various worldwide meteorological bureaus now
present their products in ever better formats for our usage but with awareness we can utilize
so much more. Therefore, the course avoids formulae or proofs in favour of better
understanding the kind of reports available to assist us on the water or before venturing.
Planning for the sailing adventure of a lifetime is a drawn-out process encompassing boat
and crew preparation, paperwork (customs etc) and victualling as well as weather. As
always, being prepared with a broad plan is not just about route investigation but also
contingencies. There is plenty of history giving weather averages for planning but unusual
events also occur and need to be planned for as well. This session will examine planning
tools and conditions which could be encountered in an extended voyage. As usual, ORCV
events have a series of information seminars to assist in an organized event but reality is
that each vessel has to rely on its own capabilities, limitations and resources.

Initial weather planning.
Seasonal Variation of pressure belts such as the Westerlies, Southern High Pressure zone
and the Inter-tropical convergence zone (ITCZ) is a first guide for planning as an indication
of timing for climate conditions as background information. Cyclone seasons in both North
and South hemispheres can indicate where not to be and when to not be there.
BOM       video     Understanding     the    Southern       Annular     Mode          (SAM)
https://www.youtube.com/watch?v=KrhWsXCB3u8

© Ocean Racing Club of Victoria (ORCV)                                                   1

Weather for Sailors: Module 3 – Trans Ocean

Route Planning 101 Michael Carr 2004
Consider this question: When do you depart on a voyage?
Do you do it when the crew is ready? Do you make that
decision based upon when the boat is ready? Or when
you, the captain, are ready? Or maybe you just depart
because the boat anchored nearby is weighing anchor so
it must be time to go.
Some boats travel solo and others travel in rallies, going
en masse. So how do sailors following these diverse
modes of travel resolve the go or no-go decision as well
as the multitude of issues involved in choosing a
proposed track and then either staying with that track or
modifying it as circumstances and conditions change?
These are fundamental questions for all ocean-going
sailors.
At first it might seem that there is no way to come to a
logical and reasoned decision. But there actually is and
the first step is to define your objective. Are you departing
on a race that you highly desire to win or are you heading How do you know when to depart
                                                              for an ocean crossing? That's
off on your first ocean cruise? You must define the where prudent route planning
objective for your voyage. Saying "I want to safely cross comes into play.
the Atlantic Ocean and minimize my exposure to gale-
force winds" is something quite different than "I want to enter the Around Alone Race and
win." These two very different goals have both issued forth from my mouth in the past, so I
know something about this topic.

When a person cannot make intelligent decisions, he or she usually ends up guessing, and
that introduces chance into the decision-making process, which can lead to disastrous
mistakes.

Once you have articulated the object of your voyage, you can then define the type of
weather you desire to experience. In saying weather I include wind, waves, ocean currents,
fog, rain, low and high-pressure systems, and tropical events. Waves are probably the most
critical weather element since they have the greatest potential effect on a vessel's stability
and its ability to make progress toward a given destination.
Weather window is the term usually applied to that period of time, which can be hours or
days, during which weather elements are
appropriate for a specific, selected transit,
having considered the vessel and crew's
capabilities and constraints. Accepting this
definition of a weather window confirms that
there is no universal weather window for all
voyages, boats, and crews.
Here's an example: The appropriate weather
scenario for a record-setting run west-to-east
across the Atlantic on a catamaran is not
necessarily the same weather situation you'd
want for sailing a cruising monohull over the
same course. A record-racing catamaran crew
would desire strong, low-pressure systems that
move with it at speeds of 20 to 30 knots, while
the crew of a cruising boat would rather have a Finding the appropriate weather window for
stationary high-pressure system providing your vessel and your sailing style is a critical
consistent and steady winds. For a multihull, component of route planning.
the strong southerlies and southwesterlies that
© Ocean Racing Club of Victoria (ORCV)                                                  2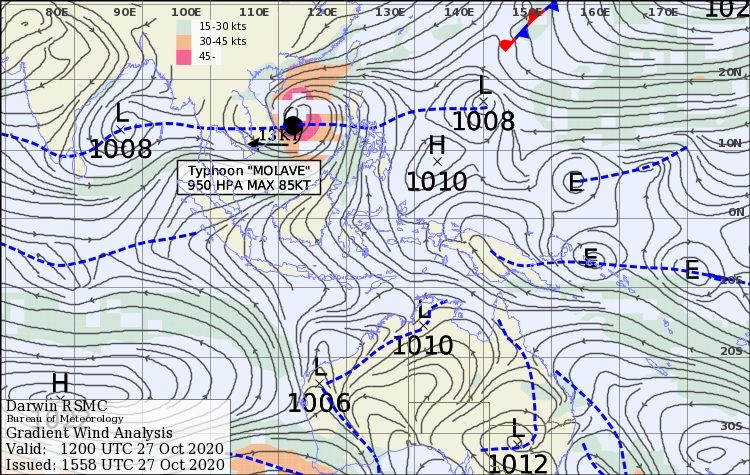
Weather for Sailors: Module 3 – Trans Ocean

precede the arrival of low-pressure system in the Northern Hemisphere would favor the cat's
off-the-wind reaching prowess—allowing it to achieve speeds equal to and greater than the
true wind. A slower moving cruiser would prefer the same wind direction, southerly, but at a
lesser and more consistent strength, which is gained by using winds coming off the
Bermuda-Azores high pressure instead of the winds associated with developing and growing
low-pressure systems.

Once a crew has chosen a route and departed, the skipper shouldn't consider that the route
is locked in place. It must be updated and tweaked daily, hourly, and often minute-by-minute
in response to changing weather, vessel, and crew conditions. A chosen route is similar to
the information contained in a AAA triptick in that it is for general guidance only. You still
need to watch the traffic pattern, shift lanes to avoid unnecessary traffic, and even detour if
conditions become unacceptable. For ocean-going sailors, the same kind of flexibility is
key—a willingness to institute and make changes.

Although it's very often overlooked, crew fatigue is one of the most important factors in
determining a route. A human body has definite limits. Sleep must be given to a tired body;
lack of sleep causes numerous mental and physical problems. A tired person does not think
effectively, his ability to evaluate and process information is significantly slowed and events
can easily overwhelm such a person. When a person cannot make intelligent decisions, he
or she usually ends up guessing. Guessing introduces chance into the decision-making
process, and so mistakes are made. Sometimes such mistakes are simple and not too
dangerous, but other times those mistakes can cause injury to the boat or crew, or worse.

This is why all decisions need to be made within the context of a crew's capabilities, taking
into account their physical and mental condition, their experience, their training, as well as
their level of fatigue. A tired crew cannot perform, and should not be made to perform. In a
sense, routing is a study in situational awareness, of knowing your long-term objectives
while maintaining a grasp on your immediate surroundings. It is also a challenge in
observing, detecting, analyzing, and then acting as you observe and evaluate your weather,
crew, and vessel.

So, now that we know all the variables and possibilities, how do we start the routing
process? First consider the following initial track options:

Great Circle - The shortest physical distance over a curved surface.
Rhumbline A course that crosses all longitudes at the same angle, but is not the shortest
physical distance across a curved surface.
Bucket A route that forms the shape of a bucket by taking the vessel north or south until
reaching a desired latitude for passage, then perpendicular until near the longitude of the
destination whereafter the vessel turns north or south to the destination. Sailors utilize this
form of routing to minimize exposure to weather at unsuitable latitudes.
Composite A hybrid of the great circle and rhumbline routes, the composite approach
employs a limiting latitude so that sailors can avoid unsuitable weather or restrictions due to
geography, ice, or political constraints.

Once you choose the best route option you can then begin factoring in crew and vessel
capabilities and limitations. Always remember that on ocean voyages, both long and short,
the route that will take the least time to sail is very often not the shortest physical route.
Unlike the AAA triptick, you cannot depend on making a steady speed nor have a flat
highway for an entire passage at sea.

© Ocean Racing Club of Victoria (ORCV)                                                   3
Weather for Sailors: Module 3 – Trans Ocean

                                          To manage your route you need information, the
                                          kind of information that keeps you informed of
                                          past, present, and future weather and
                                          oceanographic conditions. Without information
                                          you cannot make intelligent routing decisions,
                                          especially in the dynamic environment of weather.
                                          To gather information you need systems that
                                          bring in quantities of quality and timely
                                          information. Last week's weather chart is of little
                                          use, as is today's weather chart if it contains
                                          scant information. You want weather products
                                          that are data-intensive with quality data.
  Savvy sailors know to adapt their route OK, where do such products come from? These
  planning to accommodate the many        days the Internet is overflowing with quality
  changes in weather and oceanographic    weather data, and marine weather products are
  conditions once underway.
                                          supplied through a number of communications
                                          systems. Some that you should be aware of are
                                          NAVTEX, Inmarsat C Safety Net, OCENS
Millennium, Iridium, GlobalStar, Inmarsat A, B, M, and the Global Maritime Distress and
Safety System (GMDSS). Technology advances rapidly and so does obsolescence-always
check!

A final element in successful route planning is
having access to emergency communications
should you need to request assistance. An
emergency position indicating beacon (EPIRB), or
a GPS equipped EPIRB (GEPIRB) should be
mandatory equipment for every ocean-going
vessel. And I consider it necessary to carry a
search and rescue transponder (SART) and an
emergency VHF radio, as well as immersion suits
for protection from hypothermia, a liferaft, and a
watermaker. Humans can survive an amazing
amount of time without food, but freshwater is
another matter. It's imperative that the human body
intake at least 18 ounces of water every day to
maintain a basic level of function. So, even the Having access to multiple means of
best life raft and emergency-locating gear won't communication in an emergency is an
                                                     important part of successful route planning
guarantee that you will be alive when help arrives. says the author.
You need to keep yourself hydrated and warm.
Follow these prescriptions regarding routing and make decisions only after you've gathered
all the information that you can. Do that and you should be able to make the most of any
offshore passage.

© Ocean Racing Club of Victoria (ORCV)                                                   4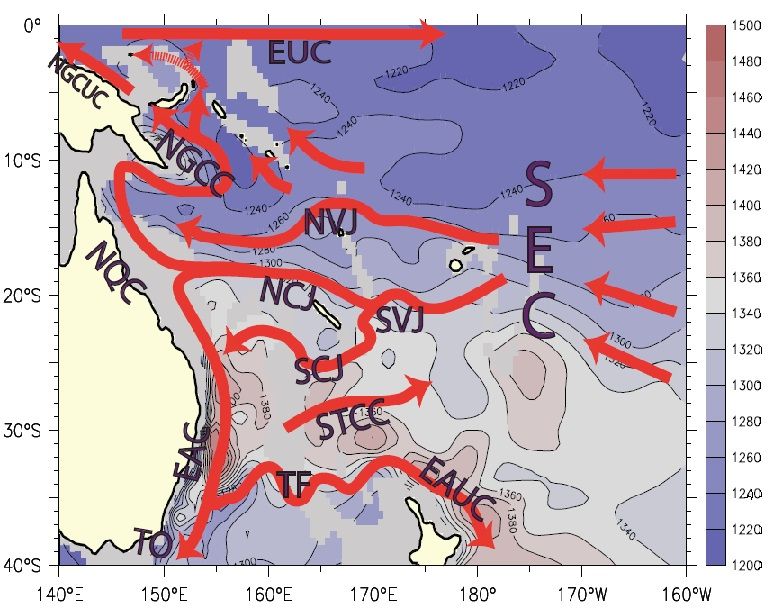
Weather for Sailors: Module 3 – Trans Ocean

Planning tools
There are a number of resources available including Pilot publications, Admiralty Sailing
Directions and Ocean Passages of the World which has wind roses (see below) but
generalized in fairly large areas. Far more detail can be gained from a web site tool
headlined COGOW (Climatology of global ocean winds). This site utilizes information from
satellite technology and can give data in ½degree lat/long breakdown as a selection plus
broadscale graphically notated areas. Examples follow.

http://cioss.coas.oregonstate.edu/cogow

Cogow URL resource for wind information as indicator, a useful tool but only a guide

Example results follow. Note a user manual in the opening page, select Cogow ver 1
Area select, move the purple rectangle near the area of interest and click.

When the purple rectangle is clicked, a large scale area will display, if not what is desired go
back and move the purple rectangle closer to your desired location. From the broadscale
wind diagram select the time period above the chart for the half month period of proposed
voyage and then click the location of the 1st. area along your proposed route to obtain a wind
rose.

© Ocean Racing Club of Victoria (ORCV)                                                    5
Weather for Sailors: Module 3 – Trans Ocean

to assemble route information. Above the broadscale diagram is a four-way move tool which
by pressing a suitable direction arrow will move your selection.

                                      Note that the broadscale diagram gives wind
                                      averages. Selecting a desired point of interest brings
                                      up a windrose . One needs to consider the possible
                                      minor barbs in planning. We have all heard it before!
                                      “This weather is unusual!”. Just my luck to be here
                                      during the minor weather barb.

                                       Wind roses summarize the occurrence of overlapping
                                       3-day average winds within a 0.5 latitude by 0.5°
                                       longitude bin centered at 25.255ᴼS, 166.26ᴼE showing
                                       their strength, direction and relative frequency. The
                                       wind Rose is interpreted as follows: the length of the
                                       barbs that extend radially from the centre of the rose,
                                       reflect each direction's relative frequency. If the barb
                                       pointing from the ESE is twice as long as the barb
                                       pointing from the SSE then the winds blew FROM the
                                       ESE twice as frequently as they did from the SSE. In
each direction, the barb’s appearance varies through several styles in sequence. The
proportion of the barb’s length in each style indicates the proportion of time winds blew from
that direction at a given speed. For example, a thin, light grey rectangle extending from the
centre indicates wind speeds of between 0 and 5 knots. A slightly thicker, and slightly darker
grey, segment indicates wind speeds of between 5 and 10 knots, and so forth until, finally, a
thick black rectangle indicates wind speeds greater than 25 knots. To aid with interpretation,
concentric rings at 20 % frequency intervals are plotted on each wind rose. Additionally, the
© Ocean Racing Club of Victoria (ORCV)                                                    6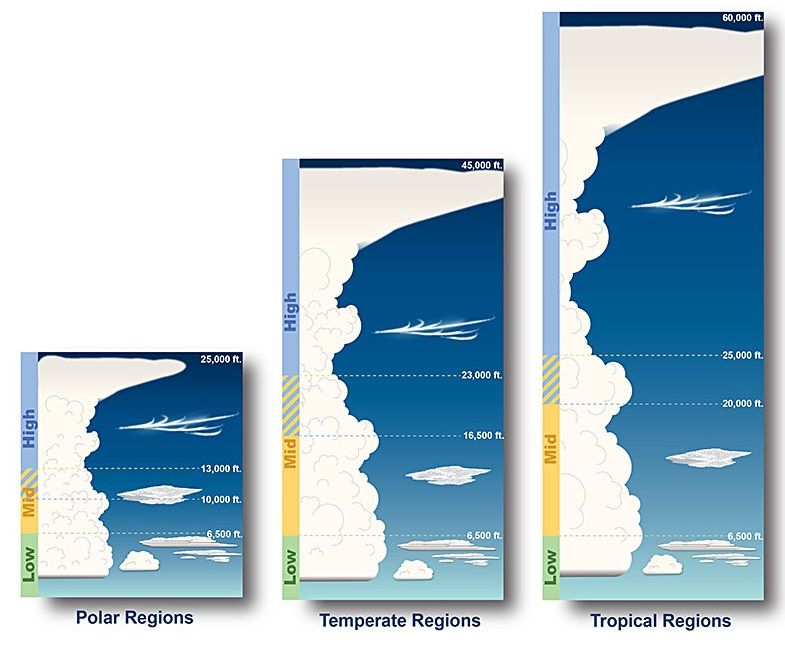
Weather for Sailors: Module 3 – Trans Ocean

total number of overlapping 3-day average observations used to create each wind rose is
included in the lower right-hand-corner of each plot. And do not forget to examine the timing
and route for the trip home or to formulate a lay-over until the timing is more feasible. The
COGOW tool enables this process. Of course there are other climate factors which can
increase or decrease the averages obtained.

Climate influencers

ENSO and IOD are major climate drivers which affect sailing conditions particularly in the
Southern Hemisphere due to the mainly ocean covered areas and compared to the more
land covered Northern Hemisphere. The Australian Bureau of Meteorology monitors several
indicators and produces indices in order to determine the current status and outlook for our
area of interest.
An index is a measure (often a numerical value) that can be representative of a particular
pattern or state of a system. Climatologists monitor several indices, some ocean-based and
some atmospheric, to provide a quick indication of the state of certain climate variables and
climate drivers.

El Niño–Southern Oscillation indices

El Niño and La Niña events (collectively referred to as the El Niño–Southern Oscillation or
ENSO) are driven by changes in the equatorial Pacific Ocean. During El Niño, sea surface
temperatures in the central and eastern Pacific Ocean become warmer than average, while
La Niña is characterised by cooler than average sea surface temperatures in the same
regions.

In order to monitor the Pacific Ocean for signs of El Niño or La Niña, climatologists use
several sea surface temperature (SST) indices. These indices simply refer to the difference
from the long-term (1961–1990) mean of the sea surface temperature in several regions
located along the equatorial Pacific. These regions are called NINO1 and NINO2 (which lie
on the South American coast), NINO3, and NINO3.4 (which occupy the eastern and central
equatorial Pacific respectively) and NINO4 (located in the western Pacific). NINO3.4 partially
overlaps both the NINO3 and NINO4 regions.

The NINO regions (see map below) cover the following areas:

   •   NINO1: 5-10°S, 80-90°W
   •   NINO2: 0-5°S, 80-90°W
   •   NINO3: 5°N-5°S, 150-90°W
   •   NINO3.4: 5°N-5°S, 120-170°W
   •   NINO4: 5°N-5°S, 160°E-150°W

For monitoring of ENSO events, the value of the NINO indices are often used in conjunction
with other data, e.g., sub-surface ocean temperatures, cloudiness, winds, and the Southern
Oscillation Index (SOI). Australian climatologists often cite sustained monthly NINO3 or
NINO3.4 values above +0.8 °C as typical of El Niño conditions, with values of below −0.8 °C
as that of La Niña. These values are approximately one standard deviation from the long-
term mean (i.e., around 70% of monthly NINO3 values, for example, lie between −0.8 °C
and +0.8 °C).

© Ocean Racing Club of Victoria (ORCV)                                                  7
Weather for Sailors: Module 3 – Trans Ocean

Figure 1 Regions used to monitor ENSO and IOD. The NINO regions are used to monitor
ENSO, with NINO3 and NINO3.4 typically used to identify El Niño and La Niña events. The
IOD index (or Dipole Mode Index, DMI) is used to identify IOD events, by taking the
difference between the west and east poles.

The Indian Ocean Dipole indices

Indian Ocean Dipole (IOD) events are driven by changes in the tropical Indian Ocean.
Sustained changes in the difference between normal sea surface temperatures in the
tropical western and eastern Indian Ocean are what characterise IOD events.

The IOD is commonly measured by an index (sometimes referred to as the Dipole Mode
Index, or DMI) that is the difference between sea surface temperature (SST) anomalies in
two regions of the tropical Indian Ocean (see map above):

   •   IOD west: 50°E to 70°E and 10°S to 10°N
   •   IOD east: 90°E to 110°E and 10°S to 0°S

A positive IOD period is characterised by cooler than average water in the tropical eastern
Indian Ocean and warmer than average water in the tropical western Indian Ocean.
Conversely, a negative IOD period is characterised by warmer than average water in the
tropical eastern Indian Ocean and cooler than average water in the tropical western Indian
Ocean.

For monitoring the IOD, Australian climatologists consider sustained values above +0.4 °C
as typical of a positive IOD, and values below −0.4 °C as typical of a negative IOD.

ENSO and IOD outlooks

The Bureau produces long-range sea surface temperature outlooks for the NINO and IOD
regions, to provide information on the potential development of El Niño, La Niña or IOD
events in the coming months. The main regions focussed on are the NINO3.4 index and the
IOD index as these are used to help identify ENSO and IOD events, respectively. A
summary of the ENSO and IOD forecasts from international climate models is also
produced.

© Ocean Racing Club of Victoria (ORCV)                                                8

Weather for Sailors: Module 3 – Trans Ocean

El Niño Southern Oscillation (ENSO)

ENSO is the oscillation between El Niño and La Niña conditions.

This climate influence is related to: El Niño La Niña The Australian Monsoon

                                                                          Video:

Understanding ENSO https://www.youtube.com/watch?v=dzat16LMtQk

The term El Niño refers to the extensive warming of the central and eastern tropical Pacific
Ocean which leads to a major shift in weather patterns across the Pacific. This occurs every
three to eight years and is associated with a weaker Walker Circulation (see diagram below)
and drier conditions in eastern Australia. El Niño Southern Oscillation(ENSO) is the term
used to describe the oscillation between the El Niño phase and the La Niña, or opposite,
phase.

In the eastern Pacific, the northward flowing Humbolt current near south America brings
cooler water from the Southern Ocean to the tropics. Furthermore, along the equator, strong
east to south-easterly Trade winds cause the ocean currents in the eastern Pacific to draw
water from the deeper ocean towards the surface, helping to keep the surface cool. However
in the far western Pacific there is no cool current, and weaker Trades mean that this
"upwelling" effect is reduced. Hence waters in the western equatorial Pacific are able to
warm more effectively under the influence of the tropical sun. This means that under
"normal" conditions the western tropical Pacific is 8 to 10°C warmer than the eastern tropical
Pacific. While the ocean surface north and northeast of Australia is typically 28 to 30°C or
warmer, near South America the Pacific Ocean is close to 20°C. This warmer area of ocean
is a source for convection and is associated with cloudiness and rainfall.

However, during El Niño years, the trade winds weaken and the central and eastern tropical
Pacific warms up. This change in ocean temperature sees a shift in cloudiness and rainfall
from the western to the central tropical Pacific Ocean.

© Ocean Racing Club of Victoria (ORCV)                                                  9
Weather for Sailors: Module 3 – Trans Ocean ENSO neutral El Niño La Niña © Ocean Racing Club of Victoria (ORCV) 10
Weather for Sailors: Module 3 – Trans Ocean

La Niña

The Southern Oscillation Index, or SOI, gives an indication of the development and intensity
of El Niño or La Niña events in the Pacific Ocean. The SOI is calculated using the pressure
differences between Tahiti and Darwin. The following figure demonstrates the typical
fluctuations in SOI over a period of 11 years. Positive SOI values are shown in blue, with
negative in orange. Sustained positive values are indicative of La Niña conditions, and
sustained negative values indicative of El Niño conditions.

This graph shows the values of the SOI between 1991 and mid-2015. Monthly SOI
data.

 How does it affect Australia?

Each phase of the ENSO has a very different effect on the Australian climate. Events
generally have an autumn to autumn pattern of evolution and decay. That is, they typically
begin to develop during autumn, strengthen in winter/spring, then decay during summer and
autumn of the following year.
© Ocean Racing Club of Victoria (ORCV)                                                11
Weather for Sailors: Module 3 – Trans Ocean

  During a La Niña event, the Walker Circulation intensifies with greater convection over the
  western Pacific and stronger trade winds. As the trade winds strengthen, the pool of warmer
  water is confined to the far western tropical Pacific, resulting in warmer than usual sea
  surface temperatures in the region north of Australia. Sea surface temperatures across the
  central and eastern tropical Pacific Ocean become cooler than usual and the thermocline
  moves closer to the surface – cool waters from the deep ocean are drawn to the surface as
  upwelling strengthens. Convection and hence cloudiness over the region north of Australia
  increases as stronger winds provide more moisture to the overlying atmosphere and the
  Walker Circulation intensifies.

  La Niña likely to continue until at least the end of summer 2020−21

  La Niña continues in the tropical Pacific. Australian and international climate models suggest it is
  likely to continue at least into February 2021.

  Central and eastern tropical Pacific Ocean sea surface temperatures remain at La Niña levels,
  as do most atmospheric indicators, including trade winds and cloudiness. The Southern
  Oscillation Index (SOI) has moved back into neutral values, most likely due to the influence of a
  passing MJO event. The SOI is expected to return to La Niña levels in the coming weeks.

  La Niña typically increases the chance of above average rainfall across much of Australia during
  spring, and across eastern Australia during summer. Current climate outlooks indicate rainfall
  during November 2020 to January 2021 is likely to be above average for most of the country.

  Most models suggest La Niña will peak in December, with around half the models anticipating a
  strong event. While there is some possibility that the peak strength could reach levels similar to
  2010–12 there are some differences. La Niña became established much earlier in 2010, was
  long lived (over two years), and impacts were enhanced by a negative Indian Ocean Dipole and
  warm ocean temperatures around Australia.

  In contrast, the Indian Ocean Dipole (IOD) is currently neutral, and most models suggest it will
  remain neutral for the rest of 2020.

  The Southern Annular Mode (SAM) is expected to be positive for the remainder of October into
  early November. La Niña tends to favour positive SAM during spring and summer, further
  supporting the likelihood of above average rainfall in the east.

  The Madden–Julian Oscillation (MJO) is currently in the western Pacific and is expected to
  remain moderately strong as it moves across the Pacific basin, then decrease in strength as it
  approaches Africa.

  Climate change is also influencing the Australian climate. Australia's climate has warmed by
  around 1.4 °C since 1910, while southern Australia has seen a 10–20% reduction in cool season
  (April–October) rainfall in recent decades.

Northern Australia likely to be wetter than average in coming months
The latest outlooks indicate an increased chance of above-average rainfall
across most of Northern Australia during November 2020 – February 2021.

Wet season rainfall for the 7-month period of the northern wet season (October
to April) is typically greater than average during La Niña.

Some parts of northwest Northern Territory and the central coast of Queensland
experienced their northern rainfall onset over the last week.

  © Ocean Racing Club of Victoria (ORCV)                                                    12
Weather for Sailors: Module 3 – Trans Ocean

Madden–Julian Oscillation to move into the western Pacific Ocean

A strong pulse of the Madden–Julian Oscillation (MJO) is currently over the eastern edge of
the Maritime Continent and is expected to maintain its strength and move into the western
Pacific Ocean over the coming days, bringing increased westerly flow and rainfall to
Northern Australia.

Indian Ocean Dipole
Sustained changes in the difference between sea surface temperatures of the tropical
western and eastern Indian Ocean are known as the Indian Ocean Dipole or IOD. The IOD
is one of the key drivers of Australia's climate and can have a significant impact on
agriculture. This is because events generally coincide with the winter crop growing season.
The IOD has three phases: neutral, positive and negative. Events usually start around May
or June, peak between August and October and then rapidly decay when the monsoon
arrives in the southern hemisphere around the end of spring.

Neutral IOD phase

Water from the Pacific flows between the islands of Indonesia, keeping seas to Australia's
northwest warm. Air rises above this area and falls over the western half of the Indian Ocean
basin, blowing westerly winds along the equator.

Temperatures are close to normal across the tropical Indian Ocean, and hence the neutral
IOD results in little change to Australia's climate.

Positive IOD phase

Westerly winds weaken along the equator allowing warm water to shift towards Africa.
Changes in the winds also allow cool water to rise up from the deep ocean in the east. This
sets up a temperature difference across the tropical Indian Ocean with cooler than normal
water in the east and warmer than normal water in the west.

Generally this means there is less moisture than normal in the atmosphere to the northwest
of Australia. This changes the path of weather systems coming from Australia's west, often
resulting in less rainfall and higher than normal temperatures over parts of Australia during
winter and spring.
© Ocean Racing Club of Victoria (ORCV)                                                  13
Weather for Sailors: Module 3 – Trans Ocean

Negative IOD phase

Westerly winds intensify along the equator, allowing warmer waters to concentrate near
Australia. This sets up a temperature difference across the tropical Indian Ocean, with
warmer than normal water in the east and cooler than normal water in the west.

A negative IOD typically results in above-average winter–spring rainfall over parts of
southern Australia as the warmer waters off northwest Australia provide more available
moisture to weather systems crossing the country.

© Ocean Racing Club of Victoria (ORCV)                                                    14
Weather for Sailors: Module 3 – Trans Ocean

Video Understanding the Indian Ocean Dipole
https://www.youtube.com/watch?v=J6hOVatamYs

© Ocean Racing Club of Victoria (ORCV)                  15
Weather for Sailors: Module 3 – Trans Ocean

Madden-Julian Oscillation - BOM
Madden-Julian Oscillation (MJO) is the major fluctuation in tropical weather on weekly to
monthly timescales. The MJO can be characterized as an eastward moving "pulse" of cloud
and rainfall near the equator that typically recurs every 30 to 60 days. The MJO phase
diagram illustrates the progression of the MJO through different phases, which generally
coincide with locations along the equator around the globe. RMM1 and RMM2 are
mathematical methods that combine cloud amount and winds at upper and lower levels of
the atmosphere to provide a measure of the strength and location of the MJO. When the
index is within the centre circle the MJO is considered weak, meaning it is difficult to discern
using the RMM methods. Outside of this circle the index is stronger and will usually move in
an anti-clockwise direction as the MJO moves from west to east. For convenience, we define
8 different MJO phases in this diagram. The numbered sectors in the box diagrams
correspond to the number areas in the world ocean diagram and show the progression of the
MJO around the world.

                             MJO – Weather Phases

                             • Eastward progression of high convection area
                               across ITCZ – high rainfall, thunderstorms
                             • Tracked by splitting into 8 phases, or areas

© Ocean Racing Club of Victoria (ORCV)                                                    16
Weather for Sailors: Module 3 – Trans Ocean The BOM video is recommended: Understanding the Madden–Julian Oscillation (MJO) https://www.youtube.com/watch?v=UsWHHE_jkGE. The Madden-Julian Oscillation is associated with weekly to monthly periods of enhanced and suppressed rainfall over parts of Australia. This climate influence is related to: The Australian Monsoon Tropical Cyclones Tropical Depressions The Madden-Julian Oscillation (MJO) is a global-scale feature of the tropical atmosphere. The MJO is the major fluctuation in tropical weather on weekly to monthly timescales. The MJO can be characterized as an eastward moving "pulse" of cloud and rainfall near the equator that typically recurs every 30 to 60 days. However, the signal of the MJO in the tropical atmosphere is not always present. MJO effects are most evident over the Indian Ocean and western equatorial Pacific. It influences the timing, development and strength of the major global monsoon patterns, including the Indian and Australian monsoons. Tropical cyclones Are also more likely to develop in association with certain phases of a strong MJO event. The MJO is associated with variations in wind, cloudiness, and rainfall. Most tropical rainfall comes from tall thunderstorms which have very cold tops. Thunderstorms that have cold tops emit only low levels of longwave radiation. Therefore, the MJO can be monitored by using satellite measurements of outgoing longwave radiation (OLR) to identify areas of cloudiness (low OLR) within the tropics. © Ocean Racing Club of Victoria (ORCV) 17
Weather for Sailors: Module 3 – Trans Ocean

The MJO has its greatest effect on the tropical areas of Australia during summer. It may
have some effect on parts of southern Australia, however this impact appears small when
compared to the effect on northern regions, and remains the subject of research.

The MJO can have an effect on the timing and intensity of "active" monsoon periods in
northern Australia. This can lead to enhanced rainfall - in both the intensity of the rainfall and
the duration of the rainfall. The following provide further information on the MJO:

   •   The Weekly Tropical Climate Note provides information on the current phase of the
       MJO.
   •   Technical information and maps relating to the Real-time Multivariate MJO Index,
       which is a way of monitoring the climate and weather variations caused by the MJO.
       Please note that this product is a research product, and as such is not always
       updated and may be under-going continual changes as it is developed.

Cyclone seasons

Cyclones off northern Australia typically develop between 5 and 15°S and reach maximum
intensity between 10 and 20°S. As they move further south they will weaken over land or, for
those remaining over water, weaken as they encounter an unfavourable environment
(strengthening wind shear) and move over cooler water. They usually increase in speed as
the steering winds in the mid-levels of the atmosphere increase and move to the south or
southeast.

Occasionally a cyclone moves south and interacts with a mid-latitude trough and undergoes
extra-tropical transition changing from a warm-cored tropical low to a cold-cored mid-latitude
low. The structure, distribution of winds and rainfall changes significantly. (Cyclone ITA April
2014)

Whilst the basics of cyclone development and behavior have not changed, the science and
modeling available to met bureaus has. They have much more long-range tools available
and a brief mention of some is useful. BOM Australia has dedicated website use instruction
and sections. An example follows later in this article. If you are in the cyclone prone area
November to April and away from internet services, there are radio and w/fx options.
Long range-, La Niña years have been correlated with an increased chance of wetter springs
and higher numbers of tropical cyclones during the cyclone season (November to April). Also
ENSO & MJO reports from the Bureau of Meteorology in their Tropical climate outlook. More
later explains.

Medium range- Keep a watch on the monsoonal trough and especially any lows that form on
it.
© Ocean Racing Club of Victoria (ORCV)                                             18
Weather for Sailors: Module 3 – Trans Ocean Short range-Radio & fx warnings, visual signs of cloud and swell. Swell waves trave l relatively fast and usually in this situation described as ‘oily, uncomfortable’. Cirrus cloud appears and tails point to location. The diurnal rise and fall of the barometer ceases. Normally near the equator, the barometer will have a low at 4am and at 4pm with a high at 10am and 10pm. If the barometer has not risen at 10am it means a 4mb drop! The diurnal change can be up to 4 mb near the equator but more likely towards 3 mb in danger areas. In Melbourne it is 1.2 mb (This is atmospheric tide, usually peaks 0400 & 1600) Use Buys Ballots law to determine the direction of the centre. In the Southern hemisphere stand facing the wind and the low will be at your outstretched left hand or slightly further back. If the wind is steady in direction, you are directly in the path of the system. If the wind backs, (moves anti-clockwise), the system will pass to your left meaning you are in the dangerous quadrant of the non-navigable semicircle. If the wind veers, (moves clockwise), you are in the navigable semi-circle and the system will pass on your right. Make sure some authority knows your intentions. Usually, if the system is moving S or SW, it will at some time curve towards the East and travel faster. In your contingency plans for the area should be at least a broadscale chart with suitable anchorages marked. Always remembering that storm surge can increase sea levels 3-6m above high tide and well above fringing reef. An ideal anchorage is protected from all quarters with a ‘soft’ shore of hopefully mud and mangroves. How do you prepare for a cyclone? Preparation is the key to surviving these storms. Any mariner visiting or living in the state should be aware what preparations are necessary when cyclone season arrives. There have been a few complaints about lack of preparedness by yacht owners and the need for cyclone contingency plans by marinas, but these plans already exist. Queensland's Department of Transport and Main Roads has comprehensive 'Extreme weather event contingency plans' (EWECP) available for every port that can be downloaded from the website (www.msq.qld.gov.au). As plans may differ from port to port, mariners should acquaint themselves with the plan for the port where they will be staying during cyclone season. Even experienced mariners should re-acquaint themselves with the requirements regularly. Marinas also have contingency plans: non-cyclone rated marinas will evacuate; cyclone- rated marinas have different cyclone contingency plans which dictate what actions boat owners/operators must take to prepare for the coming severe weather event while sheltering in the marina. As requirements may change from marina to marina boat owners should discuss such issues with marina management prior to a weather event. In Cairns for instance, any marinas that are not cyclone rated must be evacuated with boats seeking safety in the protective mangrove creeks of Trinity Inlet. © Ocean Racing Club of Victoria (ORCV) 19
Weather for Sailors: Module 3 – Trans Ocean

Cyclone contingency plans have been available from the Regional Harbour Master in Cairns
and also available from the marinas. They show a map of the area and advise mariners
where the various designated anchorages are located. Occasionally I have noticed boats
being left in Cairns Harbour during cyclones but MSQ states that anyone leaving their vessel
in the port area may be liable to prosecution and also be held accountable for any damage
their vessel may cause or incur to other infrastructure.

Insurance companies also have very strict requirements and these may differ from company
to company, so boat owners should familiarise themselves with their policy and be aware of
what is covered and what is not. Contact your insurance company and talk to them.
Too many people think that once they are insured they have no more responsibility but it is
not good enough to say, “I’m insured so it doesn’t matter what I do.” I have lost count of the
number of times I have heard similar comments when a boat’s been about to hit us. It
definitely does matter to the person whose boat is about to be damaged.

Note also, the ‘at fault’ vessel owner may have difficulties with his insurer if he/she has not
taken all precautions to prevent an incident.

Many complaints arise because the customer expects the companies to pay for absolutely
everything whether the boat owner took responsibility or not. The insured cannot simply wipe
their hands of any responsibility once they have paid their premium. They have an obligation
to do everything in their power to ensure the safety of their vessel. In the opinion of the
insurance reps I spoke to, removing sails, covers, awnings etc. is mandatory.
Insurance companies are not as concerned about the destroyed sail as they are about the
nearby boats that have been damaged, even destroyed, just because that headsail was not
removed. In winds of 140 knots even multiple lashings of rope will not hold up once the wind
gets under a corner or the smallest opening.

What to do if unfortunately in the situation.

Most insurance companies agree preparations should be made when staying in a marina.
Lighten the boat: turn off all seacocks to toilets, sinks and to the engine but place a note in
an obvious position noting the engine seacock is closed in case you need to start the
engine. Remove all sails, boom covers, awnings, clears etc. and any loose items on deck
and below. Secure all hatches and ports making sure they are sealed. Cupboard doors
should be secured.
Tie any mooring lines to multiple cleats or other substantial tie-off points, not just one. Drop
the anchor allowing lots of chain to go to the bottom: check with the marina that this is
acceptable to them. Some may not agree with this.

The DMR state in its EWECP: “if it is not possible to remove sails, self-furling sails and
covers, double wrap or tie these components in such a way that the wind cannot tease any
ends out and allow flapping of gear to commence.” However, my recommendation to those
who are insured is to do everything in their power to follow the dictates of their insurance
company.

The department’s plan also states you should ‘secure your tender. Ideally, tenders should be
stored in dinghy lockers, garaged or deflated and stowed if applicable. If stored with the
vessel, tenders should be securely lashed inverted on deck to prevent filling with water – do
not contemplate towing tenders. If left on purpose-built davits, tenders should be cleaned out
and securely lashed and bungs removed.’

Author’s note: because we shelter in mangrove creeks our dinghy is stored on davits; it is
emptied, the bow is raised as high as possible and the stern is left hanging low ensuring the
engine is out of the water. The bung is removed but, as even a leaf is enough to block the
bung hole, one side of the stern is positioned lower than the other so that accumulating
© Ocean Racing Club of Victoria (ORCV)                                                    20
Weather for Sailors: Module 3 – Trans Ocean

water can flow over one corner. Also, because we are on board, the outboard is left on the
dinghy in case it has to be deployed suddenly in an emergency.

Mariners should read the DMRs comments in full, particularly with regard to marinas. In part
it says “no guarantee can be given that the structures are capable of maintaining their
integrity in the complete range of extreme weather conditions.

Remember vessels are moored at owners’ risk and it is the owner’s prerogative to move
their vessel if they feel insecure in the marina.”
The department also recommends to double-up mooring lines, by running duplicated ropes
to alternative bollards. Do not run duplicates to the same bollards. The duplicate lines should
be in good condition and run slightly slack to ensure that they are only required to work in
the event of the chafing through the primary mooring lines.

Take particular care to protect against chafing. Ensure lines are made fast to substantial
boat parts, for example, mast steps, winches and so on, bearing in mind cleats are known to
have been torn out of decks. Do not use chain to secure your boat to pontoon bollards.
Chains have no ability to stretch.
If the master or owner elects to stay on-board, any mooring lines should be adjustable from
on board and sufficiently taut to ensure the vessel and pontoon move as one.”

For vessels unable to access a cyclone-rated marina, preparations for tying in a creek will be
slightly different: ensure your vessel is ready to move and you have heavy lines in good
condition,      the cockpit and decks should be clear and not cluttered. Have sufficient
supplies to last at least several days and    is your first aid kit fully stocked with plenty of
required medications. Fuel supplies should be checked, batteries fully charged, VHF and
commercial radios working.

When a warning is issued: double check supplies, lines, fuel etc.; keep an eye on the
weather, noting each position of the cyclone as given by the Bureau of Meteorology and try
to log its positions.

When it is time to head for your designated anchorage?

The authorities will keep all boaties updated on the status of the harbour via the VHF and by
SMS if requested. When the yellow alert is issued head to your designated cyclone
anchorage calmly and orderly. Common sense goes out the window if panic pays a call.

Enter your creek and find yourself a suitable spot to tie up. Choose a deep spot, preferably
in a narrow creek with heavy mangroves on either side to which you can tie your lines. Go
back as far as you can in the creek but you may find (particularly with multihulls) that when
width no longer allows you to go further back there is still plenty of depth for monos. In that
case, tie off to one side of the creek allowing enough room for monos to pass.

Once the creek is full, then tie off to the other side creating a web of lines and tie in securely.
Drop your main anchor in the middle and, if you wish, reverse back until you can drop a
stern anchor. Start running lines to the mangroves at 45 degrees from the fore and aft cleats
or other strong points on both sides. If you have cleats amidship run lines from these also.
The lines should be taken as low as possible to the largest and strongest part of the
mangrove.

Recommend running additional lines from fore and aft cleats crossing over the boat to
mangroves on the opposite sides of the creek i.e. lines from starboard cleats go to
mangroves on the port side of the boat plus the reverse process. The boat has then been
tied off in a web of lines which all return to the boat so that adjustments can be made as the
tide rises and falls.
© Ocean Racing Club of Victoria (ORCV)                                                       21
Weather for Sailors: Module 3 – Trans Ocean

Many people tie to the mangroves but these lines cannot be adjusted easily and may be
inaccessible when they need to be removed due to different tide heights. Chafing has never
been an issue as the drama is usually over within a day and the lines can be adjusted to limit
wear if necessary.

If you are in a wide section of creek, drop your anchors then rope the boat towards one bank
securing as close as possible without running the risk of damage from broken mangroves. I
must stress that only when all boats are in should you block the creek with your lines to the
other side and they should be removed as soon as all danger has passed. You must not
hinder the free movement of other vessels.
All soft awnings, clears, sails and boom covers are removed and all loose objects that could
become a missile are stowed safely away.

If solar panels can not be removed, covering them to avoid damage from flying debris and
lashing with rope may help protect them.

The wind will gradually strengthen and you will begin to surge on your lines. Check your
lines for chafe and holding before the wind becomes too strong. Ensure they are not getting
too tight. Remember tidal movement.

There will be plenty of rain so you can take this opportunity to fill your water tanks. If the
cyclone hits at low tide you will find that you have a lot of protection from the mangroves. If
the eye passes overhead there will be a period of calm. This is the time to take interesting
photos as the boats are reflected perfectly in the glassy water. But whatever you do, do not
untie your lines yet or move. Soon the wind will back and race in from the opposite direction.
This is when most damage seems to occur. What has been loosened can be ripped away by
the second onslaught.

It is important to keep listening to the VHF as well as TV and commercial radio for updates.

Once the cyclone has passed over it will generally turn into a rain depression. Mariners
should maintain a listening watch on VHF 16 and 12. There could be debris in the harbour in
which case it will remain closed until the Harbour Master deems it safe for boats to return to
their moorings and berths.

Under no circumstances must you leave your designated cyclone anchorage until
permission is given, then head back slowly and sedately. You never know what will be in the
water so proceed with care. If you decide to remain where you are for a while longer remove
all unnecessary lines so that vessels behind you can move if required. Another very
important thing to remember is that at all times during the cyclone including getting to and
from your designated cyclone anchorage you are in control of and responsible for, your
vessel. Despite regular practices of the past, this is not 'party time'.

© Ocean Racing Club of Victoria (ORCV)                                                   22
Weather for Sailors: Module 3 – Trans Ocean

Tracking and paths

© Ocean Racing Club of Victoria (ORCV)                  23
Weather for Sailors: Module 3 – Trans Ocean

There is a ‘standard’ path behaviour, but tropical revolving storms are not creatures who
follow the rules. The various met organisations have experienced people and all the
technology at their disposal. They are able to predict a cyclones path in a probabilistic
manner, however an often followed behaviour is to move westwards and slightly polewards
before either crossing land or heading eastwards and polewards. At the track vertex is often
where they are strongest. If they touch onto land and then turn out to sea, they intensify
rapidly. If they cross onto land, their source of warm moisture and thus energy is diminished
and they become a rain-bearing depression. If they continue polewards, they eventually
encounter the associated winds of the sub-tropical ridge belt which ‘cuts’ off their vertical
structure of a warm core. They may transition into an extra-tropical cyclone with a cool core
and continue curving polewards and to the east-wards. In our mid-latitudes down the
eastcoast and on to New Zealand.

© Ocean Racing Club of Victoria (ORCV)                                                 24
Weather for Sailors: Module 3 – Trans Ocean

Action to avoid a tropical revolving storm. First principle is to get as far to the side as
possible as the wind decreases the further out. Secondly aim to get behind it as it will roll
over you if anywhere in front and prolong the danger. Track speeds are variable but
averages are in the order of 10-12 kts. Do the maths. There are two sides to a cyclone one
being the navigable side and the other non-navigable. Use Buys-Ballots law to determine
which side you are on.
SH face the wind and low pressure (the centre) is approx. on your left
NH face the wind and low pressure is on your right.
SH Non-navigable side –sail on port tack.
SH Navigable side-sail on port gybe.
NH Non-navigable side-sail sbd tack.
Navigable side-sail sbd gybe.

© Ocean Racing Club of Victoria (ORCV)                                                 25
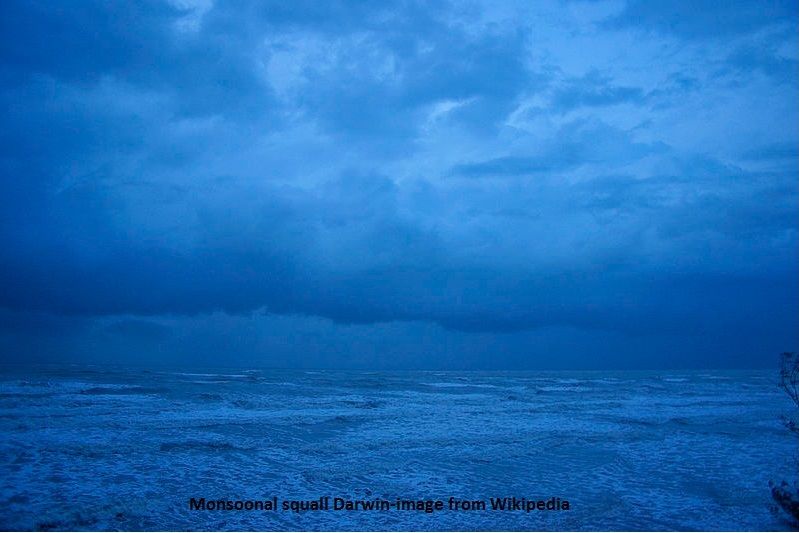
Weather for Sailors: Module 3 – Trans Ocean

Monsoon seasons
A monsoon is not just any heavy rain that lasts for a long time. Rather, a monsoon is like a
giant sea-breeze. A normal sea breeze changes daily, with the day-to-night change of land
temperature as the sun rises and sets; monsoons change seasonally. Most of the time
during the summer, the land is warmer than the ocean. This causes air to rise over the land
and air to blow in from the ocean to fill the void left by the air that rose. Rising air leads to
cloud formation and precipitation. These monsoon clouds that form are full of moisture from
the ocean, so they can produce heavy rainfall for long periods of time. Because the land
stays warmer than the ocean for most of the summer and the ocean is a constant source of
moisture, these heavy rains last for months at a time. A monsoon climate is marked by dry
winters and wet summers. About a quarter of the globe experiences a monsoon climate.

Asian-Australian monsoon – affects south-eastern Asia, the Australasian islands, and
northern Australia. This monsoon happens from December to March because these areas
are located slightly east of the opposite end of the Indian summer monsoon circulation.
Since these areas are south of the equator, December through March is their summer,
making this a summer monsoon, too.

Even if your weather isn’t directly affected by a monsoon circulation, your climate is.
Monsoons are very large-scale circulations that can simultaneously affect and be affected by
global climate. For instance, if El Niño is weak, the Indian summer monsoon is heavier than
normal. This could start a chain reaction throughout the atmosphere, causing stronger lows
and heavier rain to form downstream, or toward the east. These chain reactions that affect
weather patterns throughout the world are called global teleconnections.

Active Monsoon is characterized with deep westerly winds from at least the surface to
20,000ft with cooler temperatures and a moist troposphere. Thick sheet-like clouds in the
mid and upper levels with embedded cell-like convective clouds producing squally showers
and rain.

Break Monsoon (monsoon takes a break) has shallow westerly or easterly winds with
warmer temperatures and ‘dry slots’ in the troposphere. Isolated thunderstorms made up of
Cell-like cumulonimbus clouds which produce isolated regions of heavy rain.
Meteorological science is still developing with a connection apparent with Himalayan ice
under research.

© Ocean Racing Club of Victoria (ORCV)                                                     26
Weather for Sailors: Module 3 – Trans Ocean

Sailing in the tropics
Gradient level Wind Analysis is best used for the tropics and especially so for the northern
Australian coastlines where the very small pressure differences render conventional weather
maps of little use. Adjustment is required to reduce wind strength for friction 20% over sea
and 40% over land. Wind deflections for highs and lows also must be factored in for direction
varying from 10% near the equator and more further away. Up to 30%. In SH looking along
the direction of flow, deflection crossing the streamlines will be to the right. In the NH
deflection across the stream lines when facing along the direction of flow will be to the left.

The Gradient Level Wind Analysis is a snapshot of the geostrophic airflow near the surface
of the earth but above the friction layer. About 3,000 ft. It does not account for land effects,
sea-breezes or downslope winds. The arrowed lines are called streamlines and represent
the direction of the wind. The dashed lines are called isotachs, and connect points of equal
wind speed. The standard isotach intervals are 15 and 30 knots (28 km/h and 56 km/h) -
knots is the preferred unit for these charts as they complement the Bureau's marine
services. Adjustment is required for windspeed friction loss at surface (20%) and deflection
resulting-read above. Lows are marked with L, highs with H and E is for eddie.

Current Gradient Level Wind Analysis, twice daily, 00 UTC and 1200 UTC
Asian Region Gradient Level Wind

© Ocean Racing Club of Victoria (ORCV)                                                    27
Weather for Sailors: Module 3 – Trans Ocean

Black and white half domain charts are also available.
Asian Region Gradient Level Wind - Region A (Indian Ocean) west of roughly 123ᴼE

Another feature of the tropics is cloud height, due to the warmer conditions the atmosphere
is considerably less dense and the troposphere reaches some 15 km high or 45,000+ ft
approx.. Cloud structures fit within and condensation levels are therefore higher such that
clouds are towering structures. Sea breezes are also a feature off islands and many islands
are very steep razorback features eg. New Ireland. These islands have considerable
influence on wind patterns and currents. Another surprise for mid-latitude sailors is the
occurrence of warm fronts with cirrus clouds instead warning of light drizzle and winds.

© Ocean Racing Club of Victoria (ORCV)                                                28
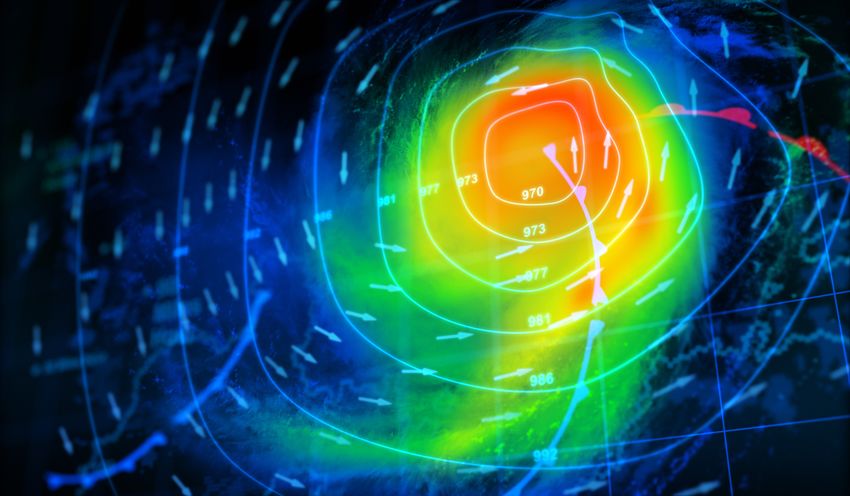
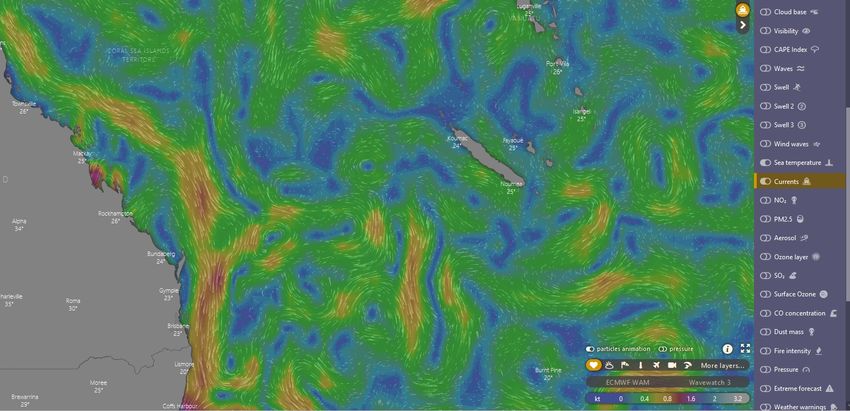
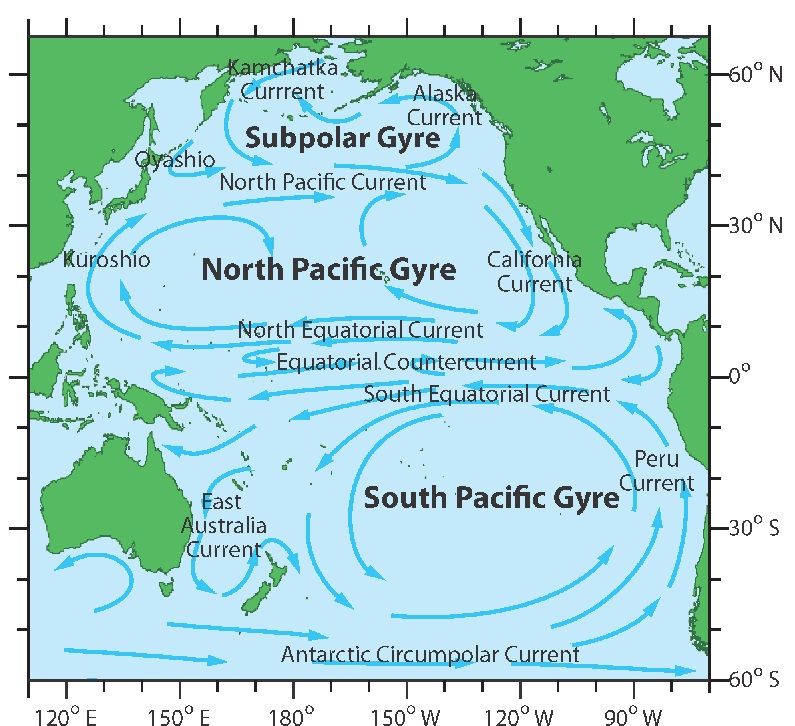
Weather for Sailors: Module 3 – Trans Ocean

Currents
There are many undersea features in the oceans and their presence needs to be
considered, obviously in terms of depth and influence on waves but more particularly on
currents. One thinks of an ocean as a smooth vast expanse of deep water with little concern
until land is neared. The reality is somewhat different. There are currents almost everywhere
with eddies and current fronts. Especially when deep water currents encounter undersea
irregularities, they can accelerate or be more one side than the other or be obstructed. The
currents can be of a thermal nature or wind driven or tidal closer to land.

Ocean currents can also vary according to broadscale climate influences such as El Nino
and La Nina. The undersea current circulations can also cause upwellings of cold water on
an irregular basis which has an effect locally. Bathymetry can also give similar effectsas in
atmospheric situations with divergence, convergence, accelerations and jets. The main
currents are well known and like all sciences, the development of new research is yielding
constant new information. In this regard Windy.com with their currents selection is
astounding but by its’ nature is not clear if the displays are current or based on permanent
flows but most likely are from satellite technology. To what degree they might be useful for
longer term forward planning is yet to be ascertained.

SEC - South Equatorial Current   NVI - North Vanuatu Jet         SVI - South Vanuatu Jet
NCI - North Caledonia Jet        SCI - South Caledonia JetNQC - North Queensland Current
NGCC - New Guinea Coastal Current               NGUC - New Guinea Under Coastal Current
EAC - East Australian Current    TF - Tasman Front                   TO - Tasman Outflow
EUC - Equatorial Under Current (Through Solomon Straits)EAUC - East Auckland Under Current
STCC - Sub Tropical Counter Current                              STF - Sub Tropical Front
WE – Wairarapa Eddy                                          ECC – East Cape Current

© Ocean Racing Club of Victoria (ORCV)                                                 29
You can also read