Online Air Monitoring with eNoses at the TATA Steel Plant in the Netherlands
←
→
Page content transcription
If your browser does not render page correctly, please read the page content below
79

                                                                                                                            A publication of

                 CHEMICAL ENGINEERING TRANSACTIONS
                                                                                                                     The Italian Association
VOL. 40, 2014                                                                                                      of Chemical Engineering
                                                                                                                            www.aidic.it/cet
Guest Editor: Renato Del Rosso
Copyright © 2014, AIDIC Servizi S.r.l.,
ISBN 978-88-95608-31-0; ISSN 2283-9216                                                                            DOI: 10.3303/CET1440014

Online Air Monitoring with eNoses at the TATA Steel Plant
in the Netherlands

Simon Bootsmaa*, Theo Leuwerinkb and Ilse Bilsenc
a
  Comon Invent, PO Box 39, NL2600 AA, Delft, The Netherlands
b
  Tata Steel Strip Products Mainland Europe, PO Box 10000, 1970 CA IJmuiden, The Netherlands
c
  VITO NV, Flemish Institute for Technological Research, Boeretang 200, 2400 Mol, Belgium
* bootsma@comon-invent.com

TATA Steel in IJmuiden is a fully integrated steel plant situated on the North Sea about 30 kilometres
northwest of Amsterdam, the Netherlands. The production route from raw materials to steel coils and slabs
comprises various processes including by-product manufacturing, and can be divided in three main
sections. In the first section, raw materials are converted in thermal processes into agglomerates, from
which hot liquid metal (pig iron) is produced. In the second section, liquid metal is purified in a steel plant
and casted into slabs, or into coils in a direct sheet. In the third and final section, the steel slabs and coils
are processed in a hot and cold mill and result in coils that finally are galvanised and/or painted for various
market sectors, e.g. automotive, construction, packaging and consumer goods.

The TATA Steel plant is located in a densely populated area, and has to comply with strict environmental
regulations. Emissions from TATA Steel may lead to complaints about odour, dust and noise from
residential areas. Since about 60% of the annual complaints are related to odour nuisance, TATA Steel is
forced by the regulating authorities in the Netherlands to investigate the various odour sources and their
contribution to nuisance. The project was executed in co-operation with Comon Invent and VITO. Comon
Invent has developed an online eNose technology for the evaluation of odour plumes in the field. The
Flemish Institute for Technological Research, VITO, is an acknowledged institute for olfactometry.

In 2010 a research project was started at TATA Steel IJmuiden to explore the opportunities of online
eNoses. The first phase of the program comprised a three-month field trial with a network of five eNoses
aiming at the detection of passing plumes and a thorough investigation of the odour emission from the
most dominant odour emission sources, which was performed according to the European standard EN
13725. During the sampling and in the laboratory testing the eNose signals were analysed against the
olfactometric results.

Based on the results of the field trail and the olfactometric testing the second phase of the program was
started in 2011. In this project the network was upgraded to twenty-five eNoses that were installed onsite
as well as in the surrounding communities. The primary goal was to investigate the ability of eNose
networks to track and trace odorous emissions that may lead to odour nuisance.

In 2014 the research continued with the comparison between gas dispersion profiling extracted from real-
time eNose data and classic dispersion modelling.

This paper details the results of the research and demonstrates the potential of this online eNose
technology in the steel industry comprising numerous diffuse and stack emission sources.

Please cite this article as: Bootsma S., Leuwerink T., Bilsen I., 2014, Online air monitoring with enoses at the tata steel plant in the
netherlands, Chemical Engineering Transactions, 40, 79-84 DOI: 10.3303/CET1440014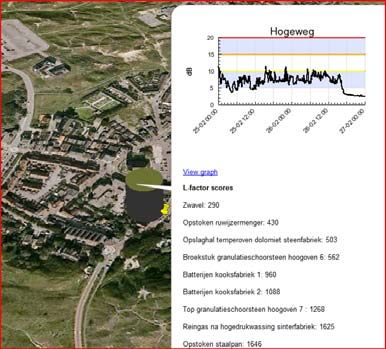
80

1. The online eNose
Electronic noses, in short eNoses, are compact instruments comprising a sensor array that responds to
small variations in the reactive gas concentration in ambient air. Industrial gas emissions often hold a
certain amount of reactive trace gases that can be detected by eNoses. Since the released trace gases
can possess some odorous content the eNose has a potential to detect presence of industrial odours in
the environment. The eNoses are online connected to a remote computer system via a wireless data
communications link. Software on the remote computer interprets the signals of the remote eNoses in real-
time. A software agent automatically triggers an immediate alert when the eNoses detect a change of the
ambient air composition that has the likelihood of being malodorous.

The interpreting software features two basic functions. First it detects if the air composition is anomalous.
In case of a detected anomaly, the software compares the pattern of the actual eNose recording with a
database with reference patterns. The patterns are called the fingerprint of the eNose for the exposed gas.
The reference fingerprints are the result of training sessions where the eNoses are exposed to known
gases. By using a least square method the actual fingerprint is analysed against the available references.
If an appropriate fingerprint is available, then the odour type of the reference fingerprint is assigned to the
actual recording. The eNose apparently smells the fragrance of the reference. The quality of the
references is decisive for the smell recognition potential.

Although pattern recognition is an essential property of the eNose, the anomaly detection is perhaps even
more important. This compares to our own sense of smell. People can recognize familiar smells, but can
certainly detect unknown scents.

1.1 Training of eNoses and testing the system under real-life conditions.
Training of eNoses is a process to link other information about the gas situation during the recording of the
raw eNose data. Various training methods are available. Milan et al. (2012) reported a method in the Port
of Rotterdam by investigating time and place correlations between eNose recordings and odour complaints
of annoyed citizens reported to the 24/7 manned control room of the DCMR EPA. In Rotterdam this
training method is sufficient because there were over 30 eNoses permanently installed in the odour impact
area of the Port of Rotterdam for more than three years. Additionally, the DCMR EPA has developed
advanced methods for complaint registration and validation. Not many EPA’s have such a sophisticated
methodology. Neither has TATA Steel. Therefore the time/place correlation method between eNoses and
odour complaints was less appropriate. In this study a training method was performed to compare the
eNose recordings using dynamic olfactometry.

For training purposes gas samples were taken at the most relevant odour sources of the TATA Steel plant
in IJmuiden. The odour concentration of the samples was determined according to the European standard
for dynamic olfactometry, EN-13275, in the odour laboratory of VITO in Belgium. Next to the standardized
measurements, the sensitivity curve and odour threshold of the eNose for the different samples was
determined. The training resulted in the creation of a set of reference fingerprints of relevant TATA Steel
odours.

Events of odour annoyance in residential areas around the TATA Steel plant in IJmuiden were analysed
using this set of reference fingerprints. For this testing a dataset was collected that contains the complaints
of annoyed citizens, including the GIS-coordinates and timestamp, and the raw eNose data of the twenty-
five eNoses that were partially installed onsite the TATA Steel plant and partially in the communities. The
dataset also includes the wind direction recorded by five wind-vanes installed onsite the TATA Steel plant.
The dataset covers all recordings between Jan 1, 2012 and Dec 31, 2013. The time resolution of the
eNose and wind data is one minute.

1.2 Real-time monitoring
The eNose network is currently operational at TATA Steel. Each time one or more eNoses detect an
anomaly the system triggers an alert on a dashboard. The alert warns about the anomaly and refers to the
odour type of the best fitting reference fingerprint. The dashboard is online and updates automatically with
a one-minute refresh rate.
81

2. Results

Before explaining the results of the TATA steel project, a short introduction on the eNose signals is
presented. The eNose that was used for this research has an array of four semiconductor gas sensors.
The principle of operation of this type of sensors is that the surface charge of the activated semiconductor
layer depends on the total concentration of reactive molecules in its vicinity. A change in the reactive gas
concentration results in measurable change of the sensor signal.

The eNoses have four semiconductor sensors. Although the basic semiconductor layer of all four sensors
is the same, the manufacturer added some dopant material in the layer. As a result the electrical
characteristics of all four sensors are different of exposure to the same gas. This is demonstrated in the
graph below where an eNose was exposed to Toluene using a step function. The eNose was exposed to a
dosed concentration of 2 ppb to 32 ppm. Each step the dose was doubled. The squares in the graph show
the dosed Toluene concentration plotted on the right axis. The curves show the response of the four
sensors. The graph shows that Toluene has the strongest effect on S1 where the response of S3 is the
smallest.

The response of all four sensors together is called the fingerprint of the eNose for the exposed gas.
Derived from the graph above the fingerprint of the eNose for 10 ppm Toluene is plotted below.

Similarly, the responses of the eNoses for the sampled odour sources at the TATA Steel were determined.
For this process odour samples were taken at each relevant odour source on the TATA Steel plant in
IJmuiden. At VITO the field samples were exposed to the eNose using the step function method. The
graph below shows 6 of the 16 explored fingerprints.
82
3
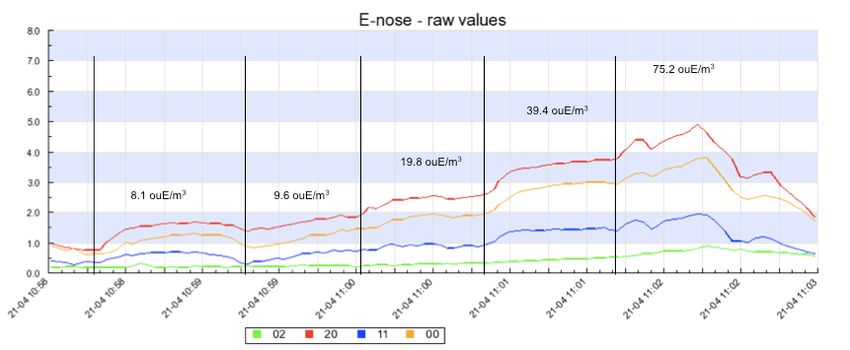
2.1 Sensitivity curve of eNose: sensor signals = f(odour concentration) ouE/m
The graph below depicts six peaks that show the response of the odour samples taken at the stack of the
sinter plant. The sampling was performed in duplo. The first three peaks refer to the first sample and the
last three to the second sample.
The graph below is a zoom shot of the results of the first two-step functions. The eNose is exposed to a
3
dosed dilution of the sample air in a concentration from of 0.1 to 10.2 ouE/m . The graph demonstrates that
3
the odour threshold of the eNose for this sample ranges between 0.7 and 1.5 ouE/m . The graph shows a
good repeatability.
From this result it can be concluded that the eNose apparently matches to the sensitivity of the human
3
nose for the sinter plant odour. The eNose level threshold for n-Butanol is also 1 ouE/m . Unfortunately that
doesn’t apply to all odours. All odours are reactive, so the eNose responds to all odours. However, some
are odours that are annoying at such low concentrations that they cannot be detected by the sensors of
the eNose.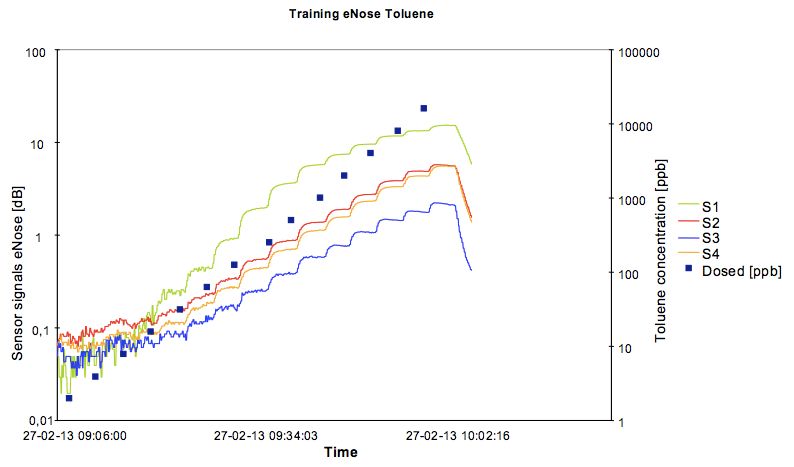
83
The graph below is a zoom shot of peak three. Now the sensitivity curve is determined between 8 – 75
3
ouE/m
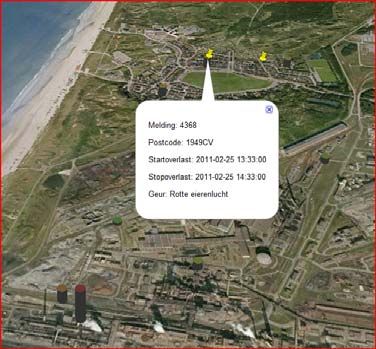
Below the fingerprint is plotted for one of the odour sources. In this case the odour concentration was 246
3
ouE/m . The graph is plotted of one of the eNoses that is installed in the field. Based on the wind direction
it is plausible that the eNose was influenced by emissions from this specific odour source. This fingerprint
shows similarities with the odour source, such as provided by the laboratory testing at VITO. Assuming the
eNose in the field responded to this source there is a reason to believe that between 8:00 and 12:00 AM
3 3
the eNose recorded peak values ranging between 200-300 ouE/m and between 100-200 ouE/m between
12:00 and 17:00 hours.
The eNose is 1750 meters downwind from this emission source. Based on the eNose signals, the wind
recordings and the presumed odour concentration that is based on the reference values of the laboratory
measurement, we are able to calculate the released amount of odour at the source. Now we can use this
value as input parameter in a dispersion model to determine the dispersion profile of this odour emission.
This two-step process is a mix and match of inverse and forwards dispersion modelling.84
2.2 Comparing eNose readings to odour complaints
The fingerprints such as provided by the laboratory testing of VITO, are entered as reference fingerprints
in the odour database. By analyzing the odour complaints with the eNose recordings the odour recognition
feature was evaluated. On Feb 25, 2011 some complaints were recorded. The people described a rotten
egg smell. The eNose that was in the same area smelled a sulphur smell at the same time. In this case the
eNose recording positively matches to the complaints.
Equivalently, 11 episodes with a total 63 complaints have been analysed. For six events there was a
positive match. In four cases the match was not evident. For one event no match was found.
3. Conclusions
The project at TATA Steel IJmuiden has demonstrated the eNose’s potential for the detection of the raise
and spread of TATA related odours in the environment.
Fingerprints are generated using air samples that are taken at odour sources and analysed by dynamic
olfactometry and eNose. Some fingerprints of TATA Steel relevant odour sources are very distinctive,
others aren’t. The eNose has sensitivity to some odours that matches to the human sense of smell, but
there were also odours for which the eNose is not very susceptive.
The testing of the set of reference fingerprints that were provided by the laboratory testing of VITO has
demonstrated positive matching with complaints of annoyed citizens.
The current research focuses on the mix and match of inverse and forward modelling with the eNose data
and dispersion models
References
Air quality - Electronic air monitoring - Odour (nuisance) and safety, Netherlands Standardization Institute,
NEN:NTA 9055
Bootsma S.K., Milan J.B., (2011) eNoses as a tool for online odour management, lecture number 5.5, IWA
4th Conference on Odour and VOCs
Bootsma S.K., Milan J.B., (2010) Odour monitoring with eNoses in the Port of Rotterdam, Chemical
Engineering Transactions, 23, 147-152, DOI: 10.3303/CET1023026
Milan B., Bootsma S., Bilsen I., (2012) Advances in odour monitoring with eNoses in the Port of
Rotterdam, Chemical Engineering Transactions, 30, 145-150 DOI: 10.33003/CET1230025You can also read