OPPORTUNITIES AND CHALLENGES IN PARTITIONING THE GRAPH MEASURE SPACE OF REAL-WORLD NETWORKS
←
→
Page content transcription
If your browser does not render page correctly, please read the page content below
O PPORTUNITIES AND CHALLENGES IN PARTITIONING THE
                                                 GRAPH MEASURE SPACE OF REAL - WORLD NETWORKS

                                                                     Máté Józsa                                              Alpár S. Lázár
                                                               Department of Physics                             Faculty of Medicine and Health Sciences
                                                              Babeş-Bolyai University                                   University of East Anglia
arXiv:2106.10753v1 [cs.LG] 20 Jun 2021

                                               M. Kogălniceanu nr. 1, 400084, Cluj-Napoca, Romania                      NR4 7TJ, Norwich, UK

                                                                                            Zsolt. I. Lázár
                                                                                         Department of Physics
                                                                                        Babeş-Bolyai University
                                                                         M. Kogălniceanu nr. 1, 400084, Cluj-Napoca, Romania
                                                                                      zsolt.lazar@ubbcluj.ro

                                                                                              June 22, 2021

                                                                                              A BSTRACT
                                                  Based on a large dataset containing thousands of real-world networks ranging from genetic, protein
                                                  interaction, and metabolic networks to brain, language, ecology, and social networks we search for
                                                  defining structural measures of the different complex network domains (CND). We calculate 208
                                                  measures for all networks and using a comprehensive and scrupulous workflow of statistical and
                                                  machine learning methods we investigated the limitations and possibilities of identifying the key
                                                  graph measures of CNDs. Our approach managed to identify well distinguishable groups of network
                                                  domains and confer their relevant features. These features turn out to be CND specific and not unique
                                                  even at the level of individual CNDs. The presented methodology may be applied to other similar
                                                  scenarios involving highly unbalanced and skewed datasets.

                                         Keywords real-world networks · network classification · null models · network dataset · discriminating features

                                         1   Introduction
                                         It is becoming a popular belief that the present century is about complexity [1]. Network science appears to be the
                                         philosopher’s stone of complex systems as they not only offer important insights into previously intractable systems but
                                         they also represent the primary tool in answering highly critical questions ranging from human resource management in
                                         a company, to cascading power network failure or drug design [2, 3]. In its basic form the network model is made of
                                         elements of utter simplicity, nodes representing constituents or states of the system and edges depicting interactions,
                                         relationships or processes involving two such elements. These simple ingredients can give rise to practically limitless
                                         configurations, referred to as the network’s topology, which can be mapped to concrete or abstract realizations of
                                         systems and phenomena. In recent years the number of network measurables has grown steadily, propelled by the
                                         fast paced buildup in the corpus of available data [4] backed up by the unyielding Moore’s law and equivalents on
                                         computational, transmission and storage capabilities. Node degree, the number of first neighbors reachable from a
                                         given node, and the large scale properties of its distribution are sufficient for grasping the essence of certain types of
                                         network and the systems they model. Universal laws governing the evolution of widely different systems have been
                                         discovered relying on this simple measure [5, 6, 7, 8]. Exploring the role of cliques, i.e., fully connected subgraphs,
                                         appears to be the right approach in studying for example the structure and functioning of the human connectome
                                         [9, 10]. The quantitative description of other systems requires network measures of varying degree of complexity
                                         and intuitiveness. Prominent examples include concepts like small-world-ness of social and web networks [4, 11],
                                         modularity, hierarchical clustering, special motifs and robustness in the study of cellular networks, like metabolism or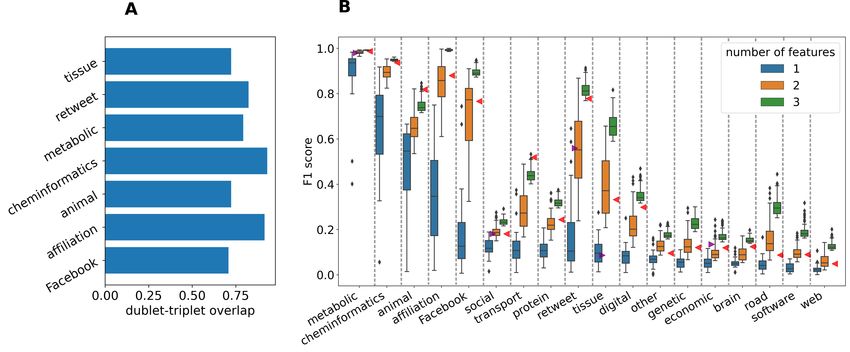
A PREPRINT - J UNE 22, 2021

protein-protein interactions [12, 13, 14, 15, 16, 17, 18], as well as cycles and k-core distributions responsible for the
stability of the vascular system of leaves, different ecological systems or financial networks [19, 20, 21, 22]. Some
dynamical processes on networks can be mapped to synchronization phenomena [23, 24], which can be characterized
by the ratio of extremal values of the Laplacian matrix of the network. The interplay between global, local and
asynchronous phases are influenced by the degree correlations in the network which also affects its controllability
and percolation properties [25, 26, 27, 28, 29, 30, 31, 32]. Epidemic, rumor and information spreading in biological,
social and technological networks are affected predominantly by the properties of the underlying connectome [33].
For instance, the leading eigenvalue of the probability transition matrix is related to the speed of the dynamics on the
network [34]. Different centrality measures were proposed to identify important nodes of the networks in various
scenarios [35, 36]. An important body of research involving network science targets the understanding of mechanisms
behind the formation, and evolution of real networks. A typical approach starts off from common sense premises
on the relevant elements and processes of the modelled complex systems and assumes some foreseeable effects on
various network measures. In many cases, however, it is not trivial, which are the network features to look at. It is
also common practice to compare real networks to null models created by constrained randomization of the network
[37]. Nonetheless, due to the inherent biases of the different techniques the results appear to tell us not so much about
the networks themselves as about the interaction of the randomization process with the particular network topology
that is being investigated. Recent advances in creating null models, such as in [38, 39], avoid blatant biases given a
specific constraint, like keeping the degree sequence, e.g., with the configuration model, the Havel-Hakimi algorithm or
degree preserving randomization [35, 40]. Yet the question remains as to which is the right set of measures to be kept
constant in the different real-world scenarios. In summary all the above mentioned methods try to capture specifics of
complex network domains (CNDs) without comparing them directly with other CNDs. Our work is based on the view
that in order to exploit the potential of network theory in the study of a complex system one first has to identify the
distinctive properties of the underlying network. In other words connections between the system’s defining properties
and its network measures should be formulated in light of the relationships between other classes of real networks and
the same network measures. Here we propose to identify the network measures that best define the different types
of real networks. These expectations were also formulated by Costa et al [41]. There the authors offered detailed
instructions on the classification procedure in terms of the data analysis methods popular at the time. Later research
shows that there are network measures that can identify certain types of real-world networks with a relatively high
accuracy [42, 43]. Rossi and Ahmed [42] investigated 530 real-world networks along with 483 synthetic networks,
using 11 graph measures. They concluded that in general networks are already distinguishable using only three or
four measures. Another work is based on 986 real-world networks and 575 generated ones and 8 descriptive features
[43]. There, the authors determined pairs of measures that optimally separate the different types of network domains
based on the feature importances returned by the Random Forest supervised classification algorithm. In this work we
present a comprehensive analysis which aims to provide a tool for answering the question to what extent and under
what circumstances there is an optimal parameter space of the real-network that one wants to examine. Our focus is the
space of those network structure measures wherein CNDs form distinguishable regions. Following Rossi and Ahmed
[42] our primary indicator will be the performance scores of supervised classification models. We emphasize, however,
that “recognizing” network domains represents the means rather than the goal. Therefore the study is limited to simple
graphs and non-trivial network measures. By trivial measure we mean one that is obvious to the naked eye, e.g., most
of the brain networks in the data set are excessively large while the edge density of road networks are conspicuously
below average due to their geometric nature. For the same reason our networks are stripped down to undirected and
unweighted edges as these extra degrees of freedom would shadow the structural properties of interest. Generated
(random) networks such as Erdős-Rényi or Barabási-Albert are shown to be easily distinguishable from real networks
[42]. Thus present work will not cover them. Instead of arbitrarily picking fashionable network measures we employ a
systematic methodology for discovering these. Also we use an up-to-date machine learning methodology in order to
avoid several pitfalls. We attempt to lay out a route that can help those struggling with such highly unbalanced and
skewed data as that of graph measures in a real-world network scenario. In the following the terms CND and (network)
domain, group or class will be used with equivalent denotation. Similarly graph measures will be also referred to as
network features or structural properties.

2   Methodology

In order to extract the relevant properties of CNDs we pursued the following scheme: collect raw network data from
public repositories, standardise them by applying a systematic preprocessing procedure then select the relevant features
specific to each CND by the machine learning framework developed for this purpose based on consecutive filtering and
wrapping procedures (See Section 2.4.1 and 2.4.2) [44].

                                                           2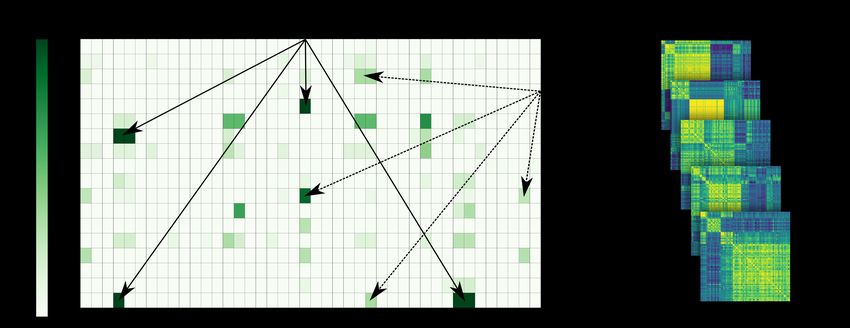
A PREPRINT - J UNE 22, 2021

Figure 1: Number of networks used in the study. Groups with less than 10 elements are collected under the name
“other”. Its content is detailed on the right hand side of the figure. The meaning and origin of different network groups
are explained in Table S1 in the Supplementary Material.

2.1   Raw network data

We compute 208 different topological network measures on 4367 real-world networks from 27 different domains (Figure
1). These networks originate from Network Repository (http://networkrepository.com/) [45], BioGRID (https:
//thebiogrid.org/) [46], BioModels (https://www.ebi.ac.uk/biomodels/) [47], transport networks (http:
//transportnetworks.cs.aalto.fi/) [48] and the CommunityFitNet corpus [49] from the Index of Complex
Networks (ICON) (https://icon.colorado.edu/). Groups with less than 10 elements were aggregated into the
group named “other”. The collected and preprocessed data is made available online at https://github.com/
MateJozsaPhys/CNDinvestigation. Data sources, algorithms and missing values are indicated therein. The highly
unbalanced nature of the dataset can be observed by comparing the broad range of sizes on the logarithmically scaled
axis in Figure 1.

2.2   Preprocessing

We converted the collected networks to undirected, unweighted graphs, without parallel edges or self-loops and only
retained the giant component. Bipartite graphs were replaced by their one-mode projections. These simplifications
offered multiple benefits. In line with our main objectives it preserved only information on their “pure” non-trivial
topology while extending the range of applicable network measures.

2.3   Quantitative analysis

We limited ourselves to network measures that are easier to implement and computationally not overly costly. The
208 calculated topological measures include both global and local properties. The node/edge-level measures were
transformed to global measures by taking their average, minimum-, maximum values and their moments up to order four.
Moments were calculated after normalizing the distribution by dividing it by its maximum value. The computational
complexity of measures depends on a variety of topological descriptors, like the number of nodes, density of edges,
or the average of path lengths, and so on [36]. By upper limiting memory usage and computational time a valid
measure was returned in 99,8% of the runs. Networks missing more than 20% of the 208 measures were removed
from the dataset. Similarly, features not calculated for at least 80% of the networks in a domain were discarded
altogether for the given domain (Figure 2A). In the other cases missing values were compensated for by imputation on a
domain-by-domain basis. It is common to use a fixed value such as the domain mean or the median [50, 51]. However,
in our case this method would produce spurious markers of the domain that would mislead the classification algorithm
and would make the identification of the group trivial. Therefore missing values were replaced by random numbers
distributed uniformly between the first and third quartiles of the valid values for the particular domain. Given the very
small ratio of missing values their effect is negligible. Also, to avoid the above mentioned trivial classifications along

                                                            3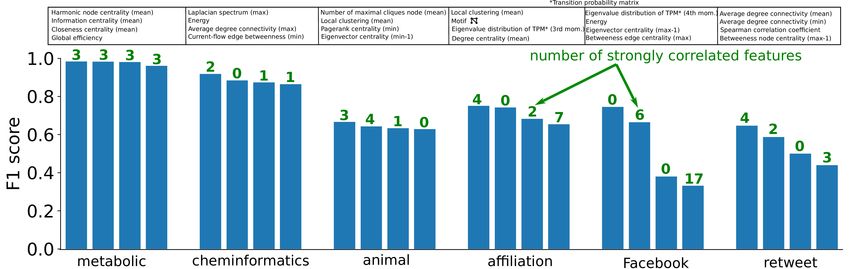
A PREPRINT - J UNE 22, 2021

Figure 2: A) Illustration of handling missing data in the dataset. The lightness of the color of squares associated with
a domain-feature pair represents the ratio of missing values. Features not calculated in more than 20% in the given
group were discarded. In all other cases missing values were replaced by uniformly randomized values between the first
and third quartiles of the distribution of valid values for the given group-feature pair. B) Feature-to-feature Pearson
correlation matrices showing the differences in correlations among all 208 features. Lighter colors represent higher
correlation coefficients. Each correlation matrix corresponds to a CND and is clustered by hierarchical agglomeration.
One can notice the fundamental differences in the correlation patterns by comparing the sizes and distribution of
clusters.

constant dimensions, we removed all features that had more than 80% constant values inside a CND. As a result the
number of features was reduced to 164. Features which were constant in more than 80% of cases, for instance structural
holes, were also discarded [4]. The measures calculated in the study are summed up in Table S2 in the Supplementary
Material, explaining the abbreviations and providing information on their implementations.

2.4     Feature selection

The number of network measures and that of the networks is comparable requiring a drastic reduction in the former.
Because of the intrinsic connections between measures, for instance, cliques occur in larger size and number in denser
networks, and for better interpretability the number of features again has to be reduced. To that end we applied two
subsequent fundamental feature selection methods. First the computationally less expensive filtering followed by
wrapping. While filter methods characterize the intrinsic properties of data in the absence of a classifier, wrapper
methods measure the relevance of features based on the performance of a supervised classifier [44]. By choosing
appropriate learning algorithms the negative effect of correlations in the data can, to a large extent, be mitigated (see
Section 2.4.2). However, reducing correlations is also an important means in finding dominant topological features.
Here we consider both linear and non-linear correlations as intrinsic indicators for the filtering (see Section 2.4.1) and
the Random Forest classification model will constitute the core of the wrapper.

2.4.1    Filtering
Interestingly, despite the general mathematical connections between network features the correlations exhibit no
universality. The feature-to-feature Pearson correlation patterns in Figure 2B show fundamental differences across
groups. Therefore the filtering was made separately for each group of networks. Linear correlations were reduced by
removing one from each pair of features with a coefficient bigger than 0.9. Subsequently, non-linear correlations were
cut down by repeating the above procedure using Spearman correlation coefficients. The number of retained features
was between 21 and 48 depending on the group.

2.4.2    Wrapping
Consistent with our objective to discover the distinguishing properties of a CND from others we applied a One-vs-Rest
classification scheme. After testing a variety of competing supervised learning classifiers including Logistic Regression,
Support Vector Machine and K-Nearest Neighbour classifier we conclude that Random Forest is the most suitable

                                                            4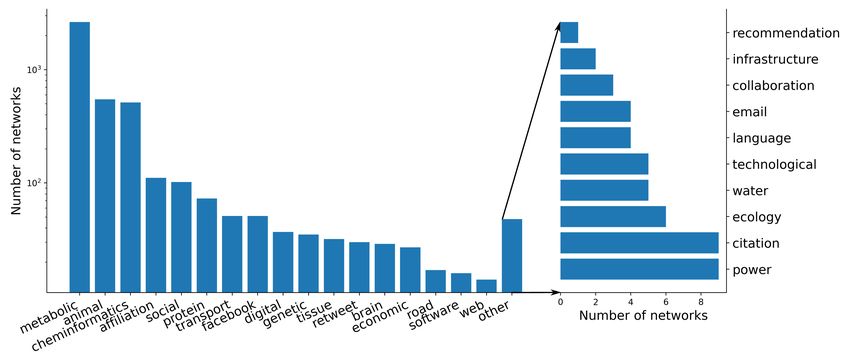
A PREPRINT - J UNE 22, 2021
Figure 3: Illustration of the modified forward selection procedure. First, the model is fitted with each of the features one
by one (left panel). The best performing 15 features are combined into all possible doublets and triplets. The model is
then fitted separately with each of the proposed combinations of features. Cross validation is repeated three times and
averaging over all splits is applied. The figure illustrates the case of affiliation networks.
for a highly nonlinear and unbalanced One-vs-Rest classification setup applied here [52, 53, 54, 55]. The parameters
of Random Forest could be relatively easily tuned for optimal behaviour as opposed to other models. In order to
avoid overfitting the maximum depth of a tree was set to three.he number of trees in the forest were chosen to be 100.
Balancing over subsamples of trees was applied to moderate the effect of class imbalances (see Figure 1). As a check
we repeated the classification procedure using undersampling, i.e., including only a subset of elements (networks) from
the larger classes (CNDs). In most cases we obtained only small perturbations in the results ruling as unjustified the
loss of valuable data due to undersampling. The performance of the classifier was estimated through the F1 score, the
harmonic mean of precision and recall values, being a good alternative for the popular ROC AUC (Area Under the
Receiver Operating Characteristic Curve) score which appears not to capture the true performance of the minority class
(the “One” in the “One-vs-Rest”) in highly unbalanced scenarios [56]. To improve the generalization power of our
model the F1 scores were calculated applying repeated stratified k-fold cross validation, with five folds, repeated three
times [54]. Let us recall the original motivation behind the pursued classification task, namely, obtaining a handful
network measures that may help in understanding the modelled complex system. As such we limit our query to no
more than three distinguishing features per CNDs. To take advantage of the strength of both popular feature extraction
methods, i.e. the bottom-up forward selection and the top-down backward elimination, we used a new, modified forward
selection [44]. The method used here differs from the original forward selection method in that it does not derive feature
triplets from pairs, rather both are constructed from the first 15 elements based on their F1 scores in one dimension
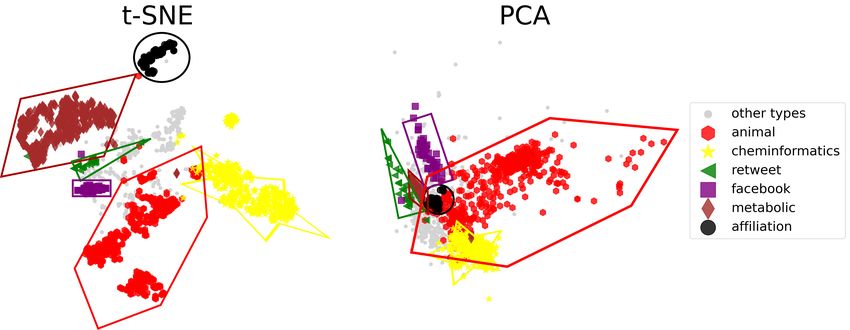
(Figure 3). As a consistency check and a study of the modified forward selection method we estimated the overlap
between the high performing feature pairs and triplets. This was done as follows: the first 10 feature doublets were
selected and completed to triplets, each pair being combined with the remaining 13 features, producing 130 triplets.
The size of the intersection of the so-obtained set with the best performing 130 triplets expressed in percentage can be
interpreted as a measure for the consistency of the procedure (Figure 5A).
2.5 The perspective of unsupervised learning
One can discover intrinsic properties of the data also by applying dimensionality reduction techniques. For a dataset
that has so many nonlinear properties the unsupervised learning method t-Distributed Stochastic Neighbor Embedding
(t-SNE) seems a more appropriate tool as opposed to the popular Principal Component Analysis (PCA) [57, 58].
Figure 4 demonstrates the clear superiority of the nonlinear method. On the downside, however, one cannot interpret
quantitatively the distances between groups in the embedded space. Moreover the output depends sensitively on the
parameter known as perplexity related to the average size of the clusters. For a proper operation perplexity has to be
tuned on a case by case basis. Given the above particularities of the unsupervised classification methods they did not
contribute to the final results.
3 Results
Comparing the two-dimensional mapping of PCA and t-SNE on Figure 4 suggests that the data has many nonlinear
relations thus nonlinear partitioning is to be favored over linear methods. The results of the filtering described in Section
5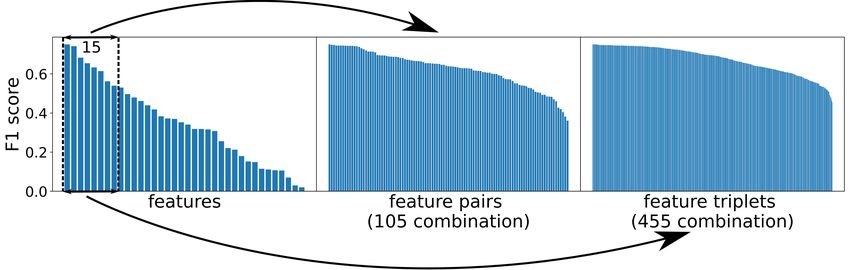
A PREPRINT - J UNE 22, 2021

Figure 4: Illustration of the embedded and projected space from t-SNE unsupervised classification and PCA into
two-dimensions. Here the perplexity value used by t-SNE was 30. Also the elements of the groups were limited to 500
by random undersampling so that the dataset is not dominated by the largest group. The groups which are seemingly
well separated are marked with polygons. One can notice here that t-SNE can capture better the intrinsic properties of
the data in contrast to PCA. This can be explained by the fact that the abundance of nonlinearities in the dataset makes
the classification impossible with a linear model like PCA.

2.4.1 show a strong domain dependence of the feature-feature correlations (see Figure 2B). After reducing the number
of strongly correlating (CP earson > 0.9) features we cannot come up with a feature set which even remotely suits all
network groups. Modest correlation values between the measures proposed in [42, 43] and the features emerging after
our procedure suggest that indeed the set of relevant features can be fundamentally different at the level of individual
CNDs. According to the nonlinear t-SNE unsupervised data reduction technique there are network domains which are
well separable in low dimensions (Figure 4). Complementing this with the appropriate nonlinear supervised learning
algorithm and the right choice of parameters and scores described in the methodology one can nominate a few “well
behaving” networks. These are the metabolic-, cheminformatics-, animal interaction-, affiliation-, Facebook-, retweet-
and tissue networks. The classification score of these CNDs exceeds 0.7 in dimensions less than three (Figure 5B)
suggesting the existence of characteristic structural properties. The associated measures, however, are not unique but
replaceable with strongly correlating ones. Also in most of the cases, except for Facebook networks, the best measures
do not stand out clearly from the rest, rather the score values are gradually decreasing (Figure 6). Note here also that
the definition of relevant features is dimension dependent. In three dimensions one can get completely different leading
features than in two dimensions, leading to the underperformance of the original forward feature selector (Figure 5A).

4   Conclusions

Many emergent phenomena in complex systems can be understood through the mathematical indicators of the underlying
network topology. Each complex system has its own characteristics and these are connected in nontrivial ways to
the structural properties of the associated network. The preference of authors for certain mathematical indicators
over others for describing complex networks often lacks clear justification and appears to follow changing trends.
One of the aims of the current work is to capture these measures in action, and investigate their true relevance. We
started from the premise that the defining topological measures of a CND should perform well when employed
by a classification algorithm. Multiple previous research on network classification were based on fewer network
domains and performed the classification using an arbitrarily chosen subspace of network measures [42, 43]. In the
current work a more heterogeneous dataset and a much more complete feature set is used. A consistently constructed
machine-learning methodology was applied on topological measures extracted from a large number of real networks.
Information on the directionality of edges, weights, temporality, signs, multi-edges and multiple components were
ignored. Bipartite networks were replaced by one-mode projections. The two-dimensional output of unsupervised data
reduction algorithms, like the popular linear PCA and the non-linear t-SNE, indicate strongly nonlinear relationships
between the network measures and producing a very skewed and complex distribution of points in the feature space.
Correlation tests suggest that these relationships are also highly domain dependent thus relevant features should only be
defined relative to individual network domains. A modified forward selection method was applied which combines the

                                                           6
A PREPRINT - J UNE 22, 2021
Figure 5: Results of the network classification in up to three dimensions according to the modified forward selection
method described in Section 2.4.2. A) Extent to which the best performing feature triplets encompass the best
performing feature pairs. One can notice that the percentage of overlapping is dependent on the CNDs, indicating that
the original forward feature selection would fail in some cases to determine the best feature triplets. B) Distribution of
F1 scores resulting from the fitting with different combinations of one, two and three features. In the case of two and
three-dimensions only the best 100 scores are represented. Red triangles represent the scores of the triplets used in
[42] while purple triangles mark the performance of feature pairs used in [43]. The distributions are characterized by
medians and quartiles, occasionally with outliers. The groups are arranged from left to right by the median of the F1
score of the classification by a single feature. One can distinguish the “well-behaving” networks, which are separable in
this scenario, i.e. the F1 score of classification exceeds 0.7 (well above random classification).
Figure 6: Distinguishing features of CNDs discernible by a single feature. Text boxes contain the names (top to bottom)
of the defining feature singlets with F1 score bars below (left to right). Green numbers indicate the number of other
features that highly correlate (CP earson > 0.9) with the nominated feature. Table S2 contains comprehensive details on
all features including their implementation.
7A PREPRINT - J UNE 22, 2021
advantages of the two alternative methods in machine-learning, forward-selection and backward-elimination. Our results
show that many network groups are structurally distinguishable using their raw topology, and up to three mathematical
descriptors. These network domains include metabolic-, cheminformatics-, animal interaction-, affiliation-, Facebook-,
retweet- and tissue networks. Future research should compare the relevant measures obtained here with the measures
determined by null models. Contrary to previous results the existence of a universal feature set which can identify any
type of real network cannot be confirmed. The prominence of leading features is also domain dependent. For instance,
Facebook networks have two relevant features, while metabolic networks are equally separable from the rest based
on a large number of features. Note, however, that this result should be taken with a grain of salt. Obtaining a high
classification score does not exclude the overlap of the domains in the feature space. If a class is densely crammed into
a small subspace it becomes easily “recognizable” even though other classes populate the same region. This can lead to
spurious results for redundant datasets. For instance the genome scale metabolic networks are the full biochemical
maps of different organisms and are constructed from metabolic pathways which are common among many phenotypes,
resulting in redundancy of this type of networks. Also the classification of CNDs is not always clear in the repositories.
Social networks for example may contain Facebook and retweet networks while the infrastructure domain may include
road and transportation networks. We found that some groups are poorly distinguishable from each other. This may be
due to the scrupulous preprocessing and the limited dataset. However, if classification is the primary goal one can also
take into consideration the ignored degrees of freedom such as directionality or edge weights. Based on the identified
set of features relevant for these domains, one can take this investigation further and search for the forces driving their
evolution by considering the optimization of the given topological descriptors or comparing them with null models
restricting the important features to come up with other relevant properties. According to our reported experience the
merger of network science and machine learning provides redoubtable means to scientists. However, it is still in its
infancy and as such full of pitfalls. In our opinion the rapid development of these two fields will soon provide mature
solutions to the problems presented here and will revolutionize the way we view and make use of complex systems.
Acknowledgements
This work was supported by the Collegium Talentum Programme of Hungary. M. J. acknowledges a STAR UBB
excellence bursary from the Council for Research of the Babes-Bolyai University. A.S.L. is supported by a seed award
in science from the Wellcome trust (207799/Z/17/Z). The authors are grateful to Z. Néda, M. Ercsey-Ravasz, B. Sándor,
E. Szathmáry, R. Albert and B.Á. Pataki for enlightening discussions and many edifying suggestions. Furthermore,
the work could not be completed without the support of A. Libál, B. Molnár and L. Varga to access the necessary
computational resources.
References
[1] G. Rzevski. Complexity as the defining feature of the 21st century. International Journal of Design & Nature and
Ecodynamics, 10(3):191–198, September 2015.
[2] Benjamin Schäfer, Dirk Witthaut, Marc Timme, and Vito Latora. Dynamically induced cascading failures in
power grids. Nature Communications, 9(1), May 2018.
[3] Peng Li, Yingxue Fu, and Yonghua Wang. Network based approach to drug discovery: A mini review. Mini-
Reviews in Medicinal Chemistry, 15(8):687–695, April 2015.
[4] Mark Newman. Networks. Oxford University Press, London, England, 2018.
[5] Albert-László Barabási. Scale-free networks: A decade and beyond. Science, 325(5939):412–413, July 2009.
[6] Victor M. Eguíluz, Dante R. Chialvo, Guillermo A. Cecchi, Marwan Baliki, and A. Vania Apkarian. Scale-free
brain functional networks. Physical Review Letters, 94(1), January 2005.
[7] Liang Zhao, Kwangho Park, and Ying-Cheng Lai. Attack vulnerability of scale-free networks due to cascading
breakdown. Physical Review E, 70(3), September 2004.
[8] Zoltán Néda, Levente Varga, and Tamás S. Biró. Science and facebook: The same popularity law! PLOS ONE,
12(7):e0179656, July 2017.
[9] Ann E. Sizemore, Chad Giusti, Ari Kahn, Jean M. Vettel, Richard F. Betzel, and Danielle S. Bassett. Cliques and
cavities in the human connectome. Journal of Computational Neuroscience, 44(1):115–145, November 2017.
[10] Michael W. Reimann, Max Nolte, Martina Scolamiero, Katharine Turner, Rodrigo Perin, Giuseppe Chindemi,
Paweł Dłotko, Ran Levi, Kathryn Hess, and Henry Markram. Cliques of neurons bound into cavities provide a
missing link between structure and function. Frontiers in Computational Neuroscience, 11, June 2017.
8A PREPRINT - J UNE 22, 2021
[11] Duncan J. Watts and Steven H. Strogatz. Collective dynamics of ‘small-world’ networks. Nature, 393(6684):440–
442, June 1998.
[12] Soon-Hyung Yook, Zoltán N. Oltvai, and Albert-László Barabási. Functional and topological characterization of
protein interaction networks. PROTEOMICS, 4(4):928–942, April 2004.
[13] S Wuchty, Z N Oltvai, and A-L Barabási. Evolutionary conservation of motif constituents in the yeast protein
interaction network. Nature Genetics, 35(2):176–179, September 2003.
[14] E. Ravasz. Hierarchical organization of modularity in metabolic networks. Science, 297(5586):1551–1555, August
2002.
[15] H. Jeong, B. Tombor, R. Albert, Z. N. Oltvai, and A.-L. Barabási. The large-scale organization of metabolic
networks. Nature, 407(6804):651–654, October 2000.
[16] Réka Albert. Scale-free networks in cell biology. Journal of Cell Science, 118(21):4947–4957, November 2005.
[17] Albert-László Barabási and Zoltán N. Oltvai. Network biology: understanding the cell's functional organization.
Nature Reviews Genetics, 5(2):101–113, February 2004.
[18] M. Girvan and M. E. J. Newman. Community structure in social and biological networks. Proceedings of the
National Academy of Sciences, 99(12):7821–7826, June 2002.
[19] Yael Artzy-Randrup and Lewi Stone. Connectivity, cycles, and persistence thresholds in metapopulation networks.
PLoS Computational Biology, 6(8):e1000876, August 2010.
[20] Eleni Katifori, Gergely J. Szöllősi, and Marcelo O. Magnasco. Damage and fluctuations induce loops in optimal
transport networks. Physical Review Letters, 104(4), January 2010.
[21] Kate Burleson-Lesser, Flaviano Morone, Maria S. Tomassone, and Hernán A. Makse. K-core robustness in
ecological and financial networks. Scientific Reports, 10(1), February 2020.
[22] Flaviano Morone, Gino Del Ferraro, and Hernán A. Makse. The k-core as a predictor of structural collapse in
mutualistic ecosystems. Nature Physics, 15(1):95–102, October 2018.
[23] Alex Arenas, Albert Díaz-Guilera, Jurgen Kurths, Yamir Moreno, and Changsong Zhou. Synchronization in
complex networks. Physics Reports, 469(3):93–153, December 2008.
[24] S. Boccaletti, J.A. Almendral, S. Guan, I. Leyva, Z. Liu, I. Sendiña-Nadal, Z. Wang, and Y. Zou. Explosive
transitions in complex networks’ structure and dynamics: Percolation and synchronization. Physics Reports,
660:1–94, November 2016.
[25] Sarika Jalan, Anil Kumar, Alexey Zaikin, and Jürgen Kurths. Interplay of degree correlations and cluster
synchronization. Physical Review E, 94(6), December 2016.
[26] Qingying Miao, Zhihai Rong, Yang Tang, and Jianan Fang. Effects of degree correlation on the controllability of
networks. Physica A: Statistical Mechanics and its Applications, 387(24):6225–6230, October 2008.
[27] M. DI BERNARDO, F. GAROFALO, and F. SORRENTINO. EFFECTS OF DEGREE CORRELATION ON
THE SYNCHRONIZATION OF NETWORKS OF OSCILLATORS. International Journal of Bifurcation and
Chaos, 17(10):3499–3506, October 2007.
[28] M. E. J. Newman. Assortative mixing in networks. Physical Review Letters, 89(20), October 2002.
[29] Guilherme Ferraz de Arruda, Emanuele Cozzo, Yamir Moreno, and Francisco A. Rodrigues. On degree–degree
correlations in multilayer networks. Physica D: Nonlinear Phenomena, 323-324:5–11, June 2016.
[30] Zhihai Rong, Xiang Li, and Xiaofan Wang. Roles of mixing patterns in cooperation on a scale-free networked
game. Physical Review E, 76(2), August 2007.
[31] I. Sendiña-Nadal, I. Leyva, A. Navas, J. A. Villacorta-Atienza, J. A. Almendral, Z. Wang, and S. Boccaletti.
Effects of degree correlations on the explosive synchronization of scale-free networks. Physical Review E, 91(3),
March 2015.
[32] M. Drew LaMar and Gregory D. Smith. Effect of node-degree correlation on synchronization of identical
pulse-coupled oscillators. Physical Review E, 81(4), April 2010.
[33] Mahdi Jalili and Matjaž Perc. Information cascades in complex networks. Journal of Complex Networks, July
2017.
[34] Guilherme Ferraz de Arruda, Francisco A. Rodrigues, and Yamir Moreno. Fundamentals of spreading processes
in single and multilayer complex networks. Physics Reports, 756:1–59, October 2018.
[35] Albert-Laszlo Barabasi. Network Science. Cambridge University Press, Cambridge, England, 2016.
9A PREPRINT - J UNE 22, 2021
[36] Akrati Saxena and Sudarshan Iyengar. Centrality measures in complex networks: A survey, 2020.
[37] K. A. Zweig. Random graphs as null models. In In Lecture Notes in Social Networks, page 183–214. Springer
Vienna, 2016.
[38] Sz Horvát and Carl D Modes. Connectedness matters: construction and exact random sampling of connected
networks. Journal of Physics: Complexity, 2(1):015008, jan 2021.
[39] Giulio Cimini, Tiziano Squartini, Fabio Saracco, Diego Garlaschelli, Andrea Gabrielli, and Guido Caldarelli. The
statistical physics of real-world networks. Nature Reviews Physics, 1(1):58–71, January 2019.
[40] S. L. Hakimi. On realizability of a set of integers as degrees of the vertices of a linear graph. i. Journal of the
Society for Industrial and Applied Mathematics, 10(3):496–506, September 1962.
[41] L. da F. Costa, F. A. Rodrigues, G. Travieso, and P. R. Villas Boas. Characterization of complex networks: A
survey of measurements. Advances in Physics, 56(1):167–242, January 2007.
[42] Ryan A. Rossi and Nesreen K. Ahmed. Complex networks are structurally distinguishable by domain. Social
Network Analysis and Mining, 9(1), September 2019.
[43] Kansuke Ikehara and Aaron Clauset. Characterizing the structural diversity of complex networks across domains,
2017.
[44] B. Venkatesh and J. Anuradha. A review of feature selection and its methods. Cybernetics and Information
Technologies, 19(1):3–26, March 2019.
[45] Ryan A. Rossi and Nesreen K. Ahmed. An interactive data repository with visual analytics. ACM SIGKDD
Explorations Newsletter, 17(2):37–41, February 2016.
[46] Rose Oughtred, Chris Stark, Bobby-Joe Breitkreutz, Jennifer Rust, Lorrie Boucher, Christie Chang, Nadine Kolas,
Lara O’Donnell, Genie Leung, Rochelle McAdam, Frederick Zhang, Sonam Dolma, Andrew Willems, Jasmin
Coulombe-Huntington, Andrew Chatr-aryamontri, Kara Dolinski, and Mike Tyers. The BioGRID interaction
database: 2019 update. Nucleic Acids Research, 47(D1):D529–D541, November 2018.
[47] Rahuman S Malik-Sheriff, Mihai Glont, Tung V N Nguyen, Krishna Tiwari, Matthew G Roberts, Ashley Xavier,
Manh T Vu, Jinghao Men, Matthieu Maire, Sarubini Kananathan, Emma L Fairbanks, Johannes P Meyer,
Chinmay Arankalle, Thawfeek M Varusai, Vincent Knight-Schrijver, Lu Li, Corina Dueñas-Roca, Gaurhari Dass,
Sarah M Keating, Young M Park, Nicola Buso, Nicolas Rodriguez, Michael Hucka, and Henning Hermjakob.
BioModels—15 years of sharing computational models in life science. Nucleic Acids Research, November 2019.
[48] Rainer Kujala, Christoffer Weckström, Richard K. Darst, Miloš N Mladenović, and Jari Saramäki. A collection of
public transport network data sets for 25 cities. Scientific Data, 5(1), May 2018.
[49] Amir Ghasemian, Homa Hosseinmardi, and A. Clauset. Evaluating overfit and underfit in models of network
community structure. IEEE Transactions on Knowledge and Data Engineering, 32:1722–1735, 2020.
[50] Roderick J A Little and Donald B Rubin. Statistical analysis with missing data. John Wiley & Sons, Nashville,
TN, 3 edition, 2019.
[51] O. Troyanskaya, M. Cantor, G. Sherlock, P. Brown, T. Hastie, R. Tibshirani, D. Botstein, and R. B. Altman.
Missing value estimation methods for DNA microarrays. Bioinformatics, 17(6):520–525, June 2001.
[52] Isabelle Guyon, Jason Weston, Stephen Barnhill, and Vladimir Vapnik. Machine Learning, 46(1/3):389–422,
2002.
[53] J. Platt. Probabilistic outputs for support vector machines and comparison to regularized likelihood methods. In
Advances in large margin classifiers (Edited by: Smola A., Bartlett P., Scholkopf B., Schuurmans D.), pages 61–74.
Cambridge, MA, MIT Press, 1999.
[54] Trevor Hastie, Robert Tibshirani, and J H Friedman. The elements of statistical learning: Data mining, inference,
and prediction. Springer, New York, NY, 2 edition, 2009.
[55] Leo Breiman. Machine Learning, 45(1):5–32, 2001.
[56] Takaya Saito and Marc Rehmsmeier. The precision-recall plot is more informative than the ROC plot when
evaluating binary classifiers on imbalanced datasets. PLOS ONE, 10(3):e0118432, March 2015.
[57] Laurens van der Maaten and Geoffrey Hinton. Visualizing data using t-sne. Journal of Machine Learning Research,
9(86):2579–2605, 2008.
[58] van der Maaten. L.j.p. t-distributed stochastic neighbor embedding. https://lvdmaaten.github.io/tsne/.
[59] A. Barrat, M. Barthelemy, R. Pastor-Satorras, and A. Vespignani. The architecture of complex weighted networks.
Proceedings of the National Academy of Sciences, 101(11):3747–3752, March 2004.
10A PREPRINT - J UNE 22, 2021
[60] Ulrik Brandes. On variants of shortest-path betweenness centrality and their generic computation. Social Networks,
30(2):136–145, May 2008.
[61] Vladimir Batagelj and Matjaž Zaveršnik. Fast algorithms for determining (generalized) core groups in social
networks. Advances in Data Analysis and Classification, 5(2):129–145, November 2010.
[62] Ulrik Brandes and Daniel Fleischer. Centrality measures based on current flow. In STACS 2005, pages 533–544.
Springer Berlin Heidelberg, 2005.
[63] M.E. J. Newman. A measure of betweenness centrality based on random walks. Social Networks, 27(1):39–54,
2005.
[64] Vito Latora and Massimo Marchiori. Efficient behavior of small-world networks. Physical Review Letters, 87(19),
October 2001.
[65] S. Wernicke and F. Rasche. FANMOD: a tool for fast network motif detection. Bioinformatics, 22(9):1152–1153,
February 2006.
[66] Sergey Brin and Lawrence Page. The anatomy of a large-scale hypertextual web search engine. Computer
Networks and ISDN Systems, 30(1):107–117, 1998. Proceedings of the Seventh International World Wide Web
Conference.
[67] Stanley Wasserman and Katherine Faust. Social Network Analysis. Cambridge University Press, November 1994.
[68] M. E. J. Newman. Scientific collaboration networks. II. shortest paths, weighted networks, and centrality. Physical
Review E, 64(1), June 2001.
[69] K.-I. Goh, B. Kahng, and D. Kim. Universal behavior of load distribution in scale-free networks. Physical Review
Letters, 87(27), December 2001.
[70] Paolo Boldi and Sebastiano Vigna. Axioms for centrality. Internet Mathematics, 10(3-4):222–262, July 2014.
[71] Karen Stephenson and Marvin Zelen. Rethinking centrality: Methods and examples. Social Networks, 11(1):1–37,
March 1989.
[72] Vincent D Blondel, Jean-Loup Guillaume, Renaud Lambiotte, and Etienne Lefebvre. Fast unfolding of commu-
nities in large networks. Journal of Statistical Mechanics: Theory and Experiment, 2008(10):P10008, October
2008.
[73] Julian J. McAuley, Luciano da Fontoura Costa, and Tibério S. Caetano. Rich-club phenomenon across complex
network hierarchies. Applied Physics Letters, 91(8):084103, August 2007.
[74] Ginestra Bianconi. Degree distribution of complex networks from statistical mechanics principles, 2006.
11You can also read