Outline Introduction to Biostatistics
←
→
Page content transcription
If your browser does not render page correctly, please read the page content below
1/12/2023

              Principles of Biostatistics
        Statistical Tests in Clinical Research

                 Ilir Agalliu MD, ScD
                Associate Professor
         Epidemiology and Population Health

                                            1/11/2023

1

                       Outline
    •  Introduction to Biostatistics
    •  Types of Data
    •  Normal Distribution and Sampling
    •  Hypothesis Testing
        • Null vs. Alternative Hypothesis
        • Type I & II Errors
    • Statistical Tests
        • T-test
        • ANOVA
        • Non-parametric test
        • Chi-square test

                              2

2

                                                                1
1/12/2023
Research Process
• Generation of Hypothesis & Review Literature
• Determine Study Design
• Data Collection
Questionnaires, clinical exams, biomarkers etc.
• Create Database with a list of variables
Data entry, data cleaning
• Selection of Statistical / Analytical Methods
• Interpretation of Results
• Data Presentation and Publication of Results
3
What is Biostatistics ?
• The application of statistical methods: i.e.
collection, organization, analysis and
interpretation of data in biological and
health sciences
• Provides framework for data collection &
analysis
• Use of numbers to communicate results
Absolute risk of disease in populations
Relative risk in relation to an exposure or risks in
subgroups of population
4
2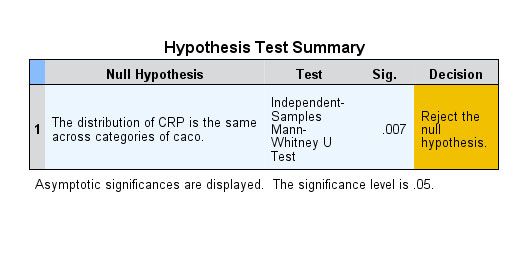
1/12/2023
Some issues…that are common
• I can collect data but don’t know how to use it
• I am confused which test or procedure to use for my
analysis
• I want to learn the applied aspects in biostatistics
without getting into biostatistical theory
• I want to understand enough biostatistics to do my
analysis and to read articles
• Biostatistics is boring!
5
Top 2 Reasons We Need Statistics
• Estimation
We study phenomena that are variable and the
states of which occur with certain probabilities
We need to estimate parameters of the
population and to compute measures of how well
our estimate reflects the “truth”
• Hypothesis Testing
We do NOT study the entire population
We study a sample of the population from which
we wish to draw inferences about the entire
population
6
3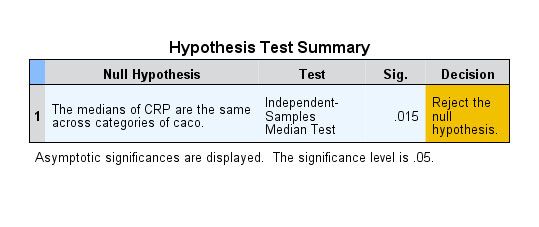
1/12/2023
Data Variables
Biostatistics
Numerical Categorical
Quantitative Qualitative
Discrete Continuous Nominal Ordinal
Scores: Age, Height, Gender Order of
Weight Race categories
1, 2, 3, 4, 5
Smoking low, medium,
Status high
7
Descriptive Statistics
Measures used to summarize data
Continuous
• Measures of Central Tendency
Mean, Median, Mode
• Measures of Variation or Spread
Variance, Standard deviation (SD), Inter-quartile range (IQR)
Categorical
• Proportion, Percentage,
• Frequency distribution
8
4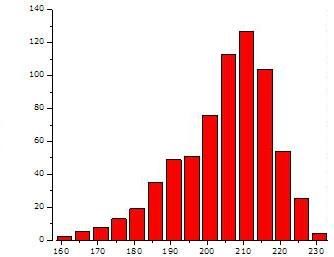
1/12/2023

                  Normal Distribution

     • Bell shaped (unimodal)
     • Symmetrical
     • Mean and median are equal

9

     Different Types of Normal Distribution

10

                                                      5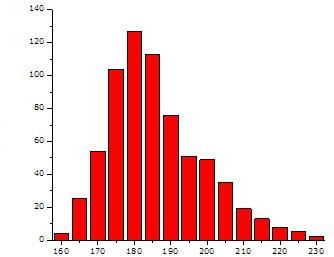
1/12/2023
Sampling
Cannot include the entire population in a study,
therefore, we take a SAMPLE of the population
• Sample should be RANDOM & REPRESENTATIVE
• Sampling error
• Sample size
CENTRAL LIMIT THEOREM
With large sample sizes, the distribution of means is
approximately Normal
As N increases the amount of sampling variability
decreases
11
Random Sampling and Sample Size
N=25 N=500
12
61/12/2023
Skewed Distributions
Left-Skewed Right-Skewed
13
Measures of Central Tendency
• Mean
The average of all observations
Arithmetic mean
• Median
Midpoint of a distribution; 50%-tile of the data
observations
• Mode
The most frequently occurring observation in the
data
14
71/12/2023
Measures of Variation
• Describe how spread out or scattered data are
• Range of data
Max – Min: simple measure of variation
Inter-quartile range: Q25 –Q75
• Variance
Average of the squared deviations between the
individual scores and the mean
Sample variance
• Standard Deviation
Sample Sd
15
Distribution of Birth Weight
16
81/12/2023
Standard Error (SE)
SE= SD/√n
SD describes variability of individual values
around the sample mean
SE describes variability of the sample mean
around the “true” mean
17
How do I know if Data are Normally
Distributed?
• It’s a valid question that determines what type
of statistical test(s) is appropriate
• Normality tests are used to determine whether
a variable is normally distributed or not
Shapiro-Wilk / Shapiro-Francia Test
• Null hypothesis: Sample x1, x2..., xn came from a
normally distributed population
Skewness / Kurtosis tests
Normal probability plot
Q-Norm or Q-Q plots
18
91/12/2023
Is Birthweight Normally Distributed?
Normal Q-Q Plot Graph Deviation from Normal
19
Frequency Distribution
20
101/12/2023
Hypothesis Testing
• Involves conducting a test of statistical significance
• Quantify the degree to which sampling variability
may account for the observed results in a particular
study
• H0 – The Null Hypothesis
µ = µ0 No difference in means (e.g. height, cholesterol)
RR = 1 No association between exposure & disease
• H1 or A – The Alternative Hypothesis
µ ≠ µ0 Means are different
RR ≠ 1 There is an association between exposure & disease
21
One vs. 2-sided Tests of Hypothesis
• 2-sided test
Tests in both direction - H0: µ = µ0
More conservative
• 1-sided test
Tests in one of the directions - H0: µ ≤ µ0
Assumes that the direction of association is
known (either positive or negative)
E.g. Treatment B is better than A
22
111/12/2023
One-sided
Advantage - smaller sample size;
Disadvantage - loss of the ability to test for unanticipated results
Two-sided
23
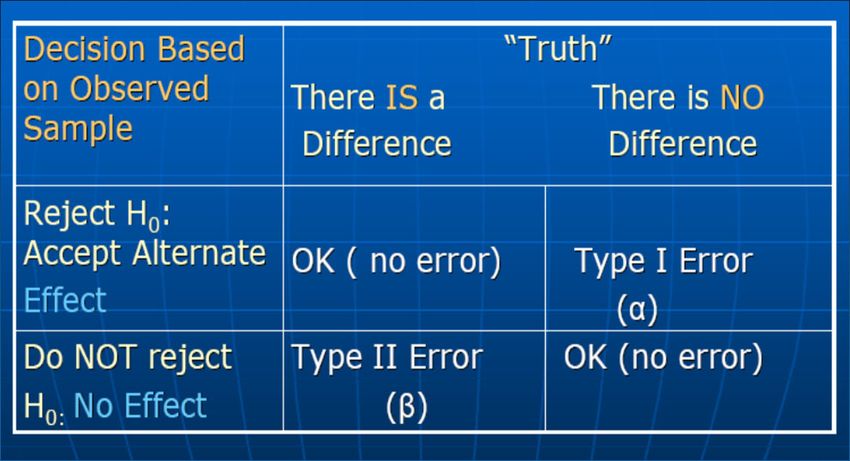
Types of Error: Hypothesis Testing
24
121/12/2023
Types of Error
• Type I error (α)
Pr (reject H0 when H0 is true)
Concluding that there is a difference (or an
associations) when in fact there IS NOT
Significance level
• Type II error ()
Pr (do not reject H0 when H0 is false)
Failing to prove that there is a difference (or an
association) when in fact there IS
• Power of the study = 1 -
25
P-value
• Probability of obtaining a result as extreme
or more extreme that those observed in the
sample of the study
A mean value or RR as extreme or more extreme
• P-value is determined by α (significance)
• Usually “the magic cutoff” = 0.05
• If P ≤ 0.05 – we reject the H0
• If P > 0.05 – we fail to reject the H0
26
131/12/2023
Advantages and Disadvantages of
“Statistically Significant” P-value
• Advantages
In some situations, it is necessary to reach a final decision
People don’t like ambiguity
Expressing results as “Statistically Significant” is much
more satisfying
• Disadvantages
People stop thinking about the data when they see a non-
statistically significant result
RR=3.0, p=0.06 is an important finding, but may be
disregarded because of a “non-significant” p-value.
27
Confidence Interval
• CI is a range of values (interval estimate) defined by
upper and lower limits within which the true value
of an unknown population parameter is likely to fall
• Used to indicate reliability of an estimate
• If study is repeated 100 times, 95 times the measure
of association (OR, RR) will fall within the range of
the CI
• Qualified by a particular confidence level (95%)
RR = 2.5, 95% CI = 1.5 – 3.9
RR = 1.4, 95% CI = 0.7 – 2.6
28
141/12/2023
95% Confidence Intervals (CI)
• Provide all the information that p-values
give in terms of statistical significance
RR=1.1; 95% CI= 0.95–1.08 (p > 0.05)
RR=2.3; 95% CI = 1.3–3.8 (p < 0.05)
• Indicate the amount of variability in data
95% CI = 0.95 – 1.08 (is narrow)
95% CI = 0.50 – 10.08 (is wide)
29
Statistical Tests
Case-Studies
• Low birth weight is a major concern since it is associated with
infant mortality and birth defects
• A woman's behavior and comorbid conditions during pregnancy
can influence the chances of carrying the baby to full-term and,
consequently, delivering a low birth-weight baby
There are 3 hypotheses that we would like to investigate:
1. Is there a statistically significant difference in baby’s birth weight
(continuous) by maternal smoking during pregnancy?
2. Is there a statistically significant difference in baby’s birth weight
(continuous) by mother’s race?
3. Is there a difference in low birth weight (1/12/2023
Procedures for Hypothesis Testing
1. Define the null and the alternate hypotheses for
the study
2. Data collection
3. Look at the distribution of the data
4. Decide an appropriate test
5. Calculate the test statistic (usually via software)
6. Compare the calculated test statistic to values
from a known probability distribution
7. Interpret the p-value and clinical significance
31
Decision: Bivariable analysis
Continuous Dependent var Categorical
Continuous Categorical Categorical
Independent var Continuous
2 groups >2 groups
Scatter plot
T-test (option for ANOVA Logistic or Cox Chi square test
Correlation
paired test) Regression Logistic or Cox
(Pearson’s or Kruskal
Spearman’s) Wilcoxon Rank Wallis test Regression
Sum test
Simple linear
regression
MULTIVARIABLE – LINEAR REGRESSION MULTIVARIABLE – LOGISTIC or COX REG.
32
161/12/2023
Student’s T-test
H0 : M = M1 T-distribution
HA : M ≠ M1 (two-sided) .4
Usually used to compare
two means of two .3 Distribution
populations
Probability
Normal
.2
T with 2 df
T-distribution similar to
normal (z-distribution) .1
T with 5 df
Can be used even if the T with 10 df
variance is unknown 0.0 T with 30 df
Requires normality
-5
-4 0
-3 0
-2 0
-1 0
.0 0
1.
2.
3.
4.
5.
0
00
00
00
00
00
.0
.0
.0
.0
.0
assumption
Value
33
Types of T-test
One sample t-test
Compares the mean of a study population (M) to a
hypothesized value (M1)
Paired t-test: Used for repeated measures over the same
population
E.g. weight, SBP is measured in the same group of people
over two time periods (year 1 and 2) or (pre- vs. post-
intervention)
Two sample t-test
Compare means of two different groups (e.g. men vs.
women) or two different populations
Equal variance or Unequal variance
34
171/12/2023
General Formula T-Tests
General Formula is:
t = (mean1 – mean2) / SE of the difference of means
Equal Variance Unequal Variance
t –follows a t-distribution and depending on the
degrees of freedom, it determines the critical
value and p-value
35
Example:
Is there a statistically
significant difference
in baby’s birth weight
by maternal smoking
during pregnancy?
36
181/12/2023
T-Test - Example
Is there a statistically significant difference in baby’s
birth weight by mother smoking during pregnancy?
37
PAIRED SAMPLES T TEST
160
150
The Paired T-test evaluates
Systolic Blood Pressure
140
the differences in mean
130 SBP values pre- and post
120 treatment in the same
110 subjects.
100
Shows a statistically
90
significant difference.
PRE POST
Treatment
Paired Samples Test
Paired Differences
Std. Error Sig.
Mean Std. Deviation Mean t df (2-tailed)
Paired SYSTOLIC - POST 4.8752 5.1930 1.1612 4.198 19 .000
38
191/12/2023
ANOVA (Analysis of Variance)
What if we want to compare means among 3 groups?
Hypothesis: Is there a statistically significant
difference in baby’s birth weight by mother’s race?
• Unfortunately, the T test only allows us to compare
two groups at a time: two sample T-test
• The T test is NOT appropriate for comparisons of
3 or more groups: issues with multiple comparisons
A global test that is used to compare the means of
three or more groups
One way ANOVA: one independent variable
39
Why T-test is Not Appropriate?
If we want to compare means for 3 groups, we might try to
compare them 2 at a time with a t-test
We might compare each of the following pairs with a 2-
sample t test with a specified type I error rate of 0.05.
group 1 to group 2
group 1 to group 3
group 2 to group 3
Problem is that the probability of making a type I error is
NOT kept at 0.05 because we are doing 3 tests
Actual type I error rate = 0.143 for the 3 tests combined
40
201/12/2023
One-way ANOVA
Assumptions:
1. Random samples have been selected from k
population
2. Normal distribution of the outcome variable
3. Variances are identical/similar for all groups
Focuses on comparisons of variances (not means):
Between and Within group variance
Total variance = within group var + between group
var + error
Calculate F-statistics and determine p-value
F = Variance Btw Gr / Variance Within Gr
41
Anova- Example
Hypothesis: Is there a difference in baby’s birth weight by
mother’s race?
42
211/12/2023
Anova- Example
Hypothesis: Is there a difference in baby’s birth weight by
mother’s race?
P is statistically significant, hence we reject H0
At least one group mean is different from others
43
Post hoc Analysis – Race and Birthweight
Which of the 3 groups are different?
44
221/12/2023
Which tests do we use for Skewed Data?
Case Study
• Some studies have reported that diabetes is
associated with inflammatory markers
• Hypothesis: To examine if there is a
statistically significant difference in C-reactive
protein (CRP) serum levels by type II diabetes
45
45
Variables with Skewed Distribution
• Skewed data cannot be analyzed with Student T-test
Violation of normality assumption
• Skewness formula = E[(X- )/ ]3 – so can be infinitively large
46
231/12/2023
Wilcoxon-Rank Sum Test
or the Mann–Whitney U test
• Non-parametric alternative to t-test if the
variable is not normally distributed
E.g. Length of Stay (LOS) in Hospital, CRP levels
• Assess whether one of the two samples of
independent observations tends to have larger
values than the other
• Null hypothesis
The distributions of both groups are equal
• Does not assume normality
• In SPSS: Analyze – Non-parametric – Independent samples
47
Example- CRP and Diabetes
CRP is NOT normally
distributed in cases or
controls
48
241/12/2023
Example- CRP and Diabetes
CRP is NOT normally distributed in cases or controls
49
The Median Test
• Another non-parametric alternative to t-test if the
variable is not normally distributed
• Null hypothesis
The medians of the populations from which two
samples are drawn are identical
50
251/12/2023
Kruskal-Wallis test
• Non-parametric alternative to one-way
ANOVA
• Can be used when you need to compare
medians between 3 or more groups
• Does not assume normality
• In SPSS
Analyze – Non-parametric – k independent samples
51
Statistical Tests - Categorical Variables
Chi-square (χ2) test
- Compares the proportion of individuals with a
certain characteristic or exposure among two or
more groups
- Generally used for 2 x 2 or n x n (contingency)
tables
- Each cell is mutually exclusive
- Can be used for two or more independent
groups
- H0 : p1 = p2
- HA : p1 ≠ p2 (two-sided)
• p – denotes proportion
52
261/12/2023
Chi-Square Test
Assume we wish to compare proportions of two birth weight
groups by maternal hypertension during pregnancy
X2(df) = Σ (Obs - Exp)2 / Exp
Need to calculate expected values
53
Calculation of Expected Values
Hypertension
Birth-weight No Yes Total
(a+b)*(a+c) (a+b)*(b+d)
>2500 a+b
T T
(c+d)*(a+c) (b+d)*(c+d)1/12/2023
Chi-Square Test
55
Chi-Square Test
Can be used also for n x n tables
56
281/12/2023
Take Home Messages
• Check if your outcome is continuous or not and if
continuous check if it is normally distributed
• For continuous, normally distributed variables use
• T-test – 2 groups
• ANOVA - 3 or more groups
• For continuous but NOT normally distributed
(skewed) variables use
• Non-parametric tests
• Categorical variables
• Chi-square test
57
57
New Yorker: “To My Data, Right or Wrong.”
58
29You can also read