Interval-Based Composite Indicators with a Triplex Representation: A Measure of the Potential Demand for the "Ristori" Decree in Italy.
←
→
Page content transcription
If your browser does not render page correctly, please read the page content below
Munich Personal RePEc Archive

Interval-Based Composite Indicators
with a Triplex Representation: A
Measure of the Potential Demand for the
"Ristori" Decree in Italy.

Drago, Carlo

University “Niccolò Cusano”, NCI University, London

30 March 2021

Online at https://mpra.ub.uni-muenchen.de/106904/
MPRA Paper No. 106904, posted 06 Apr 2021 01:45 UTC
Interval-Based Composite Indicators with a
Triplex Representation: A Measure of the
Potential Demand for the "Ristori" Decree in
Italy.
Indicatori compositi basati su dati ad intervallo facendo
uso di una rappresentazione Triplex: la misurazione della
potenziale domanda del decreto “Ristori” in Italia

Carlo Drago1

Abstract In this work, we propose a new approach to constructing interval-based
composite indicators based on the triplex representation. So, we measure the
principal value of the indicator and simultaneously the value's uncertainty due to the
different assumptions as different weightings associated how the indicator and their
ranks can vary considering different assumptions or weights. The approach is useful
not only on the construction of the composite indicators but also for a reliable
interpretation of the results. The application shows the usefulness of the approach in
detecting the regions higher the potential demand for economic support due to the
Covid-19 emergency.
Abstract In questo lavoro proponiamo un nuovo approccio alla costruzione di
indicatori compositi basati su intervalli, basati sulla rappresentazione triplex. In
questo caso siamo in grado di misurare non solo il valore principale dell'indicatore
e l'incertezza del valore dovuta alla diversa assunzione come differenti ponderazioni
associate ma anche come l'indicatore e il loro rango possono variare considerando
differenti assunzioni o pesi. Quindi l'approccio è utile non solo sulla costruzione
degli indicatori compositi, ma anche su un'interpretazione affidabile dei risultati.

1
 Carlo Drago, University “Niccolò Cusano”, Via Don Carlo Gnocchi 3, 00166, Rome and NCI
University, London. Northern & Shell Tower, 4 Selsdon Way, Isle of Dogs, London E14 9GL, United
Kingdom. We thank an anonymous referee for their helpful suggestions.
2                                                                      Carlo Drago
L'applicazione mostra l'utilità dell'approccio nell’analisi della domanda di sostegno
economico (“ristori”) dovuto all’emergenza Covid-19 in Italia.

Key words: interval data, symbolic data, composite indicators

1 The Statistical Problem

There are many situations where it is challenging to evaluate many complex
phenomenon measures using a single value. In this case, we lose relevant
information because we are aggregating the data in a unique measure. The use of
interval-valued data can be an essential approach for retaining all the knowledge
about the phenomenon under investigation and avoiding information loss (Billard
and Diday 2003 Gioia 2009).
    In this case, the complex information is related to the problematic measurement
of a composite indicator. In this way, there can be a relevant issue on constructing
the composite indicator, which contains some subjective choices. For instance, the
weighting of the composite indicators can be differently identified. Following Greco
et al. (2019) it is necessary to transform the subjective aspect of weighting the
metrics more manageable and, most transparent, the most important thing to
consider. After the composite indicator construction, it is necessary to evaluate the
robustness and the sensitivity of the choices done on the final results of the
composite indicator (Saisana et al. 2005).
    In this respect, before considering any statistical analysis, it is crucial to passing
through this stage of symbolic data analysis to define new formats for the data
(Billard Diday 2003). These data should maintain all the complex information of the
data. In this context, the use of composite indicators using interval data can be a
possibility to represent the uncertainty accordingly on the data.

2 Interval-Based Composite Indicators Using a Triplex
  representation

To better represent a composite indicator based on a single value, it is possible
simultaneously to consider different values obtained considering different initial
weights or assumptions. The approach proposed by Drago (2017 and 2019 see also
Gatto and Drago 2020) is to consider the possible different weighting schemes
randomly as factors in the construction of the composite indicator. Using a Monte-
Carlo simulation, obtain the different composite indicators associated with each
assumption on the weighting scheme. Finally, the interval-based composite indicator
can be constructed considering the different values obtained by the Monte-Carlo
simulation and the center, the lower and the upper bound, representing extreme
Interval-Based Composite Indicators using the Triplex Representation 3
scenarios from the construction of the possible composite indicators. Following
Bertrand and Goupil (2000) and Billard (2010) given:
(1)
Where is the lower bound of the interval and is the upper bound. We have the
mean of the intervals:
(2)
And also variance:
(3)
The use of the interval data is crucial because it retains the original data's relevant
information, considering all the different weighting schemes.
In this respect, the data's triplex representation (Apostolatos et al. 1968, Nickel
1969) can be useful to consider the most relevant assumption of the different
composite indicators constructed. The intervals and the triplex representation both
have their arithmetic, allowing the statistical analysis of the different sets of
composite indicators obtained (Williamson 1989 Gioia and Lauro 2005).
So we are explicitly considering in our interval-based composite indicator a value of
the interval obtained using the classical approach in constructing the composite
indicator. The advantage is twofold: to retain the information of the original
composite indicator, and also to allow to evaluate the two radii, as sub-intervals
constructed by considering the difference between the upper bound and the original
composite indicator value, but also the difference between the most likely result of
the composite indicator and the lower bound. These measures can be essential in
interpreting the results because it allows measurement of the variability of the
measures considering extreme scenarios.
3 Application Results
To analyze the proposed approach, we consider an application based on the analysis
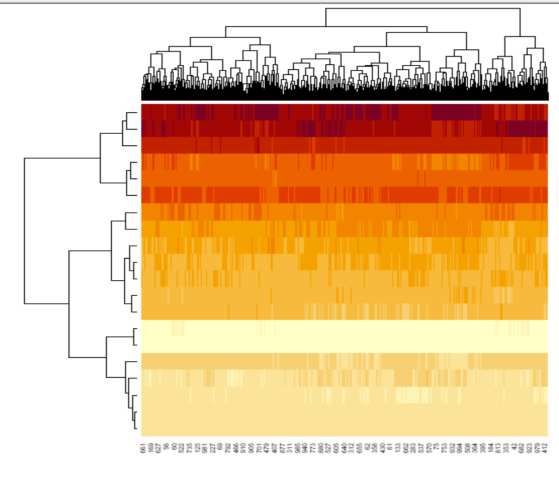
of the interest and potential demand for "Decreto Ristori" as a policy measure to4 Carlo Drago sustain the Italian Economy from the Covid-19 Emergency. In this sense, the policy measure was the DL 28 October 2020, n. 137, containing "Additional urgent measures in the field of health protection, support to workers and businesses, justice and safety, connected to the epidemiological emergency from Covid-19" (V.A. 2021 MEF 2021). This decree was very relevant because it was significant for many businesses in Italy, so the potential demand or interest measured as google queries on the period 2020-10-25- 2021-2-28 (essential to consider also the additional renewals of the decree, which identify different measure and different policies). The interest measured in this sense is absorbing because it allows identifying relevant Italian zones special in need of economic sustain. More specifically, we collected the queries by using Google Trends (see Google Trends 2021). The different queries are: “decreto ristori”, “decreto ristori bis”, “decreto ristori ter”, “decreto ristori quater”, “decreto ristori quinquies”, “fondo perduto decreto ristori”, “decreto ristori codici ateco” and “finally bonus decreto ristori”. The queries are performed for the Italian territory. Obtained the different values for the regions, we consider the Monte-Carlo simulation using different weights schemes. So we obtain the visual representation of the simulation as a heat map in figure 1. We can then compute the different intervals for the region, considering the lower bound, the equal weights scenario, and the upper bound. Using the triplex representation, we can compute the two radii. The two radii (lower radius L.R. and upper radius U.R.) are useful for obtaining a measure of uncertainty related to the composite indicator's computation. Finally, we compute the prototype as the "interval average," considering all the different intervals computed for each region. The mean computation is obtained using the triplex arithmetic (Williamson 1989 and Gioia and Lauro 2005). The final results are shown in Table 1. The result clearly shows some regions in Italy in which it is higher the potential demand and interest for the decree "Ristori." In particular, these regions are Calabria, Campania, and Apulia (Puglia). In these regions, it is higher the measured level of poverty (see Drago 2020). The remarkable difference is the Sicily which does not show a higher the potential demand and interest for the decree "Ristori." This result can suggest that the zones in more severe economic difficulty tend to demand high for economic sustain. It is possible using this indicator to identify them. The results can also be interpreted considering the radii of the difference between the main scenario and the upper and the radii. These differences can have a relevant applicative result because it shows in the apposite ranking how different from the main scenario, the potential demand in some query (related to a single topic). It could be essential to consider the main scenario (or the center of the interval in a different context considering the data as a genuine interval representation) and how can be different the lower and the upper bounds. Table 1: Interest and the Potential Demand for the Decree "Ristori" over the period 2020-10-25 and the period 2021-2-28 Region LB EW UB L.R. (1) U.R. (2) rank (1) rank (2) Calabria 0.85 1.21 1.52 0.36 0.31 1 1
Interval-Based Composite Indicators using the Triplex Representation                          5
 Campania                     0.92    1.15     1.44        0.23        0.29            6           4
 Apulia                       0.71    0.92     1.18        0.21        0.26            8           6
 Tuscany                      0.48    0.65     0.86        0.17        0.21          11            9
 Lombardy                     0.25    0.49     0.77        0.24        0.28            5           5
 Sicily                       0.37    0.49     0.61        0.12        0.12          15           15
 Piedmont                     0.09    0.31     0.55        0.22        0.24            7           7
 Umbria                      -0.12    0.14     0.38        0.25        0.24            3           8
 Basilicata                  -0.24    0.01     0.31        0.25        0.30            4           3
 Abruzzo                     -0.24 -0.06       0.11        0.19        0.16            9          12
 Lazio                       -0.20 -0.09       0.02        0.12        0.10          16           18
 Marche                      -0.33 -0.15       0.03        0.18        0.19          10           11
 Emilia-Romagna              -0.34 -0.20 -0.01             0.15        0.19          12           10
 Veneto                      -0.56 -0.44 -0.31             0.12        0.13          14           13
 Molise                      -0.85 -0.55 -0.24             0.30        0.31            2           2
 Liguria                     -0.70 -0.58 -0.47             0.11        0.11          17           17
 Sardinia                    -0.69 -0.60 -0.53             0.08        0.08          20           20
 Friuli-Venezia
 Giulia                      -0.76 -0.66 -0.56             0.10        0.10          19           19
 Trentino-Alto
 Adige/South Tyrol           -1.11 -1.00 -0.88             0.11        0.12          18           16
 Aosta                       -1.19 -1.05 -0.93             0.15        0.12          13           14
 Prototype
 computed                    -0.18        0    0.19        0.18        0.19

Figure 1: Heat map of the different simulations performed (in the columns) for each ranked region (in
the row)
6                                                                                    Carlo Drago
4 Conclusions

The results in this work show the possibility of using the triplex representation in the interval
to interpret the different intervals in a useful way to economic policy. The main scenario (or
the center of the interval) can analyze the potential demand or the interest in the topic. The
obtained relevant result is the identification of the relevant zones with a higher potential
demand for economic support. There are relevant advantages to using the triplex
representation to interpret the result of the analysis. First of all, we are explicitly taking into
account the main scenario (in this sense, the equal weight scenario includes the main result of
a classical composite indicator outcome).
Secondarily, this representation allows the computing of the lower and the upper radii to
represent the limitations of the classical approach identifying where there is stronger the
request and interest for some queries or in the application for different economic supports.

References
1.    Apostolatos, N., Kulisch, U. Krawczyk, R. Lortz, B. Nickel K. -Wipperman, W. (1968) The
      Algorithmic Language Triplex-Algol 60. Numerische Mathematik 11 (1968)
2.    Billard L. (2010) Symbolic Data Analysis: Basic Statistics. Compstat August 2010.
3.    Billard, L., & Diday, E. (2003). From the statistics of data to the statistics of knowledge: symbolic
      data analysis. Journal of the American Statistical Association, 98(462), 470-487.
4.    Drago, C. (2017) Interval Based Composite Indicators. FEEM Working Paper No. 42.2017
5.    Drago, C. (2019) Decomposition of the Interval Based Composite Indicators by Means of
      Biclustering. CLADAG 2019 12-th Scientific Meeting Classification and Data Analysis Group
      Cassino, September 11 – 13, 2019 Book of Short Papers/Abstracts
6.    Drago, C. (2020) The Analysis and the Measurement of Poverty: An Interval Based Composite
      Indicator Approach. Preprints 2020, 2020120695 (doi: 10.20944/preprints202012.0695.v1).
7.    Gatto, A., & Drago, C. (2020). Measuring and modeling energy resilience. Ecological
      Economics, 172, 106527.
8.    Gioia F. (2009) Portfolio Selection Models with Interval Data. Statistica Applicata Vol. 21, n. 1,
      2009 43
9.    Gioia, F., & Lauro, C. N. (2005). Basic statistical methods for interval data. Statistica
      applicata, 17(1), 75-104.
10.   Google Trends (2021) Data source: Google Trends (https://www.google.com/trends) page accessed
      the 28/2/2021
11.   Greco, S., Ishizaka, A., Tasiou, M., & Torrisi, G. (2019). On the methodological framework of
      composite indices: A review of the issues of weighting, aggregation, and robustness. Social
      Indicators Research, 141(1), 61-94.
12.   MEF (2021) Decreto ristori: le misure a favore di chi è in difficoltà https://www.mef.gov.it/covid-
      19/Decreti-ristori-le-misure-a-favore-di-chi-e-in-difficolta/ Page accessed the 28/2/2021
13.   Nickel K. (1969) Triplex-Algol and its Applications, in Topics in Interval Analysis, E. Hansen, ed.,
      Oxford University Press, Oxford.
14.   Saisana, M., Saltelli, A., & Tarantola, S. (2005). Uncertainty and sensitivity analysis techniques as
      tools for the quality assessment of composite indicators. Journal of the Royal Statistical Society:
      Series A (Statistics in Society), 168(2), 307-323.
15.   V. A. (2021) Decreto Ristori https://www.pmi.it/tag/decreto-
      ristori#:~:text=Il%20cosiddetto%20Decreto%20Ristori%2C%20ovvero,ottobre%20e%20pubblicat
      o%20in%20Gazzetta page accessed the 28/2/2021
16.   Williamson, R. C. (1989). Probabilistic arithmetic (Doctoral dissertation, University of
      Queensland).
You can also read