Pandemic Housing Policy: From Progress to Permanence - UNDERSTANDING BOSTON - The Boston Foundation
←
→
Page content transcription
If your browser does not render page correctly, please read the page content below

U N D E R S T A N D I N G                B O S T O N

      The Greater Boston Housing Report Card 2021
         Pandemic Housing Policy:
        From Progress to Permanence

                        JUNE 2021
CHAPTER THREE

                                                      Housing Market

THE PANDEMIC AMPLIFIES THE NEED FOR ADEQUATE HOUSING SUPPLY
IN SMART AND SUSTAINABLE LOCATIONS.

Inadequate housing construction and the absence of a                               In addition to a regional housing approach, Greater Boston
regional housing plan led to insufficient housing supply                           needs its municipalities to practice inclusionary zoning
and little diversity in our housing stock—a major problem                          that allows accessory dwelling units, multifamily by right
for Greater Boston and Massachusetts since well before                             and overall competent planning. Ultimately, the creation
the pandemic. After a brief initial slowdown at the start                          of more housing of diverse types at affordable prices in
of the pandemic, demand surged for homes over the last                             locations that provide residents with high levels of access
year, while housing supply remained drastically short.                             to employment opportunities is essential to ensure every-
This is a recipe for further price increases in a region                           one has a place to live in good times and bad.*
already struggling with high housing costs. The housing
supply shortage disproportionately impacts low- and                                PRE-PANDEMIC PATTERNS
moderate-income residents and communities of color.
The recent enactment of Housing Choice legislation and                             Greater Boston has not created enough new
a state mandate for multifamily zoning in communities                              housing, especially near transit.
served by the MBTA are major steps forward, yet even
                                                                                   Before COVID, Greater Boston was not meeting its hous-
stronger policies are needed to reverse decades of inade-
                                                                                   ing production needs.27 In 2017, Governor Charlie Baker
quate production in Greater Boston and to create more
                                                                                   set a statewide target to produce 135,000 housing units
affordable housing options in the region.
                                                                                   between 2018 and 2025, a continuation of housing permit
This chapter will discuss the state, regional and local roles                      rates that prevailed from 2015 to 2017. So far, statewide
in creating a healthier housing delivery system, highlight-                        permitting rates have remained on pace to meet the 2025
ing how uneven development patterns, an absence of                                 target (see Figure 32). Meanwhile, the Metropolitan
coordinated state planning and production requirements,                            Mayors Coalition, a partnership among 15 inner-core
and local opposition to new housing have created a                                 communities,28 established a more ambitious goal of
housing shortage and affordability crisis. The pandemic                            185,000 units to be produced between 2016 and 2030 in
showed how our constrained housing delivery system and                             those communities. While the coalition includes some of
lack of regional coordination benefits those with means                            the biggest contributors to regional housing production,
(soaring home sales prices), while limiting opportunities                          including Boston, the group is well behind the permitting
for low- and moderate-income residents (concentration of                           pace needed to meet the 2030 goal (see Figure 33).
rental housing, high rents and increasing rents in lower-
cost markets). The policy section will emphasize the role
of comprehensive planning in balancing mobility, public
health, equity and climate goals with housing needs.

* This edition of the report does not feature scorecards by municipality because it seems sensible to pause in the wake of the pandemic, as municipalities deal
  with emergency supports. However, in addition to a regional housing plan, local best practices for housing production tracked in prior scorecards are even
  more important for housing recovery than before. Approaches to allow accessory dwelling units, multifamily by right and overall inclusionary zoning
  practices remain critical. Even without scoring, a collection of municipal-level data is offered and appears in tables in the Appendix.

                                                                                                  The Greater Boston Housing Report Card 2021               |     39
G RE AT E R B O S TO N H O U S IN G RE P O RT C A RD 2 0 21

                                                                         FIGURE 32

            Statewide permitting is on track to meet relatively modest Housing Choice production goal.

 Source: Mass.gov; U.S. Census Bureau Building Permit Survey

                                                                        FIGURE 33

                     Metro Mayors Coalition is well behind pace of ambitious 2030 production goal.

*The Metro Mayors Coalition housing production goal applies to 15 communities: Arlington, Boston, Braintree, Brookline, Cambridge, Chelsea, Everett, Malden,
Medford, Melrose, Newton, Quincy, Revere, Somerville, and Winthrop
Source: MAPC; U.S. Census Bureau Building Permit Survey

40   |   The Boston Foundation: An Understanding Boston Repor t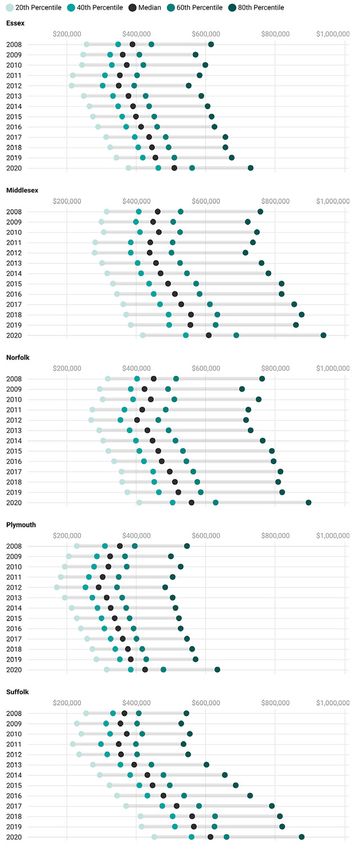
[ H O U S IN G M A RK E T ]

These goals are attempting to make up for decades of                            Washington, D.C. and Seattle metropolitan areas (see
declining production. Inadequate housing construction                           Appendix Figure 16 for the number of permits issued
has been an issue since the 1980s, with annual production                       by the 25 largest MSAs in 2019). This failure to provide
in the 2010s at just 52 percent of production levels in the                     enough housing has an impact on prices and makes it
1980s. This, despite the region’s experiencing strong                           more difficult for the region to retain residents while
population growth (especially for the Northeast) over                           welcoming newcomers. The pandemic has not helped;
the last couple of decades. Among other metro regions                           2020 production totals are expected to be slightly lower
across the country, Greater Boston consistently finds                           due to a brief construction pause in spring 2020.
itself situated toward the bottom in terms of per capita
                                                                                Not only has Greater Boston struggled to produce enough
housing production.
                                                                                housing, but the housing it produces is increasingly
While some other high-demand metros in the South                                concentrated in a few municipalities, most notably the
and West have added new housing at high rates in recent                         city of Boston, in both absolute numbers of units as well
years, Greater Boston lags alongside former industrial                          as relative to the existing housing stock (see Figure 34).
centers with limited housing demand and the California                          Exclusionary zoning and local opposition make it difficult
metropolitan areas where rent prices are also extremely                         to build housing outside of inner-core communities. State
high and increasing. In 2019, the Boston Metro area                             initiatives such as Chapter 40B and Chapter 40R have had
produced less housing per person than the New York,                             a positive impact on housing production, but they are not

                                                                       FIGURE 34

          With important exceptions, housing production as a share of housing stock remains very low.

Note: Permit numbers for Boxborough included the same multi-family development in both 2015 and 2016, it has only been included once in this analysis
Source: Census Building Permit Survey

                                                                                              The Greater Boston Housing Report Card 2021               |   41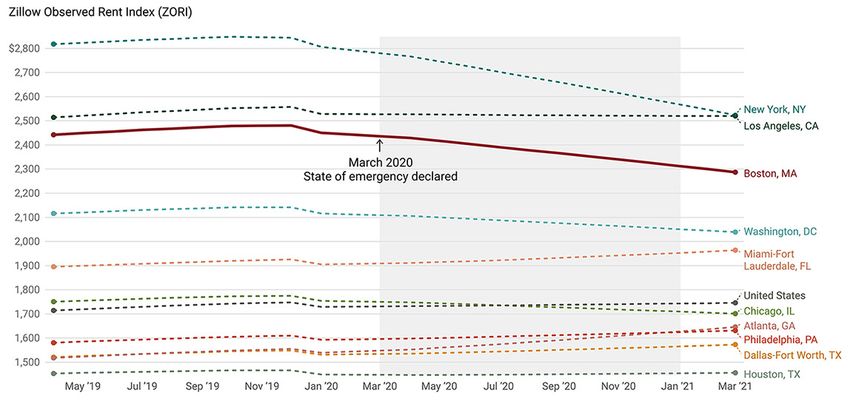
G RE AT E R B O S TO N H O U S IN G RE P O RT C A RD 2 0 21

nearly enough. If the region is to meet its production                   Low vacancy rates and a hot market show the
goals, more municipalities will have to step up to the plate.
A table of building permits—both as absolute numbers
                                                                         downside of not developing housing.
and as a share of existing housing stock—for single-family               A useful way to measure the impact of the production
and multifamily units for each municipality in the region                shortage is through vacancy rates. A “healthy” vacancy
is available in Appendix Figure 17 of this report.                       rate is when the market has enough inventory to account
                                                                         for the natural mobility of households. With adequate
Having enough housing is one challenge and locating that
                                                                         inventory on the market, a person selling a home or
housing in efficient locations that improve mobility and
                                                                         ending a rental lease can expect to find another property
minimize climate impacts is another. The region has rapid
                                                                         suitable to their needs. When vacancy rates are too low,
transit and commuter rail infrastructure that allow for
                                                                         it becomes challenging to find a suitable, affordable
shorter, more environmentally friendly travel into urban
                                                                         housing option. A “healthy” vacancy rate is often
and commercial centers. To best utilize these systems,
                                                                         considered to be roughly two percent for home owner-
municipalities should prioritize housing development
                                                                         ship and six percent for rentals, by industry standards.
within walking distance of a station, a concept known as
transit-oriented development. As explored on the Transit                 In the years leading up to the pandemic, vacancy rates
Oriented Development Explorer (TODEX) website, access                    in Greater Boston remained incredibly low. By 2019, the
to transit is not evenly distributed across the region: Many             homeownership vacancy rate was down to 0.6 percent
commuter rail stations have very low surrounding densi-                  in Middlesex County. The rental market experienced
ties.29 Municipalities with commuter rail access have failed             a similar pre-pandemic trend, declining to as low as
to produce enough new housing along their transit-rich                   2.9 percent in Suffolk and Plymouth counties (see Figure
corridors. As analyzed by Brookings and Boston                           35). Across the region, vacancy rates remain well below
Indicators, building moderate amounts of housing near                    the two and six percent benchmarks. With vacancy rates
transit can lower the barrier to entry into some of Greater              so low in the region, it is little wonder that housing prices
Boston’s most inaccessible communities.30                                and rents remain astronomical.

                                                                   FIGURE 35

                          In the years leading up to the pandemic, vacancy rates in Greater Boston
                                         remained well below “healthy” benchmarks.

 Source: U.S. Census Bureau ACS 5-Year Estimates

42   |   The Boston Foundation: An Understanding Boston Repor t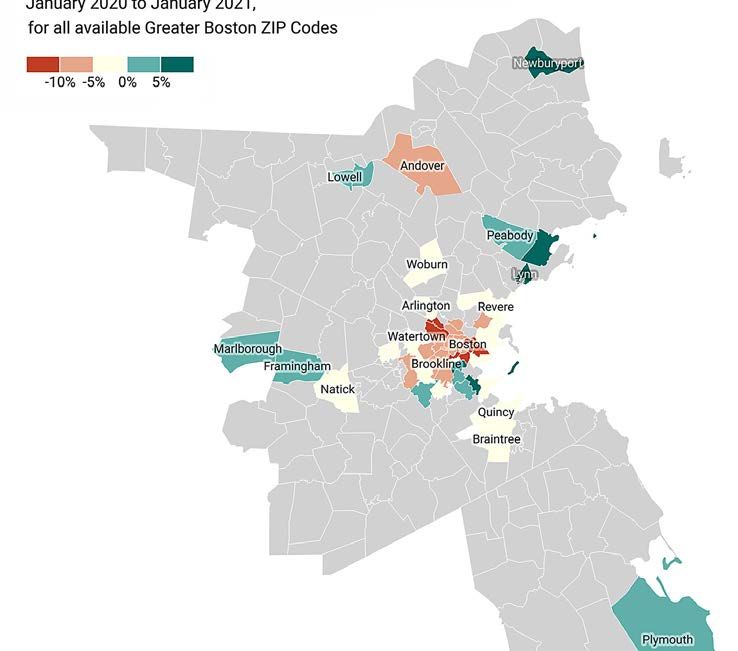
[ H O U S IN G M A RK E T ]

PANDEMIC IMPACTS                                                pandemic, the local housing market started heating back
While reliable vacancy data are not yet available for 2020,     up in June 2020. From July onward, house sale listings
market activity suggests vacancy rates will be even lower       were coming off the market 20 to 37 percent faster than in
in the ownership market in 2020. As Figure 36 illustrates,      2019, which was already a hot market to begin with. The
the surge in buyer demand during the pandemic,                  pandemic ignited a surge in demand for new homes but
combined with a lack of inventory, caused a decline in          did little to loosen up additional supply. Years of under-
average listing duration and upward pressure on prices.         production meant that the region was not prepared for
Following an initial stall at the beginning of the              the rapid shift in demand.

                                                          FIGURE 36

                       A surge in demand, combined with a lack of inventory, caused decline
                            in the median market listing duration during the pandemic.

 Source: Realtor.com

Houses: Too expensive to buy and                                the summer of 2020, as constrained supply and pent-up
too expensive to rent.                                          demand combined to place upward pressure on prices.
                                                                Likely spurred by stuck-at-home consumers’ desire for
Region-wide, home sale prices have steadily trended
                                                                more living space and low mortgage interest rates, with
upward since the Great Recession. Insufficient
                                                                no parallel increase in supply, the region’s housing sales
production of new housing in Greater Boston has kept
                                                                market set records in 2020 (see Figure 37). In particular,
that trend in motion. By 2019, home sale prices in Greater
                                                                single-family homes reflect outsized, likely unsustain-
Boston were among the highest in the nation. Despite
                                                                able, price leaps across all counties in the region.
rising income levels pre-pandemic, home price increases
were outpacing income growth and homeownership                  By February 2021, median sales prices approached
was becoming unattainable for a growing percentage of           $700,000, a full $100,000 increase over February 2020, the
households. In the early phases of the pandemic, housing        last month before the pandemic. This housing price surge
prices grew more gently than usual and then shot up in          was coupled with low listing durations, despite normal

                                                                           The Greater Boston Housing Report Card 2021      |   43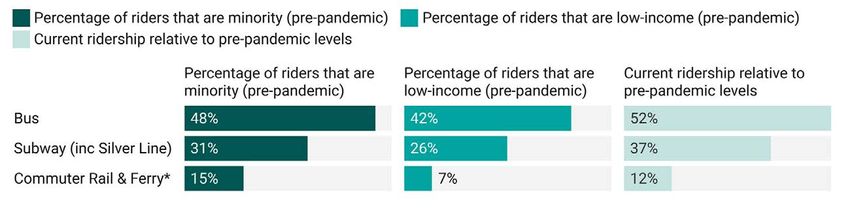
G RE AT E R B O S TO N H O U S IN G RE P O RT C A RD 2 0 21

                                                                   FIGURE 37

                                Single-Family Home and Condo Price Distribution, 2008-2020

             Single-Family Home Price Distribution                             Condo Price Distribution

Source: The Warren Group

44   |   The Boston Foundation: An Understanding Boston Repor t
[ H O U S IN G M A RK E T ]

amounts of total home listings, indicating that it was                         flexibility for additional homes to come on the market
demand wave that drove up prices. Along with the cost of                       as it becomes safer and more common for people to be
borrowing for a home reaching new lows, new pandemic-                          together inside homes again. Further, time will tell which
related flexibility to move for white-collar workers may                       elements of post-pandemic life may influence the housing
have also contributed to housing demand, as Figure 38                          market. For example, remote work could become a
suggests.. This sharp trajectory of the current trend may                      permanent part of white-collar work life in the future.
lessen as the public health crisis abates, allowing more

                                                                       FIGURE 38

                    Boston’s suburbs have a high share of workers capable of working from home.

     Source: Boston Indicators, using 2018 Bureau of Labor Statistics Occupational
     Employment Statistics. 2017 LEHD Origin-Destination Employment Statistics.
     Note: Methodology courtesy of Dingel & Neiman, and Veuger, Brooks & Begley.

In a region already struggling to control its housing costs,                   spend an ever-increasing share of their income on rent.
the pandemic exacerbated the regional homeownership                            Between 2000 and 2019 rental cost burden levels shot up
wealth gap. Those who owned property are experiencing                          across the region. This trend was especially hard felt in
record value growth while those who could not afford a                         inner core and Gateway Cities, which saw a surge in
home before the pandemic are now less likely than ever                         demand that drove prices to record highs.
to bridge the gap.
                                                                               During the pandemic, however, the sales market and the
The pre-pandemic rental market largely followed a                              rental market diverged onto two different trajectories.
similar trajectory to the sales market. After the 2008                         The rental market in the Boston Metropolitan Statistical
recession, median rents quickly climbed across the                             Area (MSA) overall dropped, according to Zillow (see
region. At the same time as the homeownership market                           Figure 39). The Zillow Observed Rent Index measures
was becoming less accessible, households were forced to                        change in rents over time and weights rental properties

                                                                                         The Greater Boston Housing Report Card 2021      |   45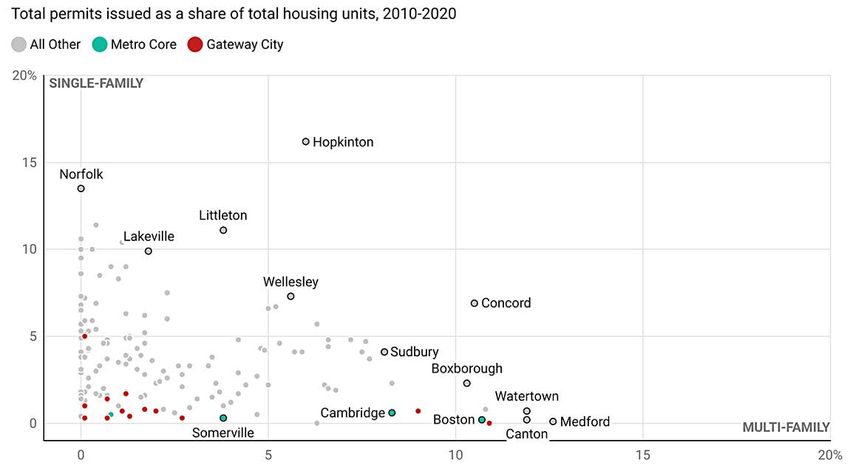
G RE AT E R B O S TO N H O U S IN G RE P O RT C A RD 2 0 21

                                                                   FIGURE 39

                      Compared with the 10 largest MSAs, Greater Boston saw sharp rent decreases
                              since the start of the pandemic, second only to New York.

Rental prices have been inflation-adjusted to 2020 dollars.
Source: Zillow Research

with U.S. Census data to represent the rental market                     crisis eases, businesses reopen, white collar work
as a whole, not just openings listed online. While the                   presumably resumes some in-person activity (with
10 largest MSAs mostly held their comparative position,                  potential for increased flexibility), and students return
the Index shows a dramatic decrease in Greater Boston                    to more traditional in-person class instruction.
rents by several hundred dollars compared to pre-
                                                                         Listings in the Boston rental market experienced a rare
pandemic levels.
                                                                         decrease, falling markedly during the pandemic. As
Early data indicate the apparent overall decrease in rents               illustrated in Figure 41, in Boston, median two-bedroom
was not at all uniform across the region. A drop in rental               rent dropped from $2,108 in December 2019 to $1,674 in
demand, and therefore prices in high-rent areas, was                     December 2020. The most likely cause was a sudden drop
certainly depressed in part by restrictions on inter-                    in demand, as many students (especially international)
national in-migration, as well as on in-person class                     did not attend in-person classes in 2020. Thus, while the
instruction at area colleges and universities. At the same               resulting decline in median rents was good for potential
time, increased mobility and desire for more in-home                     renters in the region, the cause of the decline was not a
space for some workers may have brought rental markets                   desirable nor replicable condition. Students and others
in the region together: some municipalities saw rent                     will be returning to the area this year, and we can expect
increases while others, some of which rarely see                         the rental market to act accordingly. If the region intends
decreases, showed large declines in prices (see Figure 40).              to maintain lower rent prices, it will need to do so via an
It is unclear what will happen regionally as the health                  increase in supply.

46   |   The Boston Foundation: An Understanding Boston Repor t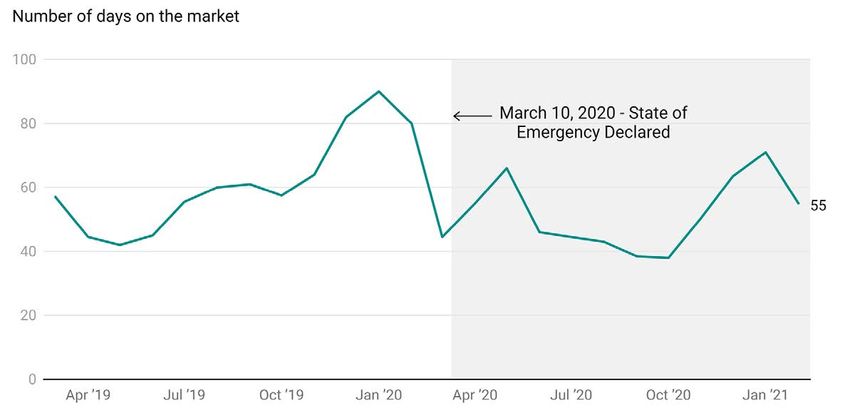
[ H O U S IN G M A RK E T ]

                                                       FIGURE 40

      Uneven distribution of rent changes, highly variable across the region where early data is available.

     Source: Zillow Observed Rent Index (ZORI)

                                                       FIGURE 41

                          Median 2-bedroom rents in Boston fell markedly during the pandemic,
                                  during sudden drop in demand for student housing.

Source: Apartment List

                                                                      The Greater Boston Housing Report Card 2021      |   47
G RE AT E R B O S TO N H O U S IN G RE P O RT C A RD 2 0 21
Transit has been essential in ensuring of the pandemic did seek to preserve or expand service on
routes with high ridership or that serve transit-dependent
mobility for the people who need it most populations, 33 any cuts to transit service reduce reliability
during the pandemic. and ridership in ways that are difficult to recoup once
Housing, mobility and employment are intertwined. widespread demand returns. With federal assistance
A high-functioning transit system helps connect us staving off some of the financial hardship borne by the
from our homes to the rest of the region. Among MBTA MBTA34 and signals of a renewed federal commitment
services, low-income riders and communities of color to funding transit, 35 there is hope among many transit
are most dependent on bus service and rapid transit proponents that coming out of the pandemic Greater
(see Figure 42).31 Low-wage workers are also less likely Boston may see fully restored service and even a
movement toward a more connected, bi-directional,
to work remotely, a situation that has created a
high service transit system.36
disproportionate reliance on public transit among
low-income and frontline workers during the pandemic. Investments in other non-car transportation will be
While overall transit ridership declined sharply during essential, too. Prior to the pandemic, the Greater Boston
the pandemic, train stations and bus lines serving region earned the lamentable distinction of having the
communities with high proportions of low-income worst traffic in the country.37 While traffic initially
residents and frontline workers have retained a notable declined sharply following the onset of the pandemic,
share of the riders.32 Frontline workers have kept our it is returning to pre-pandemic levels across much of the
economy and society functioning and our transit system state.38 This is unsustainable from a climate, land use and
is critical in helping these workers move around the quality of life perspective, and moving away from single-
region, further demonstrating that transit is not a occupancy vehicles is the only path forward to improving
commodity but an essential service and public good. traffic outcomes.
Because low-income households tend to be more One direct way to connect housing policy with transit
dependent on public transit service, they are more and climate outcomes is to develop more dense housing
impacted by service interruptions and cuts. While the in areas well-served by transit. With recently enacted
MBTA’s “Forging Ahead” plan for service cuts in light legislation that requires communities served by the
FIGURE 42
MTBA Ridership Shares by Mode, Income and Race/Ethnicity
Pre-pandemic ridership demographics come from the MBTA’s 2015-2017 Rider Survey. Low-income riders were identified as those with a household income of
less than 60 percent of Area Median Income. Minority riders were identified as riders identifying as non-White and non-Hispanic. Recent ridership for bus and
subway were calculated based on the difference between average weekday ridership for the week ending 4/30/21 relative to the week ending 3/13/20. Commuter
rail ridership retention was taken from the MBTA’s Forging Ahead plan, which included data as of October 2020.
Source: MBTA Passenger Survey 2015-2017, MassDOT weekly data on station validations and bus ridership, MBTA Forging Ahead Presentation, Oct. 2020
48 | The Boston Foundation: An Understanding Boston Repor t[ H O U S IN G M A RK E T ]
MBTA to have at least one district that allows for dense ■ The legislature should expand the new multifamily
multifamily housing by right, 39 we are poised to make zoning mandate for MBTA communities to require
great strides in improving the way we coordinate housing a minimum housing density be allowed by zoning
policy with other key objectives such as transportation within a half mile radius of each rail station, rather
improvements and greenhouse gas reduction. As will be than just in a single multifamily zoning district.
discussed in the policy section, zoning alone will only go In developing and implementing guidelines for
so far, and other strategies, such as shared streets, transit the existing law and this proposed expansion, the
investments and reducing or eliminating parking and Massachusetts Department of Housing Community
other car infrastructure can complement zoning in a way Development (DHCD) must ensure that the guidelines
that encourages different mobility choices and patterns. result in zoning that enables a level of production
consistent with regional housing supply needs.
POLICY RECOMMENDATIONS ■ To create more opportunities for adaptive use, facilitate
While the past year has highlighted the region’s chronic the development of underutilized office space,
supply problem, some significant state-level policy college campuses and other facilities to provide new
changes are now poised to increase the number of homes opportunities for large-scale housing development
across the region. Most notably, the legislature enacted in desireable, accessible locations. It remains to be
Housing Choice legislation, which lowers the threshold seen exactly how much the pandemic will alter the
required for zoning changes that promote housing landscape of where we work, where we congregate
production from a supermajority to a simple majority. The and how we use space. What we do know is that
legislature also enacted a mandate for multifamily zoning housing demand remains high in Greater Boston,
in all communities served by the MBTA. In combination and we need more housing. This may be a rare moment
these are two powerful tools that will facilitate housing to explore the use of vacant or underutilized office,
production in transit-rich corridors. Additional legislative commercial and institutional spaces for housing.41
actions and policy priorities would use this momentum ■ Restore the Commonwealth’s Office of State Planning
and complement these landmark zoning reforms. (which was disbanded 1979) to coordinate planning
and technical assistance to cities and towns across state
Build on recent zoning reforms: Allow agencies and in collaboration with the state’s regional
multifamily housing development by right, planning agencies. The state should restore the capacity
create more opportunities for adaptive use, of DHCD to provide direct technical assistance to cities
empower regional planning, and embrace and towns through its community services division.
This body would be able to plan and work toward
sustainable development. regional and local housing production goals with
■ Allow small-scale multifamily housing development a level of authority that does not currently exist.
by right in all residential zoning districts. Oregon, for ■ Establish new green building standards through the
example, requires its larger cities and towns to allow state building code (rather than through a patchwork
up to four-unit properties in single-family zones.40 of local regulations) that are carefully calibrated and
A similar approach in Greater Boston could open regularly updated to achieve the greatest climate
low-density exclusionary single-family neighborhoods impact possible without impeding housing
to infill development. These new zoning requirements production.
should be phased in, in conjunction with the state’s new
multifamily zoning mandate for MBTA communities,
and be accompanied by robust technical assistance to
cities and towns.
The Greater Boston Housing Report Card 2021 | 49G RE AT E R B O S TO N H O U S IN G RE P O RT C A RD 2 0 21
Improve the quality and frequency of commuting). Some of this has already occurred,
transit service. with more frequent and weekend service insti-
tuted on several lines experiencing high ridership
Frequency of daytime service and weekend and late- gains and/or serve “transit-critical” communities.43
night service are critical equity and public benefit Creating this level of service across the region
considerations as well as for anyone seeking to buy, rent would allow for better transit access throughout
or develop new housing near transit. The MBTA proposed the region, including suburban communities, at
deep service cuts across the entire system late last year, a time when a multifamily zoning requirement
though it did increase service along some lines and routes is poised to create more housing opportunities in
based upon an equity analysis of rider retention data. these same locations.
While some proposed service cuts were walked back by
■ Introduce system-wide electrification. This would
the MBTA, from a housing perspective there should not
reduce travel times, reduce emissions and increase
be any cuts to service at all, particularly since federal
reliability and performance—changes that would
funding has made service cuts completely unnecessary.
in turn incentivize transit usage and create a more
Given the important connections between housing and favorable alternative to car use.
transit, particularly for low-income households, policies ■ Integrate fares to allow for free transfers between
that increase service and improve the quality of our bus, subway and regional train service.
transit infrastructure should be a focal point for housing
■ Better coordinate transportation and housing
policy. Rather than defending against service cuts and
planning. While the MBTA and MassDOT are
coping with a decaying system, attention should be
participating in the creation of guidelines for the
turned toward a broader and more comprehensive vision
new statewide multifamily zoning requirement
of the region’s transit system. The following measures
in MBTA communities, this level of coordination
would improve transit and facilitate higher levels of
between transportation and land use policy is
mobility and access from homes across the region.
uncommon. Having transportation planning
■ Service cuts should not be made solely on fare revenue. and housing planning that are responsive to one
As demonstrated earlier in this chapter, public transit another would create better connections between
is an essential service that keeps our region functional. housing and mobility.
Furthermore, if we wish to reduce car use, traffic
congestion and the associated climate impacts, we must Advance housing equity.
create a transit system that is fast, reliable, convenient Increasing equity through policy is crucial to the
and affordable, and that people see as a better choice wellbeing of the housing market in the region, not just the
than jumping in their cars. Service cuts send a signal most vulnerable places in the region. Greater Boston, like
that riders should not expect the service they need or the nation, has a troubling legacy of racial discrimination
want to be there in the future.
in access to housing, epitomized by explicit redlining that
■ Adopt the plan set forth by the Regional Rail vision, was sanctioned by the federal government well into the
championed by the advocacy group Transit Matters. 1960s. Those practices have put some people at a severe
The MBTA’s Fiscal Management Control Board (FMCB) multigenerational disadvantage in building wealth, as
voted on and adopted some of the recommended evidenced by the Federal Reserve Bank of Boston’s The
actions steps and these steps must continue to move Color of Wealth published in 2015. Low-income renters are
forward. This includes:42 displaced when people with higher incomes bid up prices
■ Implement frequent, bi-directional service on on artificially constrained supply of housing and when
the commuter rail (which should be renamed to new housing is unduly concentrated in just a few
indicate service to a broader set of needs than just neighborhoods.
50 | The Boston Foundation: An Understanding Boston Repor t[ H O U S IN G M A RK E T ]
The City of Boston and the Commonwealth have actively tax credits). Since these subsidy resources are limited
addressing this problem since the early 1990s by expand- and already vastly oversubscribed in the Greater
ing access to mortgage credit for previously underserved Boston region, affordable housing resources should
people and neighborhoods, but progress is slow. Recent be increased in the operating and capital budgets
interagency efforts by DHCD, MassHousing and the to support tenant purchases and other affordable
Massachusetts Housing Partnership (MHP) along housing strategies.
with outside partners established an important goal ■ Establish equitable access to housing as a state priority
of reducing the gap between White and non-White (e.g., in the state’s Qualified Allocation Plan for federal
homeownership rates by five percent or approximately
tax credits) with new developments having a clearly
52,000 households by 2030.
articulated strategy to advance housing equity priori-
The greatest way to achieve housing equity in the long tized for city and state funding.
run is to allow sufficient housing supply to meet demand,
actively confront housing discrimination, eliminate Experiment with building techniques
exclusionary zoning, ensure that every city, town and and strategies that could reduce housing
neighborhood is permitting a fair share of new housing, production costs.
and target affordable housing resources to those with
Current levels of affordable housing production meet
the greatest need.
just a fraction of the need for low-cost housing across
■ Cities and towns with strong market demand should the region. Affordable housing production remained
require that a reasonable percentage of affordable relatively flat in recent years with resources consumed
units be incorporated in all new developments. That by higher development costs, including construction
is particularly important in historically low- or costs per square foot that are 20 percent above the national
moderate-cost neighborhoods undergoing rapid average.
change and in areas served by public transportation.
■ State government should evaluate the cost-saving
Technical assistance should be provided with state
potential of modular housing construction and the
and federal resources to help communities utilize
feasibility of a Massachusetts-based factory supported
best practices and to ensure that sufficient density
by state investment.
is allowed to make the affordable housing requirement
economically achievable without impeding new ■ State and city housing funders should continue to pilot
housing production. the use of LEAN construction techniques for housing
(as is commonly used to reduce the cost of commer-
■ State policymakers should advance carefully consid-
cial/industrial construction) and prioritize funding of
ered policies to temper unreasonable rent increases
projects that meet design guidelines at lower costs per
that lead to displacement. Any state-level approach
square foot.
should be evidence-based and not create disincentives
for housing investment or construction. Market-wide ■ State and city funders should support continued
rent increase limitations recently adopted in Oregon market-testing of micro units and other alternative
and California (which impose a simple annual percent- product types with more potential to serve more
age cap on rent increases in excess of inflation) may be households at lower cost.
worthy of further consideration in Greater Boston.
■ Provide tenants with a right to first refusal to purchase
their properties (recently approved by the legislature
and vetoed by the governor). The economics do not
generally support tenant acquisitions without public
subsidy (such as federal and state low-income housing
The Greater Boston Housing Report Card 2021 | 51You can also read