Parimutuel betting markets: racetracks and lotteries revisited - William T Ziemba - Systemic Risk Centre
←
→
Page content transcription
If your browser does not render page correctly, please read the page content below
Parimutuel betting
markets:
racetracks and
lotteries revisited
William T Ziemba

SRC Discussion Paper No 103
September 2020
ISSN 2054-538X

Abstract
This paper surveys the state of the art in research in racetrack and lottery markets.
Market efficiency and the pricing of various wagers is studied along with new
developments since the Thaler and Ziemba JEP review. Other sports betting markets
are also discussed. The role of syndicates, betting exchange rebates, behavioral
biases and fundamental information is discussed.

JEL Classification: C02, C57, C79, D81, G11, G14, G41, Z23.

Keywords: parimutuel betting markets, efficiency of racetrack betting markets, lottery
strategies, favorite-longshot bias.

This paper is published as part of the Systemic Risk Centre’s Discussion Paper Series.
The support of the Economic and Social Research Council (ESRC) in funding the SRC
is gratefully acknowledged [grant number ES/R009724/1].

William T Ziemba, Sauder School of Business, University of British Columbia and
Systemic Risk Centre, London School of Economics

Published by
Systemic Risk Centre
The London School of Economics and Political Science
Houghton Street
London WC2A 2AE

All rights reserved. No part of this publication may be reproduced, stored in a retrieval
system or transmitted in any form or by any means without the prior permission in
writing of the publisher nor be issued to the public or circulated in any form other than
that in which it is published.

Requests for permission to reproduce any article or part of the Working Paper should
be sent to the editor at the above address.

© William T Ziemba, submitted 2020
Parimutuel betting markets: racetracks and lotteries revisited

                                  William T Ziemba
       Sauder School of Business (Emeritus), University of British Columbia and
           Distinguished Visiting Research Associate, Systemic Risk Centre,
                   London School of Economics, wtzimi@mac.com ⇤

                                           August 24, 2020

Abstract

This paper surveys the state of the art in research in racetrack and lottery markets. Market
efficiency and the pricing of various wagers is studied along with new developments since
the Thaler and Ziemba JEP review. Other sports betting markets are also discussed. The
role of syndicates, betting exchange rebates, behavioral biases and fundamental information
is discussed.
Key words: parimutuel betting markets, efficiency of racetrack betting markets, lottery
strategies, favorite-longshot bias
JEL codes: C02, C57, C79, D81, G11, G14, G41, Z23

Introduction

Racetracks and lotteries are interesting financial markets. These investments have negative
expected value for most investors. But they have wide appeal for entertainment, the
possibility of small and large gains, the intellectual aspects of their study and for insights
valuable in other financial markets. There are economic and behavorial e↵ects and an
extensive literature concerning biases, strategies, regulations and successes. Thaler and
Ziemba (1988) in a well cited paper analyzed these markets including their market efficiency
and rationality. They argued that
        ”wagering markets have a better chance of being efficient because the conditions
        (quick, repeated feedback) are those which usually facilitate learning”
  ⇤
      Thanks to Scott Brown, Steve Moffitt and Leighton Vaughan Williams for helpful data and discussions.

                                                     1
Parimutuel betting markets Ziemba
This paper focuses on racetracks and lotteries, but other sports betting markets have been
shown to be efficient. These include NFL football as shown by Panko↵ (1968), Sauer,
Brajer, Ferris and Marr (1988), Sauer (1998) and Ziemba and MacLean (2018). These
papers show that football betting markets like the Las Vegas NFL market are efficient and
and the spreads quoted reflect the true probability of winning. Like the stock market, there
are winning strategies based on mean reversion, risk arbitrage.
Financial economists have long been interested in the efficiency of financial markets. Kendall
[1953] examined the behavior of industrial share prices and spot prices for cotton and wheat.
By analyzing serial correlations, prices appeared to follow a random walk. In the 1960s
the focus was on defining efficiency and performing tests for a range of efficiency notions.
Roberts [1967] defined weak, semi-strong, and strong form efficiencies as holding when
stock market prices reflect all price information, all publicly available information, and all
information, respectively. Most financial markets have been shown to be efficient in the
weak form. The evidence for semi-strong is mixed; see Johnson and Sung (2008) for a
survey of the racing literature. The strong form is largely inefficient. See Fama (1970)
for a survey of this work in financial markets. The exceptions, termed anomalies, include
seasonal patterns such as the small firm January e↵ect, turn-of-the-month and year ef-
fects, holiday e↵ect, day of week, time of day, and cross-sectional regularities that apply to
stocks with low price to earnings ratios or with earnings surprises, etc. See the surveys by
Hawawini and Keim [1995, 2000], Ziemba [1994, 2012, 2020] and Keim and Ziemba (2000)
for more details.
Fama [1991] updated his earlier survey. Tests for return predictability focus on forecasting
returns using variables such as interest rates and dividend yields. Event studies formalize
the semi-strong form idea by testing whether or not there are adjustments of prices to
specific public announcements. Finally, the strong form concept is studied through tests
for private information. The evidence is that future returns are predictable from past
returns, dividend yields and term structure variables. On the face of it, this is a violation
of weak form efficiency. But, as suggested by Roll [1977], since every test of efficiency
must be a joint one with a maintained equilibrium hypothesis of price formation (e.g.,
the capital asset or arbitrage pricing models), this violation is confounded by the joint
hypothesis problem of whether there is a rational variation over time in expected returns
or systematic deviations from fundamental value.
One issue that makes stock market efficiency and rationality hard to test is the fact that
the markets do not have a fixed end point where the investments are settled. See Fama
(1970, 1991) and Roll (1977) on this. There are, of course, futures markets in equities to
hedge and essentially cash out cash equity positions. Also day traders have fixed end point
strategies. While arguments can be made that increased returns may be occurring because
of increased risk, which is difficult or impossible to measure accurately, there is evidence
that most or all of the gains in securities markets have occurred during the seasonally
2Parimutuel betting markets Ziemba
anomalous periods. Ritter and Chopra [1989] and Cadsby and Ratner [1992] show, for
example, that the only periods where risk as measured by the capital asset pricing model
is rewarded with equity returns is precisely at the anomalous periods such as the day before
holidays, the turn of the month, in the first two weeks of January for small stocks, etc.
Ariel [1987], Lakonishok and Smidt [1988], Hensel, Sick and Ziemba [2000] and Ziemba
[2012, 2020] showed that essentially all the stock market’s gains during the 20th century
in the U.S. occurred in the first half of the month. Event studies are more straightforward
and less controversial since they are able to provide more clear cut evidence of the e↵ect of
new information. Regarding strong form tests there is considerable evidence that corporate
insiders have private information that is not fully reflected in current prices.
MacLean and Ziemba (2020b) show that in sports having several good players is better
than one superstar for success. The same is true for thoroughbred stud fees, see Cameron
(2010), where having many good o↵spring is superior to one superstar. Also in executive
stock buying where purchases by several executives is a better signal of future prospects
than a single larger transaction, see Brown et al (2013).
Sports and betting markets are well suited for testing market efficiency and bettor rational-
ity. This is because vast amounts of data are available, in the form of prices (for devising
technical systems) and other information (for devising fundamental systems), and each bet
has a specified termination point when its final asset value is determined. For rationality
tests, markets with this latter property o↵er an advantage over markets, like securities
markets, where current value depends upon future events and current expectations of fu-
ture values. Also, some wagering markets have characteristics that reduce the problematic
nature of the aforementioned joint hypothesis test. For instance, Dana and Knetter [1994]
note that pointspread bets on National Football League games all have identical risk and
return characteristics, as well as similar horizons. This allows a test of efficiency without
specifying the bettors utility functions.
The special properties of sports betting and lotteries might lead one to speculate that they
are even more efficient than financial markets. However, there is another aspect to these
markets that confounds the notion of rationality: for them to be o↵ered, the average bettor
must lose. Indeed, given the transactions costs involved in these markets (e.g., about 13-
30% for horseracing and about 50% for lotteries), the average losses are large. This has not
stopped the search for profitable wagering systems, though, and there are some notable
successes. For example, Thorp (1962) demonstrated that card-counters can win playing
blackjack. This survey of research on horseracing, sports betting on football and basketball,
and lotteries reports numerous studies of efficiency in these markets. Several profitable
systems are also described, though1 . The continued success of these winning systems tends
to be related to some complicating factor in its development or execution. For instance, the
1
Beyond the academic work surveyed here, evidence abounds of individuals who have successfully beaten
the odds. See, for example, Akst [1989], Benter (1994, 2008) and Ziemba [2017, 2019a].
3Parimutuel betting markets Ziemba
system may involve short odds and complex probability estimation (e.g. place and show
wagering at the racetrack), it may rely on syndicates of bettors (e.g., cross-track horserace
betting), it could require extremely long time horizons (e.g., lotteries), or extensive data
collection and statistical work (e.g., fundamental handicapping systems for horseracing).
The winning systems described are, of course, just a subset of the winning systems used
in practice. The incentives to disclose details of a winning system may not be sufficient in
some cases given that such an action typically reduces the systems profitability as others
employ it. Finally, I also discuss optimal betting strategies for exploiting inefficiencies
when they are present.
Sports betting and lotteries involve substantial transactions costs. Because it directly
a↵ects prices, the take - what the gambling establishment keeps for its operation - is
properly accounted for in all of the analyses discussed in this survey. Another cost in these
markets is for information (e.g., tip sheets at the racetrack). Costly information requires a
redefinition of efficiency, one where prices are said to reflect information to the point where
the cost of additional information just equals the benefit of acting on that information.
But because they are difficult to measure, this survey ignores information costs (and other
transactions costs beyond the take). Thus, the general findings of efficiency gain further
support with the introduction of these other costs. In racing, the advent of rebaters has
driven the take from 13-30% for various bets to about 11-13% for large bettors. Just like
shopping at a wholesale market for food, large bettors get a quantity discount. The rebaters
and the large bettors share a discount given by the track for the signals (outcomes).
The net e↵ect of this is that these discounts bets are blended with the rest of the bets.
Rebates at a lower level are available to small bettors. For example, a win bet might have
a track-take of 15%. The rebate shop might take 5%, the bettor gets 5% o↵ and the track
gets only 5% for the signal, namely the results. So the rebate bettor pays e↵ectively 10%
and the track gets its 15% by charging the non-rebate wagerers more than 15%. For exotic
wagers such as exactas (getting the first two finishers in exact order) and other wagers, the
take is in the 20-25% area so the rebate is larger. The biggest race track betting market is
Hong Kong. There the standard rebate gives 10% back on losing bets of $10,000 plus Hong
Kong dollars. This update discusses changes and new information in these markets.
Racetrack betting markets
At a typical racetrack the market accepts wagers for about 20-60 minutes. These wagers
come from those at the track and from simulcasts that feed money into the betting pools
from all over the US and the world. In the past, there were separate pools for a given race
and type of wager with di↵erent prices that could be arbitraged as discussed in Hausch
and Ziemba (1990a, b). Now all the money goes into the same pools from the host track
4Parimutuel betting markets Ziemba
and many other betting venues.2
Racetrack betting is simply an application of portfolio theory. The racetrack o↵ers many
bets that involve the results of one to about twenty horses. Each race is a special financial
market with betting over a short horizon then a race that takes one or a few minutes. Unlike
the financial markets, one cannot stop the race when one is ahead or having the market
going almost 24/7. There is a well-defined end point. Like standard portfolio theory, the
key issues are to get the means right. In this case, it is the probabilities of various ijkl
finishes for a superfecta or ijk for place and show bets, and to bet well. For the latter, the
Kelly capital growth criterion is widely used and that maximizes the expected logarithm
of final wealth almost surely. Transaction and price pressure odds changes fit well into
the stochastic programming models discussed below; see Ziemba (2019a) for additional
formulations and numerical results.
Professional syndicates or teams have been successful as hedge funds with gains approach-
ing US$1 billion over several years for the most successful. This is not easy as the markets
are quite efficient, see e.g. Ali (1977, 1979), Hausch and Ziemba (2008), and Hausch, Lo
and Ziemba (1994, 2008) for a review of the literature. Besides the advantages of rebates,
over half the betting is not recorded in the pools until the race is being run. This is because
monies are bet near the start of the race and come from many o↵ track sites which are
combined with the on-track bets into the track pool. All this takes time. So estimates of
future prices are crucial. Betting exchanges such as Betfair in London allow short as well
as standard long bets. This allows for more arbitrage and the ability to take advantage of
known biases.
Some of the bets involve multiple horses in a given race while others involve multiple races.
The wagers are basically of two types: high probability of winning low payo↵ bets and
low probability high payo↵ bets. The latter can return a million dollars or more. Table 1
describes a number of the bets.
2
The arbitrages called locks in the gaming industry occur because the racetrack minimum payo↵ is 5%
or 10% profit after the parimutuel payout. So with a super horse that is highly bet, you can construct
a large bet on the super horse plus small bets on the other horses so a profit is guaranteed without risk
for place or show wagers. Hausch and Ziemba (1990b) developed this and derived the conditions for the
arbitrage to exist and showed how to calculate the bet sizes. If the bets on the non super horse are assumed
to be equal in the 5% area, then a lock exists when: K > 1 Q((n 1)
21(n 3)
where K = the fraction of the show
bet on the super horse, the show bet on the favorite is KS, S is the total show pool and the bets on the
other horses are (1(n K)S
1)
. A linear program can calculate the wagers for unequal bets. In the US, such a
lock occurs about 10 times per year with a gain of about 2%. Ziemba and Hausch (1987) pointed out a
flaw in the UK and Ireland betting rules. They have a minimum payout like the US which is to get your
money back. However, the pool was split di↵erently so that the payo↵s for the losing bets do not pay for
the winning bets because the net pool is shared equally after the take. This can lead to a minus pool where
the house has a loss and an arbitrage exists for the players. In a followup paper, Jackson and Waldron
(2003) fully analyze this and they successfully exploited it in 1998 in the UK and Ireland until the tracks
eliminated the flaw in 1999 in the UK and 2000 in Ireland.
5Parimutuel betting markets Ziemba
Table 1: Common US racetrack wagers
High probability low payo↵ win, place, show
Low probability high payo↵ pick 3-6
One horse is involved win
Two horses are involved place, exacta
Three horses are involved show, triactor
Four horses are involved superfecta
Two races are involved double
Three races are involved pick 3
Four races are involved pick 4
Five races are involved pick 5
Six races are involved pick 6 and Rainbow pick 6
N races are involved place pick all
Investing in traditional financial markets has many parallels with racetrack and lottery bet-
ting and much of the analysis is similar. Behavioral anomalies such as the favorite-longshot
bias are pervasive and also exist and are exploitable in the S&P500 and FTSE100 futures
and equity puts and calls options markets. Biases there favor buying high probability fa-
vorites and selling low probability longshots just like the high probability low payo↵ racing
wagers. See Hodges, Tompkins and Ziemba (2004), Tompkins, Ziemba and Hodges (2008)
and Ziegler and Ziemba (2015) for data and calculations. But in complex low probability
high payo↵ exotic wagers such as the Pick 6, the bias reverses to overbet the favorite so
one must include other value wagers in the betting program.
Fundamental information such as breeding is important and is especially useful for the
Kentucky Derby and Belmont Stakes where horses have never run that far before. The
idea is that more stamina is needed to win these races from the sires in the horses lineage.
Since the horses have never run this distance before, a forecast of how they might do from
their breeding is helpful. The key idea is that some stallions called chef-de-race impart
consistent speed-stamina in their o↵spring. These stallions are identified and classified
and it is they who essentially form the racetrack breed. The speed versus stamina is
measured by a dosage index using the five categories: brilliant, intermediate, classic, solid
and professional with more stamina and less speed in the latter categories. See Hausch,
Bain and Ziemba (2006) and Gramm and Ziemba (2008) who study this by merging the
odds (prices) with expert opinion (breeding measured by dosage) and the comprehensive
book Roman (2016).
Figure 1 shows the average dosage index or speed over stamina for the average winner of
the 1 14 mile Kentucky Derby and 1 12 mile Belmont stakes as well as a large number of high
quality races at di↵erent distances. It was compiled from race data of Steve Roman. The
conclusion that the winners of longer races have lower dosages which means more stamina
6Parimutuel betting markets Ziemba
SP and Optimization in Horserace Betting 3
5.5
Average Dosage Index
5
4.5
4
3.5
3 Belmont stakes
1½ miles
2.5
Kentucky Derby
2 1¼ miles
1.5
6 8 10 12
Distance (Furlongs)
Figure
Figure 1 Average
1: Average dosage Dosage of Winners
of winners of plus
of $25,000 $25,000
purePlus
race Pure Race bySource:
by distance. Distance.
Roman
(2016)
fund.
and less Biases
speed. there favor buying high probability favorites and selling low
probability
The calculationslongshots
are simple just like
and theuseful.
very high probability
For example,low payo↵
a horse racing
named Staywagers.
Thirsty
Buta in
has complex
dosage profilelow probability
of 4-6-16-0-0. high
That is payo↵ exotic
4 brilliant pointswagers
(pure such
speed);as6the Pick 6,
intermediate
points,
the bias 16 classic points,
reverses to zero solid the
overbet and zero professional
favorite so one(extreme stamina)other
must include points.value
These
are categories on the speed-stamina space. You can think of this as a discrete probability
wagers in the betting program. Fundamental information such as breeding
distribution. Only the chef-de-race stallions (that is those that breed consistent character-
is important
istics and isinespecially
in their o↵spring) the horse’s useful
pedigreefor the 16
count: Kentucky Derby and
for first generation sires,Belmont
8 each for
Stakes
the secondwhere horses
generation, havefornever
4 each run
the four that
third far before.
generation and finally 2 for the eight fourth
generation
Figure sires. So eachthe
1 shows generation
averageisdosage
equally or
important.
speed over If a stamina
chef is in two categories,
for the averagethe
points
winner areof
split.
the Some generations
1 41 mile Kentuckymay Derby
have noandchefs.1 1Lists of Belmont
these chefs-de-race stallions
by category and decade that form the thoroughbred breed 2 mile stakes as
are in Roman (2016).
well
as a large number of high quality races. The idea is that more stamina is
The dosage
needed toindex
win isthese races from the sires in the horses lineage. Since the
horses have never run this distance
Brilliant before, +
+ Intermediate a 1/2
forecast
Classicof how they might
DI =
do from their breeding is Solid + Professional
helpful. See Hausch,+ 1/2 Classic
Bain and Ziemba (2006) and
Gramm
Despite its and Ziemba
simplicity and (2008)
crude tailwho study the
weighting, thisindex
by does
merging
seem the oddsAn(prices)
to work. example
ofwith expert opinion
the pedigree and dosage (breeding
of the 2005measured by dosage).
Belmont Stakes winner, Afleet Alex, is in Tables 2
and 3.A horse named Stay Thirsty in race 12 on Travers Day (see section 9)
hasevidence
The a dosage profile
is that ofwith
horses 4-6-16-0-0. Thatabove
dosage indices is 4 4.00
brilliant
do not points
win the (pure
Kentuckyspeed);
Derby.
From 1979-2010 none
6 intermediate did, though
points, here have
16 classic been azero
points, few exceptions
solid andsince.
zero professional
Apoints. Theseisare
dual qualifier categories
a horse on the
whose dosage speed-stamina
index is 4.00 or lower,space.
which You
is the can
limitthink of
suggested
for
this as a discrete probability distribution. Now each chef-de-race stallionof
maximum speed in the pedigree for a Kentucky Derby winner, and within 10 pounds
(that is a stallion which breeds consistent characteristics in their o↵spring)
7
in the horse’s pedigree counts: 16 for first generation sires, 8 each for the
second generation, 4 each for the four third generation and finally 2 for the
eight fourth generation sires. So each generation is equally important. If a
chef is in two categories, the points are split. Some generations may have
no chefs.winner from 1940 to 1980 had a DI exceeding 4.0, despite about one in seven entrants
having a DI that high.
The Dosage Index is not a direct measure of the quality of a horse. One
quality measure is the experimental free handicap (EFH), an annual ranking of
two-year-old
Parimutuel thoroughbreds
betting markets that raced in select races in the United States. (see Ziemba
TABLE 1 Pedigree and Dosage Index Calculation for 2005
Belmont
Table Stakes Winner
2: Pedigree Afleet
for the 2005Alex
Belmont Stakes Winner Afleet Alex
Mr. Prospector Raise a Native (B)
(B/C) Gold Digger
Afleet
Venetian Jester
Polite Lady
Friendly Ways
Northern Afleet
Northern Dancer (B/C)
Nureyev (C)
Special
Nuryette
Tentam
Stellarette
Square Angel
Roberto (C)
Silver Hawk
Gris Vitesse
Hawkster
Chieftain
Strait Lane
Level Sands
Maggy Hawk
Utrillo II
Hawaii
Ethane
Qualique
Sensitivo
Dorothy Gaylord
Gaylord’s Touch
the top 2 year old horse on the experimental free handicapping ratings. Gramm and Ziemba
(2008), Hausch, Bain and Ziemba (2006), Roman (2016) and Ziemba (2019a) show that
such horses have superior performance in the Kentucky Derby and Belmont Stakes.
The breed is moving more towards speed and a number of horses with dosage indices above
the historical 4.0 cuto↵ have been winners. In the long 1 12 mile Belmont almost all the
winners have had low dosage below 3.00, meaning they have stamina in their pedigree. Since
2000 there have been some Kentucky Derby winners with dosage above 4.00 but barely
any in the Belmont. Gramm and Ziemba (2008), Roman (2016) and Ziemba (2019a) study
this and provide results.
In racing another major change is those markets are many more types of bets including
ones that are essentially lotteries and betting exchanges in London and elsewhere that
allow short as well as long wagers to hedge, eliminate or increase the investment positions.
Since these are in continuous time, this allows for mean reversion risk arbitrage during the
race as the horses are running well or poorly.
One wager that historically has had a large betting pool is the Pick6 and similar wagers as
P3, P4, P5 in the US , Hong Kong and other venues. Payo↵s are frequently large and even
8Elsevier ch15-n50744.pdf 2008/6/26 6:27 pm Page: 313 Trim: 7.5in × 9.25in Floats: Top/Bot TS: diacriTech, India
Parimutuel betting markets Ziemba
Marshall Gramm and William T. Ziemba 313
Table 3: Dosage Index Calculation for 2005 Belmont Stakes Winner Afleet Alex
Generation Sire Brilliant Intermediate Classic Solid Professional
1 Northern Afleet
2 Afleet
Hawkster
3 Mr. Prospector 2 2
Nureyev 4
Silver Hawk
Hawaii
4 Raise a Native 2
Venetian Jester
Northern Dancer 1 1
Tentam
Roberto 2
Chieftain
Utrillo II
Sensitivo
Total 5 0 9 0 0
NOTE : Dosage Index = (5 + 0 + 9/2)/(0 + 0 + 9/2) = 2.11.
http://www.jockyclub.com/experimental.asp). Conducted since 1933 by the Jockey
larger withClub, the EFHbut
carryover assigns
the the top runners of
probability a figurative
winningweight
is low on abecause
scale thatitusually has
is difficult to pick
the two-year-old champion weighted at 126 lb.6 Exceptional horses have been weighted
all six winners or even five of six for a smaller consolation prize. At
up to 130 lb. Other top horses are assigned lower weights based on perceived ability
$2 per combination
the wager must
until abe high
cutoff to haveat aabout
is reached reasonable chance
100 lb beyond of no
which winning. Small
more horses are bankrolled
classified. bettors
Usually
often bet the top there
horses are in
15 the
to 30six
horses
racesclassified
and they within 10 lbaofsmall
have the top-weighted
chance of horse.
winning and if
Roman
they win the payo↵(1981)is observed
likely tothatbestarting
smallin as
1972, most are
there Kentucky
likelyDerby winners
to be many were rated
winners sharing
within 10 lb of the top-weighted horse. This observation led to
the parimutuel pool. Thus giving large syndicates who can have more combinations an the designation “dual
qualifier” for any horse that was weighted within 10 lb of the top-weighted horse on the
advantage. EFH (indicating the quality of the horse) and had a DI less than or equal to 4.0.7
Professional handicapper James Quinn offered a second measure of quality to add
late-developers to the list. He defined what we call an “asterisk qualifier” to be any
The Rainbow Pick
horse that: (1)6won at least one of a selection of premier races prior to the Kentucky
Derby or Belmont Stakes; (2) had a DI less than or equal to 4.0; and (3) was not rated
The Rainbowwithin 10 lb (called
Pick6 on the EFH.theAEmpire
horse is aSix
“dual-or-asterisk
in New York qualifier”
stateifand
it qualifies
otherfor one at other
names
of these two categories.
racetracks) has become the substitute to the ordinary Pick6 which has lost favor as it it
too expensive for bettors to have a reasonable chance of winning.
6 Ranking horses by weight is a familiar concept at the racetrack. In handicap races, the top horses carry greater
The idea isweight
to create
( jockey +large
saddle +payo↵s
additionalfrom
weights aif necessary)
small wager which is horses.
than the less-qualified a lottery typeofidea mixed
Handicapping
this sort occurs only in select races and is intended to make the race more competitive.
with fundamental
7 Some people expand the dual qualifier category to include any horse that is declared a champion in a or
handicapping skill. The Rainbow Pick6 tickets are ten twenty cents
country
rather thanother
$2.than the U.S. and has a DI less than or equal to 4.0. In this chapter, only the first definition was used.
The bet has two prizes. The jackpot is awarded to the holder of the unique Pick 6 ticket.
If there is no unique P6 winner but multiple P6 winners, then, after a 20% take, the net
9Parimutuel betting markets Ziemba
pool is given 60% to be divided by the multiple P6 winners to share and 40% goes to the
carryover. If no one wins the P6 then the entire net pool goes to the carryover. So the
expected value of a bet has three parts, namely:
EX= (Prob you win the unique P6) times (Value of unique P6 which is the carryover plus
today’s entire net pool) + (Prob you win a non-unique P6) times (Value of each share of
the P6) + Rebate.
There is also no 5/6 consolation prize but a shared P6 second prize is awarded if there are
two or more P6 winners. So with the the cheap 10 cent tickets, $300 will give the bettor
$6000 worth of $2 P6 action which frequently wins the P6. So almost for sure the P6 will
have multiple winners on most days. There have been very large payo↵s as in lotteries. In
February 2013, the carryover reached $3,107,159 by Thursday the 21st. The jackpot was
not won on that day so the carryover reached $3,249,259.28 going into Friday.
It is clear that to have a chance to be the unique P6 winner you usually need 3, 4 or even
5 bombs (longshots). That is it is very unlikely to have so many longshots winning. Two
bombs will not usually be enough because one can take all the horses in two races for say
10x10=100 combinations but that’s only $10 times the bets made in other races. So the
strategy to win the jackpot must be to take some potential bombs in 3, 4, 5 or even 6
races along with some more favored horses in the other races. Observe that using all is not
worth much — you can win a shared second prize but it is too expensive so you might win
the P6 but lose money on the bet. And taking all the horses in 3,4, and 5 races becomes
very expensive fast. This usually focuses on 3-4 potential bombs in 4, 5, or 6 races but will
likely lose as more favored horses win some of the time. Suppose we take the four longest
odds horses in four races and we take two horses in the other two races. Then the cost =
$0.10 · 22 · 44 = $102.40 less rebate.
✓ ◆
6 6!
But there are ways of doing this, that is 4 bombs and 2 other horses = 2!4! = 15. So
2
we are up to $1536 with the question which of the 2 horses to pick in the other two races.
So we might need more money. However we might need only 2 or 3 bomb possibilities in
some of the other 4 races. So to do this, the cost is about $1500 to $3000 less the rather
low rebate of about 3.5% per play on these wagers. You might need 10 or more such plays
to win the jackpot and you may never win. But with a carryover at over $3 million, such
a strategy has positive expectation and might work as the probability of winning can get
close to one. In fact it did win on Friday February 22, 2013. The Rainbow P6 was Races
5-10. The payo↵s of the winners for a $2 ticket were:
R5=$114; R6=$11.40; R7=$36.80; R8=$17.20; R9=$23.60 and R10=$23.00.
Playing the regular P6, the second prize requires di↵erent types of tickets and basically is
not a good bet because of the 40% carryover and the large track take because going for
the second prize has essentially zero chance of getting the jackpot namely the unique P6
10Parimutuel betting markets Ziemba
win. Rebates bring back about 8% but still the e↵ective payback = 60(-80)+.08=0.56 or
a huge 44% track take.
But the jackpot has a positive expectation. However, that’s hard to estimate as the prob-
ability of winning the first prize and the size of the shared second prize are both very hard
to determine. While this approach gives a decent chance of eventually winning the first
prize, it likely would give some second prizes but not enough to turn a profit unless the
jackpot is won.
The parlay is
0.1(oddsA + 1)(oddsB + 1) . . . (oddsF + 1) = $0.1(57)(5.7)(18.4)(8.6)(11.8)(11.5)= $697,663.23 But
the parlay has six win track takes versus one P6 take but just on the new money bet on
Friday. The carryover is not reduced by any additional track take.
The new money =
$3, 591, 245.44 $3, 240, 259.28
= $438, 732.70
0.8
where we adjust by the 20% win track take on that day’s bets.
So if we adjust by the win track take of 17%, we have for the true parlay value
(57)(5.7)(18.4)(8.6)(11.8)(11.5)
0.1 = $1, 608, 904.69
(1 0.17)6
compared to the actual Rainbow P6 payout of $3,591,245.44 which was the record payout
for a single winner on the Rainbow 6 on February 22, 2013. The record total P6 pool was
on July 2, 2007 at Hollywood Park where the pool reached $10,870,852.60 with 13 winners
of $576,064.40 each.
If the pool is not won, there are periodic mandatory payout days usually at the end of
meets. There was a mandatory payout on April 23, 2011 with a $1.4 million carryover.
The total pool reached $5.1 million. There were 1,311 winning tickets each worth $3,279.26.
There was another mandatory payout on March 31, 2013, the last day of the meet. The
pool had a carryover over $2 million. So for this, it was optimal to go for second prize,
namely, the regular P6 as there was no sense going for the unique P6. The P6 was won
that day and paid $3,932.32 for the $0.10 ticket with win payo↵s of Race 6 $8.20, Race 7
%16.20, Race 8 $13.80, Race 9 $4.20, Race 10 $22.00 and Race 11 $9.80. The true parlay
was below this payo↵, namely 0.1(4.1)(8.2)(6.90)(2.10)(11.00)(14.90) = $7,984.45.
In 2014 the Rainbow Pick 6 tickets were raised to 20 cents. Going into the May 26 manda-
tory payout, the carryover pool was $6,303,426.30. On Sunday the pool was $6,397.293/35
and Monday’s, which was won, was $6,678,939.12.
11Parimutuel betting markets Ziemba
On March 31, 2014, one investor playing the $2,721.60 ticket
1,2,4,5,7,8,9,10,12/1,2,4,5,7,8/1,2,3,6,8,9/1,2,3,4,5,7,8/1,3,4,5,6,7/6 won $301,933.
Other payo↵s were $791,364, $414,166.52 and $327,110.71.
A single bettor, Danny Borislow, won the whole P6 pool on Sunday May 25, 2014, a day
before the mandatory payout. The payo↵s of Races 3-8 with winning numbers 1-8-6-1-6-5
were $35.80, $22.60, $12.80, $10.40, $9.60, and $12.80, respectively. Danny had two tickets
each for $7,603.20 with the winning ticket being all-all-all-1,4-all-all as #1 won the 4th leg.
The second ticket had the same five “alls” plus two other horses in leg 4.
These races have two bombs and four 4-1 or 5-1 horses. Normally two bombs in the $20-30
range and four $10 horses would not yield just one unique P6 winner. The reason this
bettor won was the low volume in the pool on Sunday as most bettors were preparing for
Monday’s mandatory payout. Also the short fields 6-6-6-10-7-13 allowed Danny to bet all
the horses in five of the races and four deep in the fourth leg for his $7,603.20 times 2 or
a $15,206.40 investment.
The net increase in the pool on Sunday was $281,755.77 (total pool of 6,678,939.12 —
carryover of 6,397,283.35), dividing by 0.80 gives the total bet of $352,194.71. This was
more than Saturday’s increase in the carryover of $93,857.05 or the $117,321.31 bet.
The parlay with six win takes of 17% was 0.2(17.9)(11.3)(6.4)(5.2)(4.8)(6.4) = 41,358.62.
Then with no track take, the parlay was 4, 135, 861.62/(1 0.17)6 = 126, 502.02 which
compares to the payo↵ of 6,678,939.12 which had 20% taken o↵ the total bet.
So bravo to Danny Borislow who seized a good opportunity to win the whole pool. Danny
was the owner of the Magic Jack telephone device business. It is extremely unlikely that
someone could win the whole pool on mandatory payout day as most likely there would be
multiple P6 winners all going after a share of $10+ million pool.
A sad postscript: on Monday July 21, 2014, Danny collapsed and died at age 52 after
playing in an indoor soccer game in West Palm Beach, Florida.
The ordinary Pick6
The Rainbow Pick6 is designed to boost sales with large jackpots and cheap tickets. Las
Vegas and Reno casinos also do this in various ways. For example, cheap keno tickets with
the games deep into the casino draw customers into other games where the casinos profit
edge is larger.
The strategy to play the ordinary $2 Pick6 wisely depends on the handicapping of the
horses’ chances of winning. A Pick6 program can use individual probabilities to generate
an overall probability of success in winning the P6 and collecting some 5/6 consolation
12Parimutuel betting markets Ziemba
prizes. In the 2009 Breeders Cup, there were three races with standouts but not certain
winners and three that were wide open.
So you could play the Pick 6 in the following way: I thought about doing this but
did not — it was a $2 million mistake. You have a single ticket with about 10 horses
in the three wide open races and single the three standouts. That would cost about
10*10*10*1*1*1*$2=$2000, not a large Pick 6 ticket. You only win if all three standouts
win and they did.
The payo↵s for $2 win tickets were as follows
Race 4 Dancing in Silks 52.60
Race 5 Value of York 63.20
Race 6 Goldikova 4.80 the first standout
Race 7 Furthest Land 44.60
Race 8 Conduit 3.80 the second standout
Race 9 Zenyatta 7.60 the third standout
The Pick 6 paid $1,838,305.20 for one winning 6/6 ticket and the 3*9=27 Pick 5/6 tickets
(of the 10 losers in the three wide open races) paid 27*$4822.40 for a total of $130,204.80
plus the 6% rebate on the $2000 of $120 for a grand total of $1,968,630.00. It is not quite
$2 million but as Johnnie Hooker played by Robert Redford in the Sting said: “it’s not
enough but it’s close”. Of course, taxes would take 25% at the track and be sorted out
later when filing and my winning would depress the Pick 6 and Pick 5/6 prizes.
Summary: all three of the wide open races had winners that were competitive horses. So
they would be on our ticket. But even if we bet on all horses, these three races, the ticket
only costs 9*13*10*1*1*1=$2340. This ticket made a lot of sense so I should have played
it.3 It would have had 8+11+9=28 Pick 5/6s. Oh well, there is always next year.
Pool guarantee insurance
Another new feature of racetracks is pool guarantee sports insurance companies including
SCA of Dallas, Texas run by bridge champion Robert Hammond. These companies guar-
antee the $1 million and other jackpots for the Pick6 and other exotic wagers. Ziemba
(2019a) discusses such bets he and colleague Cary Fotias made including the Pick6 at the
2001 Breeders Cup at Belmont Racetrack. The insurance was the $2 to $3 million part,
to guarantee a pool of at least $3 million. For example, if only $2.15 million was bet,
3
Another way to play this is to have three sets of tickets in which you assume that at least two of
the three standouts will win. So you have N1i , N2i , N3i , N4i , 1, 1 combinations, i = 1, 2, 3 all at $2 each. So
depending on the Nji you likely have a larger ticket than the three singles approach. You might win more
than one Pick 6 and more Pick 5/6s, but you might miss the Pick 6 as well unless the tickets are well
spread.
13Parimutuel betting markets Ziemba
they would be liable for $850,000. We studied and proposed to bet a random amount if
needed.
The idea is to get to $3 million and return the insurance company’s money by winning
Pick 6s and Pick 5/6s. It was risky as September 11 had just occurred and all the Arab
owners such as Sheikh Mohammed of Dubai were not in attendance. Their horses and
trainers were though. It turned out to be a glorious day so the crowd sent the Pick 6 pool
well over $4 million. Our client said you two can just play about $25-30,000 of the tickets.
So we had a $2000 ticket twice and what we call a gorilla ticket for $28,000. We had some
5/6s and got most of the money back. The Pick 6 paid about $250,000. The race we lost
was the sprint. Squirtle Squirt, which my handicapping colleague did not like at 9-1 beat
the front running filly, Xtra Heat at 14-1, who we had and had led all the way until the
finish. So if she had won we would have had three about $450,000 Pick 6s plus more 5/6s.
Squirtle Squirt had run at Belmont and had the top jockey Jerry Bailey and was trained
by the recently deceased legendary trainer Broadway Bobby Frankel. Too bad. But the
next week we won a similar case at Santa Anita, while guaranteeing a $1 million Pick 6,
collecting $240,000 for the client and a nice bonus for us.
Betting strategies
Kelly and fractional Kelly betting is used extensively in racetrack betting. Full Kelly is the
maximization of the expected logarithm of final wealth subject to constraints. That’s an
expected utility approach with u(w) = logw. Log with very low Arrow-Pratt risk aversion
u00 (w)/u0 (w) = 1/w ⇠
= 0 is very risky short term despite wonderful long term growth
properties. MacLean, Thorp and Ziemba (2010, 2011) provide an extensive treatment of
the key ideas and major papers. Ziemba (2011) has a response to Professor Paul Samuel-
son’s critiques. MacLean, Thorp, Zhao and Ziemba (2010) provide simulations of typical
behavior.
Fractional Kelly is simply the idea to blend cash with the Kelly strategy similar to blends of
cash and the market index in portfolio theory. This under the lognormal asset assumption
amounts to a less risky negative power utility function rather than log which is the most
risky utility function one would ever want to use. Fractional Kelly leads usually to less
growth and more security and a less violent wealth path. Half Kelly is a frequently used
strategy. It has 75% of the full Kelly growth but the security, measured by the probability
of breaking even rising from 87% with full Kelly to 95.4% with half Kelly. For lognormal
assets this is the negative power utility function u(w) = 1/w and this is approximate for
other return distributions. This is shown visually in Figure 2(a) for the Kentucky Derby
from 1934 to 2005 and Figure 2(b) with the dosage filter to eliminate horses that cannot
run 1 14 miles on the first Saturday in May of their three year old career. These use the
place and show system originally devised in Hausch, Ziemba and Rubinstein (1981). A
14Parimutuel betting markets Ziemba
system that only bets on the favorite turns $2500 into $480 so is a loser; while the full and
half Kelly systems have gains.
(a) Kelly, half Kelly and betting on the favorite (b) same as (a) with dosage filter
Figure 2: Wealth history of some Kentucky Derby bets, 1934-2005
In all cases the strategy to win is the same as in the financial markets:
1. get the mean right: thus one must have accurate probabilities of various outcomes.
This is discussed below.
2. use the actual odds and a betting model such as the Kelly criterion to optimize the
bet sizes, that is the allocations.
For situations with not many wagers, the Kelly capital growth maximize expected loga-
rithm or, its safer version, fractional Kelly, is useful as a decision tool especially with many
repeated bets. Then one has a stochastic program to maximize the expected utility using a
logarithmic utility function of final wealth subject to various constraints. The Kelly strat-
egy bets more on the attractive situations. In wagers where one makes hundreds of bets,
it is often better to use a tree approach where many of the bets are of equal value. Besides
being more convenient to make these multiple bets, this gets around integer problems as
the wagers will be integers that can easily be bet. Whereas the Kelly optimization needs
modifications to produce integer wagers. Also this approach can be computerized to print
out the tickets and the higher probability wagers can be bet more to approximate a Kelly
strategy.
The importance of accurate mean estimates
Table 4 and Figure 3 show that getting the mean right is a most important aspect of any
portfolio decision problem. Chopra and Ziemba (1993) discuss that and look at the e↵ect
15Parimutuel betting markets Ziemba
of errors in means, variances and covariances using the cash equivalent of the approximate
The Stochastic Programming Approach to Asset, Liability, and Wealth Management
versus exact optimal solutions. Basically it is in the ratio 20:2:1 for errors in means,
variances and covariances in terms of error impact on certainty equivalent value. We
measure risk aversion by the
Figure 1.7. Arrow-Pratt risk aversion
Mean Percentage index RA (w) = u00 (w)/u0 (w),
Cash-Equivalent
where primes denote di↵erentiation of the
Loss utility of
because of Errors
wealth infunction
Inputsu.
Cash-Equivalent Loss (%)
11
10
9
8
7
6
5
4
3
2
1
0
0 0.05 0.10 0.15 0.20
Magnitude of Error (k)
Means Variances Covariances
Source: Based on data from Chopra and Ziemba (1993).
Figure 3: Typical relative importance of errors in means, variances and covariances in
terms of certainty equivalent. Source: Chopra and Ziemba (1993)
Figure 1.8. Average Turnover for Different Percentage Changes in Means,
Variances, and Covariances
Table 4: Average Ratio of CEL for Errors in Means, Variances and Covariances. Source:
ChopraAverage Turnover(1993)
and Ziemba (% per month)
50 t Errors in Means Errors in Means Errors in Variances
Risk Tolerance vs Covariances vs Variances vs Covariances
25 5.38 3.22 1.67
40 Means
50 22.50 10.98 2.05
75 56.84 21.42 2.68
30 # # #
Error Mean Error Var
Variances
Error Covar
20 2 1
20
Low risk aversion utility functions such as log with RA = 1/w ⇠ = 0, the e↵ect of the errors is
10 100:3:1 so getting the mean right is even more important.Covariances
more like In horse racing, that is
the probabilities for horses coming first, second, third, etc. Sports betting is similar.
10
5 10 15 20 25 30 35 40 45 50
Change (%)
16
Source: Based on data from Chopra (1993).
12 ©2003, The Research Foundation of AIMR™Parimutuel betting markets Ziemba
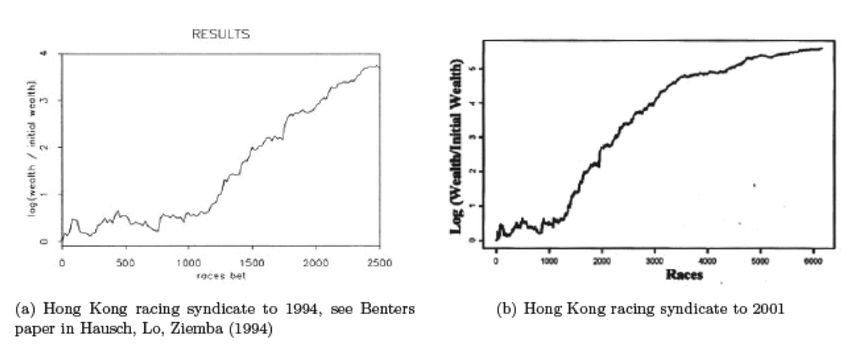
The favorite-longshot bias
The favorite-longshot bias is the tendency in horseracing, sports betting, and financial
options for the most likely outcome to be underbet and the less likely outcomes overbet.
So people on average prefer poor choices and dislike the best possibilities. This bias has
been well known to Irish and other bookmakers who actually create the bias with the bets
they o↵er for the last 100+ years. Griffith (1949), McGlothin (1956) and Fabricant (1965)
are early references.
Figure 4a shows the basic e↵ect over time, the top curve as of 1986 and the more recent
curve on the bottom.
Figure 4a shows the e↵ective track payback less breakage (rounding down) for various odds
levels in California. The curve slightly changes in di↵erent locals with di↵erent track takes.
This data reflects more than 300,000 races over various years and tracks, in 1986 and in
May 19, 2012 recent
9:50 9in x 6indata. Figure
Applications 4b Energy,
in Finance, has an independent
Planning study2ndand
and Logistics b1392-ch09 some earlier studies. Historically in
Reading
the 1986 data, there was a small profit, about 3%, in betting horses to win at US odds of
3-10 (UK odds of 1.30 or less) and that at odds of 100-1, the fair odds were about 700-1
12
so that Applications
such bets were worth only about 13.7 cents per dollar bet.
in Finance, Energy, Planning and Logistics
120
Various favorite-longshot bias studies.
100 Source: Snowberg and Wolfers (2008)
Effective Track Payback Percent
80 0.8467
60
40
20
9/2
0
1/5
2/5
3/5
4/5
1/1
2/1
3/1
4/1
5/1
1/10
0
1
1
1
1
/1
1/2
10/
20/
30/
50/
100
Track Odds (Lo g Scale)
Figure 8 E↵ective Track Payback Less Breakage for Various Odds Levels in California.
Source: Ziemba(a) Source:
and Hausch Ziemba
[1986] and
and Hausch and Hausch (1986)
Ziemba (2008). (b) Source: Snowberg and Wolfers (2008, 2010)
WTZ 32
underpriced wagers. The idea of the system is simple: use the data from
a simple market, in this case the Figure 4: E↵ective
win probabilities track
to fairly price betspayback
in less breakage
the more complex markets, such as place and show. For example, with
ten horses, there are 720 possible finishes for show. Then one searches for
The bias curve is often di↵erent for di↵erent types of races. Higher quality races like the
mispriced place and show opportunities. This is a weak form violation of the
Kentucky
efficient Derbybased
market hypothesis have flatter
solely on prices.biases.
How much toSee Ziemba and Hausch (1987) for the 1903-1986
bet depends
on graph.
how much the wager is out of whack and it
See also Tompkins, Ziemba and Hodgesis a good application of the (2004, 2008) who demonstrate similar
Kelly betting system. The formulation below shows such an optimization.
biases
There is a lotin the here
of data S&P500
on all theand
horsesFTSE100
and not much index futures
time at the track. options which is consistent with option
So a simplified approach is suggested. Don and I solved thousands of such
models with real data and estimated approximation regression equations
that only involve four numbers, namely, the amounts bet to win in the
total pool and the horse under consideration for a bet. Plus the total place
17
or show pool and the place or show bet on the horse under consideration.
These equations appear below. In our books Ziemba and Hausch (1984,
1986, 1987) and papers Hausch, Ziemba and Rubinstein (1981) and Hausch
and Ziemba (1985), we study this in various ways, including di↵erent track
takes, multiple bets for place and show on the same horse and how manyParimutuel betting markets Ziemba
pricing theory with positive risk premiums.
In the more recent data in Figure 4ab, the favorites are no longer underbet enough to turn
a profit betting them. Also the curve is flat across longer odds horses. However, investors
can still short longshots on betting exchanges like Betfair and make a profit.
What are the reasons for the favorite-longshot bias?
Thaler and Ziemba (1988) included the idea that there are more bragging rights from
picking longshots than from favorites: 50-1 Wow, was I smart, while 2-5 is an easy pick.
Transaction costs are another factor: betting $50 to win $10 is hardly worth the e↵ort.
The bias is consistent with the Kahneman-Tversky (1979) prospect theory of actual human
behavior and behavioral finance, see Barberis and Thaler (2003). There low probability
gains are risk seeking and are overestimated and high probability gains are viewed as risk
averse, so are underestimated. Mental accounting (Kahneman and Tversky, 1984) may be
involved where the bettor is risk seeking in one area and risk averse in another.
Many studies, data, theories and references regarding the favorite-longshot bias are in
Hausch, Lo and Ziemba (1994, 2008) and Vaughan Williams (2003). Historical graphs
are in Ziemba (2019a). Additional literature on this bias was provided by Snyder (1978),
Quandt (1986), Benter (1994, 2008), Hurley and McDonough (1995), Jullien and Salanie
(2000), Shin (1992), Ottaviani (2008), Golec and Tamarkin (1998), Vaughan Williams and
Paton (1997), Green, Lee and Rothschild (2019) and others. Snowberg and Wolfers (2008,
2010) discuss risk love versus misperceptions as explanations. Woodland and Woodland
(1994) discuss baseball biases. Ziemba (1989) discusses hockey biases. Vaughan Williams
et al (2016) discusses poker where misperception rather than risk-love better explains the
bias. Forrest and McHale (2005) show the bias in tennis betting and Forrest and Simmons
)(2005) discuss soccer. The bias is stronger late in race days when losing bettors try to
catch up by betting more on long odds horses, see Metzger (1985), Gramm and McKinney
(2009) and Ziemba (2019a). Asch and Quandt (1986) devise a place and show betting
system based on late money.
Ziemba and Hausch (1987) show that UK and Irish bookies create the bias to balance their
betting books. Busche and Hall (1986) and Busche (1994, 2008) and Benter (1994, 2008)
show the bias is not in the Hong Kong and Japan data.
The bias is part of much human behavior. In the lottery context, management wants games
that sell well that exploit the risk seeking low probability high payo↵ bias. With the help
of UBC colleague Shelby Brumelle and Sandra Schwartz, I designed a bingo game with a
$100 million first prize, a $10 million second prize, down to a $10 lowest prize. The edge
for the house was over 50% after selling the risk to insurance providers for the two top
prizes. The game is based on patterns of chosen and not chosen bingo numbers.
18Parimutuel betting markets Ziemba
Place and show and exotic optimization with transactions
costs
The Dr Z system, co-developed with Donald Hausch with some early help from Mark
Rubinstein, presents a winning method for betting on underpriced wagers by pricing the
bets. The idea of the system is simple: use the data from a simple market, in this case
the win probabilities to fairly price bets in the more complex markets, such as place and
show. For example, with ten horses, there are 720 possible finishes for show. Then one
searches for mispriced place and show opportunities. This is a weak form violation of the
efficient market hypothesis based solely on prices. How much to bet depends on how much
the wager is out of whack and it is a good application of the Kelly betting system. The
formulation below shows such an optimization. There is a lot of data here on all the horses
and not much time at the track. So a simplified approach is suggested. Don and I solved
thousands of such models with real data and estimated approximation regression equations
that only involve four numbers, namely, the amounts bet to win in the total pool and the
horse under consideration for a bet. Plus the total place or show pool and the place or
show bet on the horse under consideration.
These equations appear below. In the books Ziemba and Hausch (1984, 1986, 1987) and
papers Hausch, Ziemba and Rubinstein (1981) and Hausch and Ziemba (1985), we study
this in various ways, including di↵erent track takes, multiple bets for place and show on
the same horse and how many can play the system before the edge is gone. This system
revolutionized the way racetrack betting was perceived viewing it as a financial market
not just a race to handicap. This led to pricing of wagers and the explosion of successful
betting by syndicates in the US,Hong Kong and elsewhere using some of these ideas as
discussed in Hausch, Lo, Ziemba (1994, 2008), Hausch and Ziemba (2008) and Ziemba
(2017, 2019).
The e↵ect of transactions costs which is called slippage in commodity trading is illustrated
with the following place/show horseracing optimization formulation; see Hausch, Ziemba
and Rubinstein (1981). Here qi is the probability that i wins, and the Harville probability
qq
of an ij finish is 1 i qji , etc. That is qj /1 qj is the probability that j wins a race that
does not contain i, that is, comes second to i. Q, the track payback, is about 0.82 (but is
about 0.88 with professional rebates). The players’ bets are to place pj and show sk for
each of the about ten
Pn horses in the race out P of the players’ wealth w0 . The bets by the
crowd are Pi with i=1 Pi = P and Sk with nk=1 Sk = S. The payo↵s are computed so
that for place, the first two finishers, say i and j, in either order share the net pool profits
once each Pi and pi bets cost is returned. The show payo↵s are computed similarly. The
maximum expected utility model is
19Parimutuel betting markets Ziemba
2 Pn 3
Q( P + pl ) (pi +pj +Pij )
l=1
6 h 2 i 7
6 ⇥ pi +Ppi
+
pj 7
n X
n X
n 6 pj +Pj 7
X qi qj qk 6 P i
7
Q(S+ n )
max log 6
6 + h l=1 s l (s i +sj +sk +Sijk ) 7
7
pi ,si (1 qi )(1 qi qj ) 6 3 i 7
i=1 j=i k=i
6 si sj sk 7
j6=i k6=i,j
4 ⇥ si +S + + 5
Pi n sj +Sj P sk +Sk
n
+w0 l=i sl l=i pl
l6=i,j,k l6=i,j
n
X
s.t. (pl + sl ) 6 w0 , pl > 0, sl > 0, l = 1, . . . , n,
l=1
While the Harville (1973) formulas make sense, the data indicate that they are biased.
Savage (1957), Henery (1981), and Dansie (1983) discuss this Bayesian type formula
more.
For place and show, the win favorite-longshot bias and the second and third finish bias tend
to cancel so the corrected Harville formulas are not needed here. For other bets to correct
for this, professional bettors adjust the Harville formulas, using, for example, discounted
Harville formulas,4 to lower the place and show probabilities for favorites and raise them
for the longshots; see papers such as Benter (1994, 2008) in Hausch, Lo and Ziemba (1994,
2008) and papers by Henery, Stern, Lo, and Lo and Bacon-Shone and others in Hausch
and Ziemba (2008).
Rebate is added to final wealth inside the large brackets by adding the rebate rate times
all the bets,winners and losers.
This is a non-concave program but it seems to converge when nonlinear programming
algorithms are used to solve such problems. But a simpler way is via expected value
regression approximation equations using 1000s of sample calculations of the NLP model.
These are
✓ ◆
wi /w
Ex Placei = 0.319 + 0.559
pi /p
4
The discounted probabilities come from
q↵
qi⇤ = Pni ↵
i qi
for ↵ about 0.81 then one uses the qi⇤ in the second place position. For third one uses ↵2 about 0.64 and
for fourth place ↵3 . These empirical numbers vary over time and by track. This is more important for
exacta, trifecta and superfecta pricing than place and show because for the latter the win bias from the
favorite-longshot and the second and third biases tends to cancel.
20You can also read