Perceived and mentally rotated contents are differentially represented in cortical depth of V1 - Nature
←
→
Page content transcription
If your browser does not render page correctly, please read the page content below
ARTICLE
                  https://doi.org/10.1038/s42003-021-02582-4                 OPEN

                  Perceived and mentally rotated contents are
                  differentially represented in cortical depth of V1
                  Polina Iamshchinina 1,2 ✉, Daniel Kaiser 3, Renat Yakupov 4, Daniel Haenelt 5, Alessandro Sciarra6,7,
                  Hendrik Mattern6, Falk Luesebrink6,7, Emrah Duezel4,8, Oliver Speck4,6,8,9, Nikolaus Weiskopf 5,10 &
                  Radoslaw Martin Cichy1,2

                  Primary visual cortex (V1) in humans is known to represent both veridically perceived
                  external input and internally-generated contents underlying imagery and mental rotation.
1234567890():,;

                  However, it is unknown how the brain keeps these contents separate thus avoiding a mixture
                  of the perceived and the imagined which could lead to potentially detrimental consequences.
                  Inspired by neuroanatomical studies showing that feedforward and feedback connections in
                  V1 terminate in different cortical layers, we hypothesized that this anatomical compart-
                  mentalization underlies functional segregation of external and internally-generated visual
                  contents, respectively. We used high-resolution layer-specific fMRI to test this hypothesis in
                  a mental rotation task. We found that rotated contents were predominant at outer cortical
                  depth bins (i.e. superficial and deep). At the same time perceived contents were represented
                  stronger at the middle cortical bin. These results identify how through cortical depth com-
                  partmentalization V1 functionally segregates rather than confuses external from internally-
                  generated visual contents. These results indicate that feedforward and feedback manifest in
                  distinct subdivisions of the early visual cortex, thereby reflecting a general strategy for
                  implementing multiple cognitive functions within a single brain region.

                  1 Department of Education and Psychology, Freie Universität Berlin, Berlin, Germany. 2 Berlin School of Mind and Brain, Humboldt-Universität zu Berlin,

                  Berlin, Germany. 3 Department of Psychology, University of York, Heslington, York, UK. 4 German Center for Neurodegenerative Diseases (DZNE),
                  Magdeburg, Germany. 5 Department of Neurophysics, Max Planck Institute for Human Cognitive and Brain Sciences, Leipzig, Germany. 6 Department of
                  Biomedical Magnetic Resonance, Institute for Physics, Otto-von-Guericke-University, Magdeburg, Germany. 7 Department of Neurology, Otto-von-Guericke
                  University, Magdeburg, Germany. 8 Center for Behavioral Brain Sciences, Magdeburg, Germany. 9 Leibniz Institute for Neurobiology, Magdeburg, Germany.
                  10 Felix Bloch Institute for Solid State Physics, Faculty of Physics and Earth Sciences, Leipzig University, Leipzig, Germany. ✉email: iamshchinina@gmail.com

                  COMMUNICATIONS BIOLOGY | (2021)4:1069 | https://doi.org/10.1038/s42003-021-02582-4 | www.nature.com/commsbio                                               1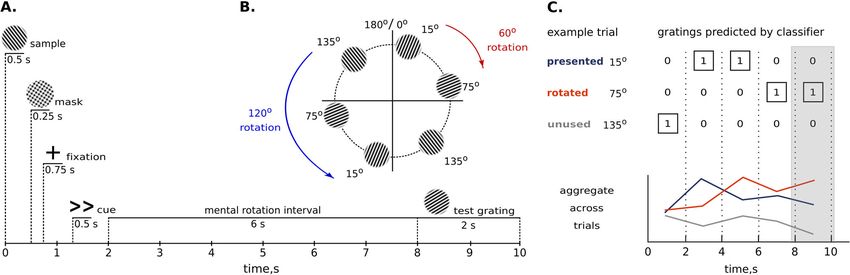
ARTICLE COMMUNICATIONS BIOLOGY | https://doi.org/10.1038/s42003-021-02582-4
M
ental rotation is at the core of efficiently acting upon or 120° (Fig. 1A). Thus, each of the orientations presented in the
objects regardless of their orientation, such as when trial could be turned into one of the two other orientations
searching for a nail in a toolbox or solving a Rubik’s (Fig. 1B). The presented and rotated gratings were different from
cube. It comprises the perception of an external input and the each other on every trial, allowing us to independently assess
internal generation of a transformed representation1–3. Recent encoding of perceived and mentally rotated contents. At the end
studies demonstrated that both operations are concurrently of each trial, participants compared their mental rotation result to
mediated by primary visual cortex4,5 (V1). Given this spatial probe grating with similar orientation. Behavioural data con-
overlap, how does the brain separate perception and mental firmed that the participants could successfully perform this task,
rotation? Why do we not confuse perceived and mentally trans- with greater reaction times (t23 = 3.4, p = 0.0012) and error rates
formed contents? (z = −1.64, p = 0.06) for the larger rotation angle1. (Supple-
Recent neuroanatomical studies suggest that projections car- mentary Fig. 1A).
rying external and internally generated signals in V1 are segre- To examine depth-specific responses during mental rotation
gated across cortical layers. Feedforward projections terminate in and perception, we extracted three gray matter depth bins
the middle layer, while feedback connections terminate in approximating deep, middle, and superficial cortical layers in V1
superficial and deep layers6–11. Studies of working memory and in every participant (Fig. 2A, see Methods for further clarifica-
attention demonstrated the functional relevance of this layer- tion). For each depth bin, we trained support vector machine
specific separation12–19. However, these studies measured the classifiers to differentiate multi-voxel response patterns evoked by
retention or amplification of the very stimuli previously repre- the three grating orientations. Classifiers were always trained on
sented in V1 or estimated perception signal not concurrently but response patterns in a separate block-design localizer, during
in a separate task. It is thus unclear how V1 separates presented which participants saw the three orientations while performing an
from internally modified contents, such as during mental orthogonal task (see Methods). These response patterns served as
rotation. a benchmark for a strong orientation-selective response in V1.
Here, using high-resolution fMRI at 7 T we show that the Classifiers were then tested on response patterns in the mental
concurrent representation of perceived and mentally transformed rotation experiment. To investigate representations of perceived
contents during mental rotation is enabled by cortical depth and rotated contents across time, we performed separate classi-
separation of information in V1. The perceived contents were fication analyses for every timepoint from stimulus onset to the
strongest at the middle cortical depth bins, while mentally rotated end of the trial (5 TRs in total). We then analysed the predicted
contents dominated in the superficial and deep cortical bins. These orientation (15°, 75°, or 135°) at each timepoint (Fig. 1C). To
results show how the perceived and mentally rotated contents are estimate the representational strength of the presented and
mediated by functionally distinct neural representations, explain rotated grating orientations, we counted how often classifiers
why externally induced and internally generated contents are not predicted (1) the presented orientation (e.g. predicting 15° on a
confused, and supports the view of V1 as a dynamic ‘blackboard’ trial where a 15° grating was rotated into a 75° grating), (2) the
updated through connections from higher-order areas rather than rotated orientation (e.g. predicting 75° on a trial where a 15°
a low-level stage of hierarchical processing. grating was rotated into a 75° grating), and (3) the third, unused
orientation (e.g. predicting 135° on a trial where a 15° grating was
Results rotated into a 75° grating). Accumulating the classifier predictions
We recorded 7 T fMRI with 0.8 mm iso voxel resolution while across trials, we were able to track representations of perceived
participants (N = 23) viewed and mentally rotated oriented and mentally rotated contents across cortical depths (see
gratings4. On each trial, we presented a single grating (15°, 75°, or Methods).
135°), followed by a cue that instructed participants to mentally We performed in-depth analyses in the time interval from 8 to
rotate the presented grating to the left or to the right for either 60° 10 seconds (i.e. 2 TRs) after the rotation cue. This time interval
Fig. 1 Experimental methods. A On each trial, participants viewed a sample grating and then had 6 seconds to rotate it 60° () or 120° (≪, ≫) to the
left or to the right. After the mental rotation interval, participants had 2 seconds to report whether a probe grating was tilted clockwise or counterclockwise
compared to the mentally rotated grating. B We used a set of three stimuli, 15°, 75°, and 135° oriented gratings. As a result of the mental rotation, each
stimulus could be turned into one of the other two stimuli. For example, rotation of a 15° grating (red arrow) for 60° clockwise results in a 75° grating or
rotation of a 135° grating (blue arrow) 120° counterclockwise results in a 15° grating. C This panel shows classifiers’ decisions in an example trial, in which
a 15° grating was rotated into a 75° grating. We aggregated results across trials by counting how often classifiers predicted the presented orientation, the
rotated orientation, and the unused orientation. The shaded area denotes the time interval chosen for the in-depth analysis (measurements at 8 and
10 seconds).
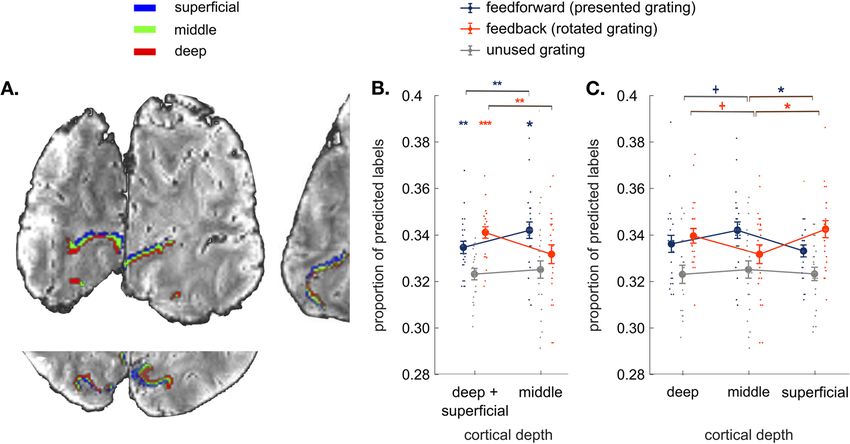
2 COMMUNICATIONS BIOLOGY | (2021)4:1069 | https://doi.org/10.1038/s42003-021-02582-4 | www.nature.com/commsbioCOMMUNICATIONS BIOLOGY | https://doi.org/10.1038/s42003-021-02582-4 ARTICLE Fig. 2 Results. A Coronal, axial, and sagittal slices of the average EPI image of a representative participant, overlaid with cortical depth bins approximating cortical layers (superficial, middle, and deep) from an equi-volume model (see Methods). The cortex is mapped within the region of V1 with voxel eccentricity values 0–3°. B Classifier decisions in V1 over the time interval measured at 8 and 10 seconds after the rotation onset for the presented, mentally rotated and unused gratings in the outer cortical bins (average of the superficial and deep bin) and the middle cortical bin (N = 23 participants; see Supplementary Fig. 3 for detailed analysis within an extended time interval and Supplementary Fig. 4 for analyses across all time points). Perceptual contents were more strongly represented at the middle cortical depth, whereas mentally rotated contents were dominant at the outer cortical bin. C Comparing classifier decisions between all three cortical bins (superficial vs. middle vs. deep) reveals that the difference between perceived and rotated contents is most pronounced between the middle and superficial depths. All error bars denote standard error of mean over subjects. +p < 0.09, *p < 0.05, **p < 0.01, ***p < 0.001. was pre-selected based on previous studies4,5 where the mentally bins (t22 = 2.8, p = 0.0052, Cohen’s d = 0.58). Similar distribution rotated gratings could be decoded starting from 8 seconds fol- of feedforward signal was observed in V2 (Supplementary Fig. 5). lowing the rotation instruction (also see Methods for further We conclude that information about perceived and mentally clarification). Previous fMRI studies14,20, however, utilized dif- rotated contents in V1 is spatially separated across cortical depth ferent time intervals and experimental tasks to show the dis- bins and functionally corresponds to cortical layers: the outer bins tribution of feedforward and feedback signals in cortical depth in our study mainly represented mentally generated contents and (for the perception signal decoding based on orientation localizer the middle bin selectively encoded sensory information. task in our study see Supplementary Fig. 2). Building on this As superficial and deep cortical depth bins were aggregated in previous work, our main goal here was to disentangle concurrent the aforementioned analyses, we performed an additional analysis representations of perceived and mentally rotated contents across comparing all three depth compartments (deep vs. middle vs. cortical depth, even when they are represented in a spatially and superficial). A repeated-measures ANOVA again revealed a sig- temporally overlapping way. nificant interaction between Signal Type and Cortical Depth First, we hypothesized that representations of mentally rotated (F2,44 = 5.3, p = 0.0085) (Fig. 2C; for the univariate analysis and perceived contents should emerge at the outer and middle results see Supplementary Fig. 6). Unpacking this, mentally cortical depth bins, respectively. To test this hypothesis, we rotated orientation was more strongly represented in the super- compared the mental rotation and perception signals to the ficial cortical bin than in the middle one (t22 = 2.7, p = 0.02, unused grating in the average of the outer bins and in the middle Cohen’s d = 0.56) and more strongly in the deep bin than at the bin (Fig. 2B, see Methods for the clarification for the choice of the middle cortical depth (again at the trend level; t22 = 2.7, p = 0.08, baseline). We found significantly more classifier choices for the Cohen’s d = 0.35). In contrast, the perceived orientation was rotated grating in the outer cortical bins (t22 = 4.6, p = 0.0001, more strongly represented in the middle bin than at the super- Cohen’s d = 0.97, FDR-corrected for the number of cortical bins), ficial (t22 = 2.9, p = 0.014, Cohen’s d = 0.6) and deep ones (at the but not at the middle depth (t22 = 0.2, p = 0.9). Classifier choices trend level; t22 = 1.8, p = 0.06, Cohen’s d = 0.38). No statistically for the presented grating were significantly more frequent than significant difference between the deep and superficial layers was for the unsused grating at the middle depth (t22 = 2.8, p = 0.014, found when analyzing perception (t22 = 0.86, p = 0.19) or mental Cohen’s d = 0.59) as well as in the outer depth bins (t22 = 2.7, rotation signals (t22 = 0.6, p = 0.27); however, we acknowledge p = 0.006, Cohen’s d = 0.56). In sum, mentally rotated contents that these and other non-significant differences in our study reached significance only in the outer cortical bins, whereas might have reached significance with larger samples. Mentally perception signal was present at all the cortical bins. rotated contents were thus represented in both outer depth bins, To compare mental rotation and perception signals across albeit weaker dissociations emerged between the middle and the cortical depth bins, we ran a repeated-measures ANOVA with deep cortical bins. factors Signal Type (perception vs. mental rotation) and Cortical Depth (middle vs. outer cortical bins) (Fig. 2B). The analysis Discussion revealed a significant interaction (F1,22 = 10.95, p = 0.0045). More Harnessing the fine-grained resolution of 7 T fMRI, we were able information about the rotated orientation was found in the outer to resolve the functional segregation of signals underlying men- cortical bins than at the middle depth (t22 = 2.52, p = 0.0096, tally rotated and perceived contents in V1: perceptual signals Cohen’s d = 0.53). In contrast, more information about the per- were dominant at the middle depth of V1, whereas mentally ceived orientation was present at the middle bin than in the outer rotated contents were found in the superficial and deep bins. COMMUNICATIONS BIOLOGY | (2021)4:1069 | https://doi.org/10.1038/s42003-021-02582-4 | www.nature.com/commsbio 3
ARTICLE                                                              COMMUNICATIONS BIOLOGY | https://doi.org/10.1038/s42003-021-02582-4

While our results are consistent with the previous fMRI studies at          process. For this, future studies are needed to systematically
the standard resolution showing that V1 houses representations              compare perceived and mentally rotated representations in the
of both perceived and mentally rotated contents4,5 (Supplemen-              middle36 and outer cortical layers, for example, through con-
tary Fig. 1B), our findings provide the first functional explanation          trasting perception- and imagery-induced retinotopic maps of
for externally induced and internally generated representations             low-level features such as horizontal/vertical meridian, foveal/
during mental rotation overlapping on a 2D map of cortex, yet               parafoveal cortical divisions, or orientation discrimination biases.
functionally distinct in a 3D cortical model.                                  Beyond the spatial separation of representations of perceived
   The functional separation of the contents of perception and              and mentally rotated contents, the laminar organization of
mental rotation into cortical depth bins follows the neuroa-                feedforward and feedback information may also facilitate inter-
natomy of V1, which is characterized by bottom-up connections               actions between these signals. Processing bottom-up and top-
terminating in the middle cortical layer and top-down connec-               down signals in close physical proximity on the cortical surface
tions terminating in the outer layers6–11. Our results demonstrate          optimizes crosstalk that is essential for a large set of cognitive
that this anatomical differentiation between feedforward and                functions such as figure-ground segregation16,37, surround
feedback connections directly maps onto activity time courses               suppression38, visual attention17–19, and visual short-term
during a cognitive task. A similar mapping between fine-scale                memory12,14,39. In fact, predictive coding accounts suggest that
cortical architecture and bottom-up and top-down information                a multitude of brain processes depend on such interactions40–42,
flow underpins basic visual functions such as illusory                       rendering the laminar separation of feedforward and feedback
perception20,21 and visual expectations22. Although different               information a candidate for an implementation strategy for var-
involvements of superficial and deep cortical depths were                    ious other brain functions.
reported in these studies, they consistently highlight a laminar               Layer-specific fMRI is an emerging technique requiring further
separation between the middle and the outer cortical subdivisions           procedure stabilization and refinement of analysis to ensure that
in V1. Specifically, a more pronounced representation of the                 obtained results are not impacted by motion artifacts (see
feedback signal at the superficial cortical depth in our study could         Methods), draining veins effect or data acquisition methods
potentially result from different underlying processes. First of all,       potentially introducing resolution losses43. We acknowledge a
this finding is consistent with the previous studies15,20 where              potential influence of these factors on our results, and future
feedback signal was measured in the presence of physical stimuli.           studies using alternative protocols44 to alleviate potential con-
In our experiment, perceptual stimuli were only briefly shown at             founds are required to accrue additional evidence.
the trial onset, but perception contents were reliably represented             Although our study highlights that V1 represents internally
in the brain activity patterns throughout the trial duration and            generated contents, a firm link between such V1 representations
thereby could impact the depth distribution of the feedback sig-            and the subjective quality of mental images is yet to be estab-
nal. Another possibility is that fMRI measurements obtained with            lished. Future studies could directly link fine-grained cortical
gradient-echo sequence in our study could be biased towards                 feedback patterns to an individual’s ability to successfully conjure
superficial cortical depth due to close proximity to pial veins              up mental representations during mental rotation45–47 and
(effect of draining veins)23–25 resulting in comparatively stronger         mental imagery48,49. Such studies may also help to reveal
dissociations between the middle and superficial cortical bins.              imbalances between feedforward and feedback signals that lead to
   We demonstrated that perception contents are more strongly               aphantasia50–52,      hallucinations     or     other    perceptual
represented at the middle depth when estimated concurrently                 disturbances53,54—and eventually treat these symptoms in the
with mentally rotated contents, while no such difference was                future.
observed in the absence of feedback manipulation (Supplemen-                   Together, our results elucidate how the contents of perception
tary Fig. 2). This result points to a separation of feedforward and         and mental rotation are simultaneously represented in different
feedback signals by cortical depth in V1 possibly in order to avoid         cortical compartments of V1. Our findings thereby highlight that
confusion between the two information streams. A similar result             early visual cortex is not only involved in the analysis of sensory
was obtained in a recent study, which concurrently manipulated              inputs but is also recruited during dynamic visual cognition.
feature-based attention (top-down) and stimulus contrast (bot-              Separating these different functions across cortical depth may
tom-up)15, suggesting that the observed functional signal-by-layer          reflect a general strategy for implementing multiple cognitive
separation may be a general cortical mechanism.                             functions within a single brain region.
   The involvement of V1 in dynamically representing internally
generated contents invites a redefinition of the region’s role for           Methods
visual cognition. Our results support the view that V1 is not only          Participants. Twenty-five healthy adults (age Mean ± SD: 29 ± 5.7; 9 female)
a sophisticated feature processor for sensory input passing                 participated in the study. All participants had normal or corrected-to-normal
through, but rather a high-resolution buffer that can be dyna-              vision. Participants gave their written informed consent for participation in the
mically updated through connections from higher-order areas.                study as well as for publicly sharing all obtained data in pseudonymized form. They
                                                                            received monetary reimbursement for their participation. The study was approved
The view of V1 as a dynamic “blackboard”26,27 is consistent with            by the ethics committee of the Otto-von-Guericke-University Magdeburg, Ger-
studies reporting V1 activations when stimulation is absent28–30,           many. Two participants had to be excluded due to aborted data collection and
when participants direct attention without visual inputs31, and             artifacts in the anatomical T1-weighted image, respectively. All analyses were
after stimulating other modalities32, even in the blind33,34.               conducted on the remaining 23 participants.
                                                                                We chose the number of subjects that was similar or exceeded the sample sizes
   Although supporting the dynamic “blackboard” view, our                   of previous 7 T studies investigating feedback signals with laminar
results confront the idea of a ‘perception-like’ nature of mental           separation14,15,18,20,38. With our sample size (N = 23) and at statistical power 80%,
images27,35, indicating that feedforward and feedback mechan-               a medium size effect is detectable in our study (d = 0.62, paired-samples two-sided
isms manifest in distinct neural populations of V1. This dis-               t-test).
sociation of information flow by cortical depth questions the idea
of ‘shared representation’ for mental rotation and perception               Stimuli. Stimuli were grayscale luminance-defined sinusoidal gratings generated
pointing towards a necessity for further clarification of the                using MATLAB (MathWorks, Natick, MA) in conjunction with the Psychophysics
properties that are common or instead uniquely owned by each                Toolbox55. The gratings were presented in an annulus (outer diameter: 6.7° of
                                                                            visual angle, inner diameter: 1.3° of visual angle) surrounding a central fixation

4                         COMMUNICATIONS BIOLOGY | (2021)4:1069 | https://doi.org/10.1038/s42003-021-02582-4 | www.nature.com/commsbio
COMMUNICATIONS BIOLOGY | https://doi.org/10.1038/s42003-021-02582-4 ARTICLE
point. The gratings had a spatial frequency of 2 cpd (12.34 Hz) and a Michelson 75°, and 135°) were shown in a block design in a pseudo-randomized order. In each
contrast of 100%. Stimuli were displayed on an LCD projector (DLR-RS49E, JVC block, one of the grating orientations was shown for 12 seconds, flickering at 4 Hz.
Ltd.) on a rear-projection screen positioned behind the head coil within the magnet Every three blocks (i.e. one repeat of the three orientations) were followed by a
bore. Participants viewed the screen through a mirror attached to the head coil. fixation block, which lasted 15 seconds. Participants had to monitor the fixation
cross for occasional brief changes in color, to which they had to respond with a
button press. Overall, we recorded data for 60 blocks (45 orientation blocks and 15
Experimental procedure fixation blocks). The fixation dot changed 9–10 times per block at random time
Training procedure. Before entering the MRI scanner, participants underwent a points, leading to ~144 changes, to which participants responded on average
training procedure, which comprised minimum 4 runs for all the participants, with 94 ± 4% (Mean ± SD) of the time. The orientation localizer task was performed last
6 being the maximum number in case participants needed more time to learn how in the experiment to ensure that participants did not notice that the orientations
to perform the task. At the start of each trial, participants briefly saw a randomly shown to them during prolonged periods in the localizer task (12 s) are the same
oriented grating (Fig. 1A). The stimulus presentation was followed by a mask three orientations as the ones briefly presented in the beginning of each trial of the
comprising the intersection of three gratings (15°, 75°, and 135°) at random phase. main experiment. The localizer task took 12 min 49 seconds. The average time for
A subsequently presented task cue indicated which direction participants had to completing the whole experiment was 115 min including anatomical scans.
rotate the presented stimulus grating in their mind’s eye. Mental rotation could go
either clockwise or counterclockwise (as indicated by arrow direction), and for 60°
or 120° (as indicated by the number of arrows). After a 6 second rotation period a
Parameters of data acquisition. MRI data were acquired using a 7 T Siemens
probe grating was shown. The probe comprised the grating shown in the beginning
whole-body MR scanner (7 T Classic, Siemens Healthineers, Erlangen, Germany)
of the trial, rotated in accordance with the cue instruction. Additionally, the grating
using a 32-channel receive head coil (Nova Medical Head Coil, Wilmington, MA,
was slightly tilted clockwise or counterclockwise; the amount of additional tilt was
USA). Functional data were acquired with a T2*-weighted 2D gradient-echo EPI
regulated using staircase procedure (described below). The participants’ task was to
sequence (TR 2000 ms, TE 22 ms, 0.8 mm isotropic voxels, number of slices 30, 90°
indicate the direction of difference between the probe grating and the mentally
flip angle, 128 × 128 mm2 FOV, GRAPPA acceleration factor 4, slice partial Fourier
rotated grating. After each trial, participants received a 1 second feedback about
5/8, coronal orientation, R » L phase encoding direction). Shimming was performed
their performance. The inter-trial interval was 2 seconds. Each training run con-
using the standard Siemens procedure. For the first half of the sample, anatomical
sisted of 36 trials and took 7 min 52 seconds. At the end of each run, participants
data were acquired using a MPRAGE sequence with 0.8 mm isotropic resolution
received feedback about their average accuracy.
(TR 2500 ms, TE 3.05 ms, TI 1050 ms, flip angle 5, bandwidth 130 Hz/Px,
205 × 205 mm FOV, no GRAPPA applied, slice partial Fourier 6/8, base resolution
Staircase procedure. To maintain a sensitive accuracy range, the extent of additional 256, sagittal orientation, A » P phase encoding direction, scan time 9 min 20 sec).
tilt in the test stimulus, (compared to the orientation resulting from the mental For the second half of the sample, an additional T1-weighted image56 was acquired
rotation) was adjusted using a staircase procedure. The initial difference between with the resolution of 0.7 mm isotropic voxels to provide a more precise delineation
the orientation resulting from mental rotation and probe grating was set at 20°. For of cerebro-spinal fluid and grey matter at the segmentation stage (TR 2500 ms, TE
each correct response in a given trial, the difference between the probe and rotated 2.55 ms, TI 1050 ms, flip angle 5, bandwidth 320 Hz/Px, 224 × 224 mm FOV,
grating was reduced by 0.5°, making orientation discrimination harder. Conversely, GRAPPA factor 2, no partial Fourier, sagittal orientation, A » P phase encoding
the difference was increased by 2° for each incorrect response, making dis- direction, time of acquisition 7 min 18 sec). Additional anatomical scans of
crimination easier. We imposed an upper limit of 40° on the orientation difference. ~18 min duration were acquired but not used here. During the functional data
The staircase procedure continued across the whole experiment, including the acquisition, geometric distortions were corrected using EPI-PSF-based distortion
training runs and the fMRI experiment. correction57. To correct for rigid-body motion, we applied prospective motion
correction during the acquisition of both structural and functional scans58. It is an
Experimental task. In the scanner, participants first underwent an anatomical optical in-bore tracking system consisting of a single camera and a marker. In order
scanning procedure, during which we acquired two T1-weighted anatomical scans, to establish a rigid connection between the marker and the head, a custom-made
two PD-weighted contrasts and a T2-weighted contrast (described in more detail in dental mouthpiece of the six central teeth of the upper jaw has been crafted by the
‘Parameters of Data Acquisition’). The anatomical scanning procedure took department of oral and maxillofacial surgery of the university hospital of the Otto-
~40 min. During anatomical scan procedure participants were encouraged to rest von-Guericke university, Magdeburg, Germany. The mouthpiece is equipped with
and move as least as possible to reduce motion artefacts. an extension at which the marker is attached. Therefore, line of sight between the
After that, participants continued to perform the task, which they were trained marker and the camera is never lost.
in beforehand (Fig. 1A), but with two major changes. First, participants did not
receive feedback on their performance to increase the number of trials during
scanning time. Second, the sample gratings shown at the beginning of each trial Functional and anatomical data preprocessing
were no longer randomly oriented, but limited to 15°, 75°, or 135° orientation from Bias field correction and segmentation of the anatomical image. The DICOM data
the vertical axis. We limited the number of possible stimuli compared to the were converted to NIfTI format using SPM 12 (Wellcome Trust Center for Neu-
training session to increase signal-to-noise ratio per each sample grating and to roimaging, University College London). The volumes were bias field-corrected
enable signal differentiation at the level of cortical depth bins. In future studies, the using an SPM-based customized script56. To implement cortical depth-specific
use of richer stimulus sets may provide insight to whether the same neural analysis, we extracted grey matter segmentation for each subject. To do this, first
processes, which govern the mental rotation tasks, are also performed on everyday we used the SPM 12 segmentation algorithm and then the brainmask was gener-
objects during our daily lives. ated by adding up the white matter, grey matter and cerebro-spinal fluid masks.
We generated a cyclical design, that is, each of these orientations could be Then we applied the FreeSurfer (version 6.0.0) recon algorithm to perform seg-
turned into one of the two other orientations on a circle defined by stimulus mentation of white matter, grey matter, generating their surfaces and a binary
orientation (Fig. 1B). In effect, the presented and rotated gratings were different brainmask of the cortical ribbon (1 if the voxel falls into the ribbon, 0 otherwise
from each other on every trial, allowing us to independently assess encoding of (steps 5–31 of recon-all algorithm)). We ran the recon algorithm on the extracted
perceived and mentally rotated contents. brainmask from a T1-weighted image with a ‘-hires’ flag for the data with reso-
Overall, there were three possible starting orientations (15°, 75°, or 135°), two lution higher than 1 mm56,59 After running the recon algorithm, the Freesurfer-
directions of rotation (clockwise or counterclockwise) and two rotation magnitudes generated grey and white matter segmentations were visually inspected in each
(60° or 120°), resulting in 12 unique trial types. The 12 unique trials were repeated participant, the borders between CSF and grey matter as well as grey matter and
three times within each run, resulting in a total of 36 trials. Trial order was fully white matter were manually corrected within the region corresponding to the field
randomized. In a nutshell, the experiment consisted of 6 runs, which each lasted of view of functional scans. To improve segmentation quality, we performed the
7 min 16 seconds. Freesurfer segmentation algorithm not only on the T1-weighted image but also the
We cannot ultimately exclude the possibility that participants realized how T1-weighted image divided by the PD-weighted contrast60. However, the T1-
many stimuli were shown overall and only retrieved the relevant orientation from weighted image after the division did not show essential advantages over using the
memory rather than performing the rotation task properly. Such strategies are a data-driven bias field-corrected T1-weighted image. Therefore, for the further
typical problem in mental rotation studies using a fixed number of repeating cortical depth separation we used the T1-weighted image without division.
stimuli. However, our behavioural data provides direct evidence against this
scenario: the response time data cannot be accounted for by the retrieval of fixed Cortical depth and ROI definition. The grey matter segmentation acquired with
orientations (or orientation) labels from memory. We would like to add that after Freesurfer was further utilized to obtain cortical depth-specific compartments.
the experiment, we asked each participant how many orientations they had to Deep, middle and superficial compartments were constructed using an equi-
rotate and none of them reported the real number of orientations in the stimulus volumetric model61,62. In order to analyze depth-specific activity in early visual
set. Therefore, we believe that our participants were genuinely performing the areas, we applied a probabilistic surface-based anatomical atlas63 to reconstruct the
mental rotation task. surfaces of areas V1, V2, and V3 separately for each region and subject. This is an
atlas of the visual field representation (eccentricity and polar angle), and eccen-
Orientation localizer task. To select voxels most responsive to each of the three tricity values were used to select the foveal sub-part of the surface (0–3°). The
orientations shown in the experiment, participants finally completed an additional extracted surface ROIs (V1–V3) were then projected into the volume space and
orientation localizer run. During this run, gratings with the three orientations (15°, intersected with the predefined cortical compartments. In this way, we obtained the
COMMUNICATIONS BIOLOGY | (2021)4:1069 | https://doi.org/10.1038/s42003-021-02582-4 | www.nature.com/commsbio 5ARTICLE COMMUNICATIONS BIOLOGY | https://doi.org/10.1038/s42003-021-02582-4
V1, V2, and V3 ROIs in the Freesurfer anatomical space at three predefined cortical the measurement at 10 s is too close to the presentation of the probe grating to be
depths. contaminated by it.
Image alignment check. Functional volumes did not undergo any additional pre- Statistics. We used repeated-measures analyses of variance (ANOVA) to test the
processing. We did not perform realignment due to utilization of prospective main effect of Signal type (presented vs mentally rotated grating) in the trial and to
motion correction. However, we ensured that the functional runs were well aligned test the interaction of Signal type and Cortical depths (deep and superficial vs.
with each other in each participant, which is required for multivariate pattern middle) (custom function rmanova2 derived by A. Schurger (2005) from Keppel &
analyses of high-resolution fMRI data, by computing inter-run spatial cross- Wickens, “Design and Analysis”, ch.18: https://de.mathworks.com/matlabcentral/
correlations of the signal intensities of the functional volumes. For two participants fileexchange/6874-two-way-repeated-measures-anova). In cases where the
an intensity-based image registration algorithm in MATLAB was used to improve assumption of sphericity was violated the p values were corrected using a Huynh-
inter-run alignment until the inter-run correlations were at least r > .9 on average. Feldt correction (provided as an output of the same function). Significant inter-
The resulting average spatial correlation of experimental runs was (Mean ± SD) actions were followed up with paired-samples one-sided t-tests (t-test function in
0.986 ± 0.01, with the following motion parameters in the translation and rotation MATLAB) to analyze the effects in the assumed directions based on neuroanatomy
directions (Mean ± SD): x: −0.1 ± 0.3, y: 0.2 ± 0.3, z: −0.04 ± 0.3, pitch: and animal findings. To control for multiple comparisons across t-tests, we used
−0.002 ± 0.003, roll: −0.002 ± 0.005, yaw: −0.000 ± 0.003. Further, functional- FDR-corrections that assume independent or positively correlated tests66: these
anatomical alignments were checked visually to ensure that the functional scans corrections allow for maintaining a low false-positive rate while providing rea-
were well aligned to the anatomical image at the location of the ROIs. sonable power to find truly significant results.
Registration. We linearly coregistered the extracted ROIs with predefined cortical depth Data availability
compartments to the EPI volumes within each subject using the Symmetric Normal-
The MRI and behavioural data that were used in this study are available: https://osf.io/
ization (SyN) algorithm of ANTs64. Specifically, first, the T1-weighted anatomical image
3x9fk/?view_only=dd7d8e9462694501a60a4dd308fd9354.
was registered using linear interpolation to the EPI volume averaged over all the
functional runs. Next, we registered the ROIs with the predefined cortical depths to the
EPI volume using nearest neighbor interpolation and applying the coordinate mapping Code availability
(with the voxel size resampled to the functional runs (0.8 isotropic)) obtained in the MATLAB source code for LIBSVM toolbox is available online (libsvm: http://
previous step (Fig. 2C). In the resulting ROIs the number of voxels per cortical depth www.csie.ntu.edu. tw/~cjlin/libsvm/). The code for data sorting, utilizing LIBSVM
(Mean ± SD) was the following in V1: Mdeep = 1158 ± 258; Mmid = 1073 ± 241; toolbox in the present study, and plotting the main result is available: https://github.com/
Msuper = 936 ± 220; in V2: Mdeep = 1096 ± 321; Mmid = 1049 ± 260; Msuper = 901 ± 319; IamPolina/7T_Mental_Rotation.git.
in V3: Mdeep = 1123 ± 364; Mmid = 1019 ± 256; Msuper = 855 ± 308).
Received: 16 November 2020; Accepted: 20 August 2021;
Multivariate pattern analysis
Data extraction. Multivariate pattern analysis (MVPA) was performed in each
subject individually. To prepare the EPI data for the MVPA, we first extracted
activity patterns for each ROI with the predefined cortical depths from the func-
tional images in the main experiment and orientation localizer run. Specifically, in
each experimental run, we extracted voxel-wise activation values for three oriented References
grating conditions (15°, 75°, or 135°) and 12 trials for each condition across 5 TRs 1. Shepard, R. N. & Metzler, J. Mental rotation of three-dimensional objects.
(=10 seconds), starting at trial onset. The EPI data from the orientation localizer Science 171, 701–703 (1971).
run were also aggregated for the three oriented grating conditions (15°, 75°, or 2. Cooper, L. A. Mental rotation of random two-dimensional shapes. Cogn.
135°) and 15 trials per each condition across 5 TRs of trial duration. Psychol. 7, 20–43 (1975).
3. Cooper, L. A. & Podgorny, P. Mental transformations and visual comparison
Classification. Multivariate pattern analysis (MVPA) was carried out using the processes: effects of complexity and similarity. J. Exp. Psychol. Hum. Percept.
linear support vector machine65 (SVMs; libsvm: http://www.csie.ntu.edu. tw/~cjlin/ Perform. 2, 503–514 (1976).
libsvm/) with a fixed cost parameter (c = 1). We performed classification at each 4. Albers, A. M., Kok, P., Toni, I., Dijkerman, H. C. & De Lange, F. P. Shared
cortical depth and ROI independently in the following way. We trained the SVM representations for working memory and mental imagery in early visual
classifier on the fMRI data from the orientation localizer run to discriminate cortex. Curr. Biol. 23, 1427–1431 (2013).
between the three oriented gratings in each TR separately using all the trials (15 5. Christophel, T. B., Cichy, R. M., Hebart, M. N. & Haynes, J. D. Parietal and
data points per orientation per training set). Next, we tested the SVM classifier early visual cortices encode working memory content across mental
using the EPI data from the main experiment (on each trial separately). Each TR in transformations. Neuroimage 106, 198–206 (2015).
orientation localizer task used for the classifier training corresponded to the TR in 6. Rockland, K. S. & Pandya, D. N. Laminar origins and terminations of cortical
the experimental trial used for the classifier testing. As a result, we extracted connections of the occipital lobe in the rhesus monkey. Brain Res. 179, 3–20
predicted labels (15°, 75°, and 135°) for every TR of all the trials in the main (1979).
experiment (chance level 33.3%). Then, we compared the labels predicted by the 7. Lund, J. S. Anatomical organization of macaque monkey striate visual cortex.
SVM classifier with the oriented gratings actually presented, rotated or not used in Annu. Rev. Neurosci. 11, 253–288 (1988).
each trial (as illustrated in Fig. 1C). The proportion of matches between the pre- 8. Van Essen, D. C. & Felleman, D. J. Distributed hierarchical processing in the
dicted grating label and the role of that grating in the trial was accumulated over primate cerebral cortex. Cereb. Cortex http://www.cns.nyu.edu/tony/vns/
trials for each of these three experimental conditions (presented, rotated, and readings/felleman-vanessen-1991.pdf (1991).
unused gratings) to estimate their representational strength within each subject. 9. Markov, N. T. et al. Cortical high-density counterstream architectures. Science
Finally, the resulting estimates in a form of 23 (subjects) × 3 (presented, rotated, https://doi.org/10.1126/science.1238406 (2013).
not shown grating) × 5 (TRs) matrix calculated for each ROI and cortical depth 10. Markov, N. T. et al. Anatomy of hierarchy: feedforward and feedback
was subjected to statistical testing. pathways in macaque visual cortex. J. Comp. Neurol. 522, 225–259 (2014).
Note that in our paradigm the three orientations on each trial are not 11. Harris, K. D. & Mrsic-Flogel, T. D. Cortical connectivity and sensory coding.
independent. The more information about one of the orientations is found (e.g. the Nature 503, 51–58 (2013).
perceived orientation), the less information is found about the other orientations 12. van Kerkoerle, T., Self, M. W. & Roelfsema, P. R. Layer-specificity in the
(e.g. the rotated orientation). We therefore cannot compare classifier choices to
effects of attention and working memory on activity in primary visual cortex.
“chance” level (i.e. 33%). Instead, we compare classifier choices for these
Nat. Commun. 8, 13804 (2017).
orientations to the third, unused orientation. This procedure allowed us to estimate
13. Van Kerkoerle, T. et al. Alpha and gamma oscillations characterize feedback
information about the perceived and rotated orientations independently from each
and feedforward processing in monkey visual cortex. Proc. Natl Acad. Sci. USA
other. For instance, if the representation of the perceived orientation is so strong
that the classifier very often picks the perceived orientation, it may be that the 111, 14332–14341 (2014).
classifier picks the rotated orientation in fewer than 33% of trials. However, this 14. Lawrence, S. J. et al. Laminar organization of working memory signals in
does not mean that there is no information about the rotated orientation: If there human visual cortex. Curr. Biol. 28, 3435–3440 (2018).
are still more classifier choices for the rotated orientation than the unused 15. Lawrence, S. J., Norris, D. G. & De Lange, F. P. Dissociable laminar profiles of
orientation, the rotated orientation is represented in the signal. concurrent bottom-up and top-down modulation in the human visual cortex.
For the in-depth assessment of mental rotation contents, a critical time interval elife 8, e44422 (2019).
was chosen based on the previous studies4,5 where mentally rotated representations 16. Poort, J. et al. The role of attention in figure-ground segregation in areas V1
could be decoded in the period 8–12 seconds after the rotation cue. In our study, and V4 of the visual cortex. Neuron 75, 143–156 (2012).
we included time interval 8–10 s after the rotation cue since the measurement at 17. Roelfsema, P. R., Lamme, V. A. & Spekreijse, H. Object-based attention in the
12 s was likely to carry the representation of a probe grating (shown at 8 s), while primary visual cortex of the macaque monkey. Nature 395, 376–381 (1998).
6 COMMUNICATIONS BIOLOGY | (2021)4:1069 | https://doi.org/10.1038/s42003-021-02582-4 | www.nature.com/commsbioCOMMUNICATIONS BIOLOGY | https://doi.org/10.1038/s42003-021-02582-4 ARTICLE
18. Klein, B. P. et al. Cortical depth dependent population receptive field 47. Khooshabeh, P., Hegarty, M. & Shipley, T. F. Individual differences in mental
attraction by spatial attention in human V1. NeuroImage 176, 301–312 (2018). rotation: piecemeal versus holistic processing. Exp. Psychol. 60, 164 (2013).
19. Liu, C. et al. Layer-dependent multiplicative effects of spatial attention on 48. Pearson, J. The human imagination: the cognitive neuroscience of visual
contrast responses in human early visual cortex. Prog. Neurobiol. 101897 mental imagery. Nat. Rev. Neurosci. 20, 624–634 (2019).
(2020). 49. Fulford, J. et al. The neural correlates of visual imagery vividness—an fMRI
20. Kok, P., Bains, L. J., Van Mourik, T., Norris, D. G. & De Lange, F. P. Selective study and literature review. Cortex 105, 26–40 (2018).
activation of the deep layers of the human primary visual cortex by top-down 50. Zeman, A. et al. Phantasia–the psychological significance of lifelong visual
feedback. Curr. Biol. 26, 371–376 (2016). imagery vividness extremes. Cortex 130, 426–440 (2020).
21. Bergmann, J., Morgan, A. T. & Muckli, L. Two distinct feedback codes in V1 51. Bainbridge, W. A., Pounder, Z., Eardley, A. F. & Baker, C. I. Quantifying
for ‘real’ and ‘imaginary’ internal experiences. Preprint at: https:// Aphantasia through drawing: those without visual imagery show deficits in
www.biorxiv.org/content/biorxiv/early/2019/06/13/664870.full.pdf., 664870 object but not spatial memory. Cortex 135, 159–172 (2021).
(2019). 52. Pounder, Z. et al. Mental rotation performance in aphantasia. J. Vis. 18,
22. Aitken, F. et al. Prior expectations evoke stimulus-specific activity in the deep 1123–1123 (2018).
layers of the primary visual cortex. PLoS Biol. 18, e3001023 (2020). 53. Horga, G., Schatz, K. C., Abi-Dargham, A. & Peterson, B. S. Deficits in
23. Self, M. W., van Kerkoerle, T., Goebel, R. & Roelfsema, P. R. Benchmarking predictive coding underlie hallucinations in schizophrenia. J. Neurosci. 34,
laminar fMRI: neuronal spiking and synaptic activity during top-down and 8072–8082 (2014).
bottom-up processing in the different layers of cortex. Neuroimage 197, 54. Haarsma, J., Kok, P. & Browning, M. The promise of layer-specific
806–817 (2019). neuroimaging for testing predictive coding theories of psychosis. Schizophr.
24. Heinzle, J., Koopmans, P. J., den Ouden, H. E., Raman, S. & Stephan, K. E. A Res. https://doi.org/10.1016/j.schres.2020.10.009 (2020).
hemodynamic model for layered BOLD signals. Neuroimage 125, 556–570 55. Brainard, D. H. The psychophysics toolbox. Spat. Vis. 10, 433–436 (1997).
(2016). 56. Lüsebrink, F., Sciarra, A., Mattern, H., Yakupov, R. & Speck, O. T 1-weighted
25. Uludağ, K. & Blinder, P. Linking brain vascular physiology to hemodynamic in vivo human whole brain MRI dataset with an ultrahigh isotropic resolution
response in ultra-high field MRI. Neuroimage 168, 279–295 (2018). of 250 μm. Sci. Data 4, 1–12 (2017).
26. Bullier, J. Integrated model of visual processing. Brain Res. Brain Res. Rev. 36, 57. In, M. H. & Speck, O. Highly accelerated PSF-mapping for EPI distortion
96–107 (2001). correction with improved fidelity. Magn. Reson. Mater. Phys. Biol. Med. 25,
27. Roelfsema, P. R. & de Lange, F. P. Early visual cortex as a multiscale cognitive 183–192 (2012).
blackboard. Annu. Rev. Vis. Sci. 2, 131–151 (2016). 58. Maclaren, J. et al. Measurement and correction of microscopic head motion
28. Smith, F. W. & Muckli, L. Nonstimulated early visual areas carry information during magnetic resonance imaging of the brain. PLoS ONE 7, e48088 (2012).
about surrounding context. Proc. Natl Acad. Sci. USA 107, 20099–20103 59. Zaretskaya, N., Fischl, B., Reuter, M., Renvall, V. & Polimeni, J. R. Advantages
(2010). of cortical surface reconstruction using submillimeter 7 T MEMPRAGE.
29. Mechelli, A., Price, C. J., Friston, K. J. & Ishai, A. Where bottom-up meets top- Neuroimage 165, 11–26 (2018).
down: neuronal interactions during perception and imagery. Cereb. Cortex 14, 60. Van de Moortele, P. F. et al. T1 weighted brain images at 7 Tesla unbiased for
1256–1265 (2004). Proton Density, T2* contrast and RF coil receive B1 sensitivity with
30. Dijkstra, N., Zeidman, P., Ondobaka, S., van Gerven, M. A. & Friston, K. simultaneous vessel visualization. NeuroImage 46, 432–446 (2009).
Distinct top-down and bottom-up brain connectivity during visual perception 61. Waehnert, M. D. et al. Anatomically motivated modeling of cortical laminae.
and imagery. Sci. Rep. 7, 1–9 (2017). NeuroImage 93, 210–220 (2014).
31. Kastner, S., Pinsk, M. A., De Weerd, P., Desimone, R. & Ungerleider, L. G. 62. Huntenburg, J. M., Steele, C. J. & Bazin, P. L. Nighres: processing tools for
Increased activity in human visual cortex during directed attention in the high-resolution neuroimaging. GigaScience 7, giy082 (2018).
absence of visual stimulation. Neuron 22, 751–761 (1999). 63. Benson, N. C., Butt, O. H., Brainard, D. H. & Aguirre, G. K. Correction of
32. Vetter, P., Smith, F. W. & Muckli, L. Decoding sound and imagery content in distortion in flattened representations of the cortical surface allows prediction
early visual cortex. Curr. Biol. 24, 1256–1262 (2014). of V1-V3 functional organization from anatomy. PLoS Comput. Biol. 10,
33. Amedi, A., Raz, N., Pianka, P., Malach, R. & Zohary, E. Early ‘visual’ cortex e1003538 (2014).
activation correlates with superior verbal memory performance in the blind. 64. Avants, B. B., Epstein, C. L., Grossman, M. & Gee, J. C. Symmetric diffeomorphic
Nat. Neurosci. 6, 758–766 (2003). image registration with cross-correlation: evaluating automated labeling of elderly
34. Vetter, P. et al. Decoding natural sounds in early “visual” cortex of and neurodegenerative brain. Med. image Anal. 12, 26–41 (2008).
congenitally blind individuals. Curr. Biol. 30, 3039–3044 (2020). 65. Muller, K. R., Mika, S., Ratsch, G., Tsuda, K. & Scholkopf, B. An introduction
35. Dijkstra, N., Bosch, S. E. & van Gerven, M. A. Shared neural mechanisms of to kernel-based learning algorithms. IEEE Trans. Neural Netw. 12, 181–201
visual perception and imagery. Trends Cogn. Sci. 23, 423–434 (2019). (2001).
36. Polimeni, J. R., Fischl, B., Greve, D. N. & Wald, L. L. Laminar analysis of 7 T 66. Benjamini, Y. & Yekutieli, D. False discovery rate–adjusted multiple confidence
BOLD using an imposed spatial activation pattern in human V1. Neuroimage intervals for selected parameters. J. Am. Stat. Assoc. 100, 71–81 (2005).
52, 1334–1346 (2010).
37. Self, M. W., van Kerkoerle, T., Supèr, H. & Roelfsema, P. R. Distinct roles of
the cortical layers of area V1 in figure-ground segregation. Curr. Biol. 23, Acknowledgements
2121–2129 (2013). P.I. is supported by the Berlin School of Mind and Brain PhD scholarship. D.K. and
38. Bijanzadeh, M., Nurminen, L., Merlin, S., Clark, A. M. & Angelucci, A. R.M.C. are supported by Deutsche Forschungsgemeinschaft (DFG) grants (KA4683/2-1,
Distinct laminar processing of local and global context in primate primary CI241/1-1, CI241/3-1). R.M.C. is supported by a European Research Council Starting
visual cortex. Neuron 100, 259–274 (2018). Grant (ERC-2018-StG). N.W. is supported by the European Research Council under the
39. Rademaker, R. L., Chunharas, C. & Serences, J. T. Coexisting representations European Union’s Seventh Framework Programme (FP7/2007-2013)/ERC grant agree-
of sensory and mnemonic information in human visual cortex. Nat. Neurosci. ment n° 616905; the European Union’s Horizon 2020 research and innovation pro-
22, 1336–1344 (2019). Hgfv. gramme under the grant agreement No 681094; the BMBF (01EW1711A & B) in the
40. Bastos, A. M. et al. Canonical microcircuits for predictive coding. Neuron 76, framework of ERA-NET NEURON. We thank the staff of the Department of Oral and
695–711 (2012). Maxillofacial Surgery, University Hospital Magdeburg A.ö.R., Christian Zahl, Indra
41. Muckli, L. et al. Contextual feedback to superficial layers of V1. Curr. Biol. 25, Griesau, and Christine Rohloff for creating individually custom-made removable dental
2690–2695, https://doi.org/10.1016/j.cub.2015.08.057 (2015). braces. Computing resources were provided by the high-performance computing facil-
42. Stephan, K. E. et al. Laminar fMRI and computational theories of brain ities at ZEDAT, Freie Universität Berlin.
function. Neuroimage 197, 699–706 (2019).
43. Bause, J., Polimeni, J. R. & Stelzer, J. Impact of prospective motion correction,
distortion correction methods and large vein bias on the spatial accuracy of Author contributions
cortical laminar fMRI at 9.4 Tesla. Neuroimage 208, 116434 (2020). P.I., D.K. and R.M.C. designed the study, R.M.C., E.D., O.S. and N.W. supervised the
44. Chai, Y., Li, L., Huber, L., Poser, B. A. & Bandettini, P. A. Integrated VASO study, P.I., R.Y., A.S., H.M. and F.L. acquired data. P.I., D.K., D.H. and F.L. analyzed the
and perfusion contrast: a new tool for laminar functional MRI. NeuroImage data. P.I., D.K. and R.M.C. wrote the original draft of the manuscript, R.Y., A.S., H.M.,
207, 116358 (2020). F.L., E.D., O.S. and N.W. reviewed and edited the manuscript.
45. Just, M. A. & Carpenter, P. A. Cognitive coordinate systems: accounts of
mental rotation and individual differences in spatial ability. Psychol. Rev. 92, Funding
137 (1985). Open Access funding enabled and organized by Projekt DEAL.
46. Roberts, J. E. & Bell, M. A. Sex differences on a mental rotation task: variations
in electroencephalogram hemispheric activation between children and college
students. Dev. Neuropsychol. 17, 199–223 (2000). Competing interests
The authors declare no competing interests.
COMMUNICATIONS BIOLOGY | (2021)4:1069 | https://doi.org/10.1038/s42003-021-02582-4 | www.nature.com/commsbio 7ARTICLE COMMUNICATIONS BIOLOGY | https://doi.org/10.1038/s42003-021-02582-4
Additional information Open Access This article is licensed under a Creative Commons
Supplementary information The online version contains supplementary material Attribution 4.0 International License, which permits use, sharing,
available at https://doi.org/10.1038/s42003-021-02582-4. adaptation, distribution and reproduction in any medium or format, as long as you give
appropriate credit to the original author(s) and the source, provide a link to the Creative
Correspondence and requests for materials should be addressed to Polina Iamshchinina. Commons license, and indicate if changes were made. The images or other third party
material in this article are included in the article’s Creative Commons license, unless
Peer review information Communications Biology thanks the anonymous reviewers for
indicated otherwise in a credit line to the material. If material is not included in the
their contribution to the peer review of this work. Primary Handling Editor: Karli
article’s Creative Commons license and your intended use is not permitted by statutory
Montague-Cardoso. Peer reviewer reports are available.
regulation or exceeds the permitted use, you will need to obtain permission directly from
the copyright holder. To view a copy of this license, visit http://creativecommons.org/
Reprints and permission information is available at http://www.nature.com/reprints
licenses/by/4.0/.
Publisher’s note Springer Nature remains neutral with regard to jurisdictional claims in
published maps and institutional affiliations. © The Author(s) 2021
8 COMMUNICATIONS BIOLOGY | (2021)4:1069 | https://doi.org/10.1038/s42003-021-02582-4 | www.nature.com/commsbioYou can also read