PHYLOGEOGRAPHY AND GENOMIC EPIDEMIOLOGY OF SARS COV 2 IN ITALY AND EUROPE WITH NEWLY CHARACTERIZED ITALIAN GENOMES BETWEEN FEBRUARY JUNE 2020
←
→
Page content transcription
If your browser does not render page correctly, please read the page content below
www.nature.com/scientificreports

                OPEN             Phylogeography and genomic
                                 epidemiology of SARS‑CoV‑2
                                 in Italy and Europe with newly
                                 characterized Italian genomes
                                 between February‑June 2020
                                 Alessia Lai1,2, Annalisa Bergna1, Stefano Toppo3,4, Marina Morganti5,
                                 Stefano Menzo6, Valeria Ghisetti7, Bianca Bruzzone8, Mauro Codeluppi9, Vito Fiore10,
                                 Emmanuele Venanzi Rullo11, Guido Antonelli12, Loredana Sarmati13, Gaetano Brindicci14,
                                 Annapaola Callegaro15, Caterina Sagnelli16, Daniela Francisci17, Ilaria Vicenti18,
                                 Arianna Miola19, Giovanni Tonon20,21, Daniela Cirillo22, Ilaria Menozzi5, Sara Caucci6,
                                 Francesco Cerutti7, Andrea Orsi23, Roberta Schiavo24, Sergio Babudieri10, Giuseppe Nunnari11,
                                 Claudio M. Mastroianni25, Massimo Andreoni13, Laura Monno14, Davide Guarneri15,
                                 Nicola Coppola16, Andrea Crisanti26,27, Massimo Galli1, Gianguglielmo Zehender1,2,28* &
                                 SCIRE-SARS-CoV-2 Italian Research Enterprise-Collaborative Group*

                                 The aims of this study were to characterize new SARS-CoV-2 genomes sampled all over Italy and
                                 to reconstruct the origin and the evolutionary dynamics in Italy and Europe between February and
                                 June 2020. The cluster analysis showed only small clusters including < 80 Italian isolates, while most
                                 of the Italian strains were intermixed in the whole tree. Pure Italian clusters were observed mainly
                                 after the lockdown and distancing measures were adopted. Lineage B and B.1 spread between late

                                 1
                                  Department of Biomedical and Clinical Sciences Luigi Sacco, University of Milan, Milan, Italy. 2Pediatric Clinical
                                 Research Center Fondazione Romeo ed Enrica Invernizzi, University of Milan, Milan, Italy. 3Department of
                                 Molecular Medicine, University of Padova, Padua, Italy. 4CRIBI Biotech Center, University of Padova, Padua,
                                 Italy. 5Risk Analyses and Genomic Epidemiology Unit, Istituto Zooprofilattico Sperimentale della Lombardia
                                 e dell’Emilia Romagna, Parma, Italy. 6Department of Biomedical Sciences and Public Health, Virology Unit,
                                 Polytechnic University of Marche, Ancona, Italy. 7Laboratory of Microbiology and Virology, Amedeo di Savoia,
                                 ASL Città di Torino, Torino, Italy. 8Hygiene Unit, IRCCS AOU San Martino-IST, Genoa, Italy. 9UOC of Infectious
                                 Diseases, Department of Oncology and Hematology, Guglielmo da Saliceto Hospital, AUSL Piacenza, Piacenza,
                                 Italy. 10Infectious and Tropical Disease Clinic, Department of Medical, Surgical and Experimental Sciences,
                                 University of Sassari, Sassari, Italy. 11Unit of Infectious Diseases, Department of Experimental and Clinical
                                 Medicine, University of Messina, Messina, Italy. 12Department of Molecular Medicine, University Hospital
                                 Policlinico Umberto I, Sapienza University of Rome, Rome, Italy. 13Infectious Diseases, Tor Vergata University,
                                 Rome, Italy. 14Infectious Diseases Unit, University of Bari, Bari, Italy. 15Microbiology and Virology Laboratory, ASST
                                 Papa Giovanni XXIII, Bergamo, Italy. 16Department of Mental Health and Public Medicine, University of Campania
                                 “Luigi Vanvitelli”, Naples, Italy. 17Department of Medicine and Surgery, Clinic of Infectious Diseases, “Santa Maria
                                 della Misericordia” Hospital, University of Perugia, Perugia, Italy. 18Department of Medical Biotechnologies,
                                 University of Siena, Siena, Italy. 19Intesa San Paolo Innovation Center-AI LAB, Turin, Italy. 20Center for Omics
                                 Sciences, IRCCS Ospedale San Raffaele, Milan, Italy. 21Division of Experimental Oncology, IRCCS Ospedale San
                                 Raffaele, Milan, Italy. 22Division of Immunology, Transplantation and Infectious Disease, IRCCS Ospedale San
                                 Raffaele, Milan, Italy. 23Department of Health Sciences (DISSAL), University of Genoa, Genoa, Italy. 24UOC of
                                 Microbiology, Department of Clinical Pathology, Guglielmo da Saliceto Hospital, AUSL Piacenza, Piacenza,
                                 Italy. 25Department of Public Health and Infectious Diseases, University Hospital Policlinico Umberto I, Sapienza
                                 University of Rome, Rome, Italy. 26Microbiology and Virology Diagnostic Unit, Padua University Hospital, Padua,
                                 Italy. 27Department of Life Science, Imperial College London, South Kensington Campus Imperial College Road,
                                 London SW7 AZ, UK. 28CRC‑Coordinated Research Center “EpiSoMI”, University of Milan, Milan, Italy. *A list of
                                 authors and their affiliations appears at the end of the paper. *email: gianguglielmo.zehender@unimi.it

Scientific Reports |   (2022) 12:5736                | https://doi.org/10.1038/s41598-022-09738-0                                                    1

                                                                                                                                                Vol.:(0123456789)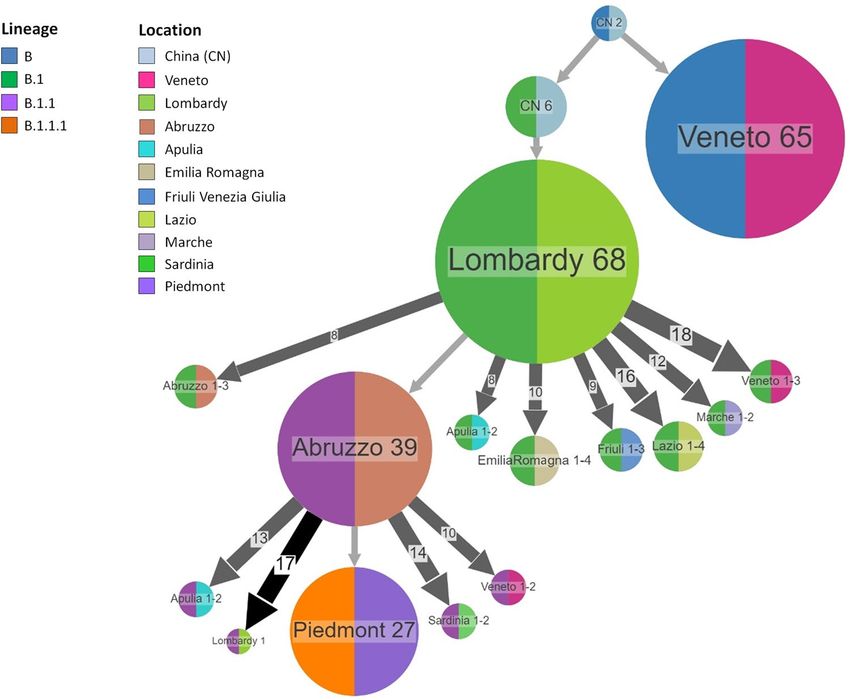
www.nature.com/scientificreports/
January and early February 2020, from China to Veneto and Lombardy, respectively. Lineage B.1.1
(20B) most probably evolved within Italy and spread from central to south Italian regions, and to
European countries. The lineage B.1.1.1 (20D) developed most probably in other European countries
entering Italy only in the second half of March and remained localized in Piedmont until June 2020.
In conclusion, within the limitations of phylogeographical reconstruction, the estimated ancestral
scenario suggests an important role of China and Italy in the widespread diffusion of the D614G
variant in Europe in the early phase of the pandemic and more dispersed exchanges involving several
European countries from the second half of March 2020.
SARS-CoV-2 was first described in Wuhan city, China, likely resulting from adaptation of an animal virus to
humans and spread rapidly around the world, causing > 170 million documented infections and > 3.5 million
deaths at the end of May 2021 (https://g isand data.m aps.a rcgis.c om/a pps/o
psdas hboar d/i ndex.h tml#/b
da759 4740
fd40299423467b48e9ecf6). Italy was the first European country to experience a major SARS-CoV-2 disease
(COVID-19) epidemic, with a first wave of transmission characterized by a relatively high number of deaths
starting from February 20, in Codogno, L ombardy1. A few weeks later, the first lockdown and other containment
measures, such as quarantine of travellers returning from high-risk areas, reduced the number of COVID-19
cases in Italy and prevented the escalation of clusters of community transmission.
The COVID-19 pandemic represents an unprecedented challenge for global public health with the continuous
emergence of new genetic variants of the v irus2 and the related implications such as their potentially increased
pathogenicity or transmissibility and, possibly, vaccine escape. Notwithstanding a unique proofreading activity
among RNA v iruses3, SARS-CoV-2 has been exploring its genetic space due to an exceedingly large number of
transmissions and replicative cycles, with an estimated evolutionary rate around 2 mutations per month. Indeed,
notable genomic variability can be observed among all viral sequences submitted to the GISAID database, which
have been grouped into two main lineages, A and B, each containing a growing number of sub-lineages4. Both
lineages likely separated early during the Wuhan outbreak, with lineage B now being more widely distributed. In
this context, the establishment of surveillance networks at national and international level is necessary to trace
the pandemic and inform the appropriate public health interventions.
Presently no comprehensive data are available to establish the lineage of SARS-CoV-2 strains circulating in
Italy and their population dynamics, although regional data have been published for S ardinia5, Lombardy6 and
Abruzzo7. The short time since its identification and the limited number of sequences available in public databases
makes it difficult to understand the biological significance of the mutations observed so far, whether they are
the product of adaptive s election8 or rather the result of genetic drift due to the high level of genetic variation
(http://v irolo
gical.o
rg/t/r espon
se-t o-o
n-t he-o rigin-a nd-c ontin
uing-e volut ion-o
f-s ars-c ov-2/4 18). In addition, as
Italy can be considered the first and one of the main incubators for the spread of the epidemic in Europe and in
the United States, the analysis of SARS-CoV-2 molecular epidemiology since the first phases of the epidemic in
this country is of particular interest for unravelling the first evolutionary steps of the virus outside China and its
adaptation to western countries. In this context, the reconstruction of the spatial and temporal dynamics is fun-
damental to understand the origin and evolution of SARS-CoV-2 from the ancestral strains to the new variants.
In this study, viral sequences have been analysed for mutations and phylogeny, in comparison to national and
international SARS-CoV-2 genomes, to hypothesize the route of arrival to Italy, the subsequent dispersion and
further spread to other countries. Major SARS-CoV-2 infection clusters in Italy were identified and character-
ized and their role in the international virus spread was assessed by using phylogenetic analyses. In addition,
the spatiotemporal SARS-CoV-2 dynamics in Italy was investigated by a relatively new maximum likelihood
approach for ancestral character reconstruction, by combining the reconstruction relative to the sampling loca-
tion with the evolutionary lineage.
Results
A total of 192 SARS-CoV-2-Italian genomes were newly generated for this study. Travel history was available
for 137 (71.3%) patients. All of them reported no international travel in the two weeks preceding the onset of
symptoms. One case of contact with a traveller from Bangladesh was reported. Main patients’ information is
reported in Table 1.
Analysis of the Italian dataset. Genomic diversity on the basis of the lineage/clade classification. The
most prevalent lineages were B.1 (n = 222, 47.7%, including 32 lineages derived from B.1 such as B.1.76, B.1.91,
B.1.104, B.1.142, B.1.153, B.1.177, B.1.179, B.1.222, B.1.225, B.1.356, B.1.610) and B.1.1 (n = 141, 30.3%, including
19 lineages derived from B.1.1 such as B.1.1.28, B.1.1.61, B.1.1.161, B.1.1.202, B.1.1.232, B.1.1.331 and B.1.1.372)
followed by the lineages B (n = 73, 15.7%) and B.1.1.1 (n = 29, 6.2%). The Nextclade classification showed a high
prevalence of the clades 20A (n = 207, 44.5%) and 20B (n = 141, 30.3%), followed by 19A (n = 84, 18.1%), and 20D
(n = 29, 6.2%). Only 4 strains were clade 20C (0.9%).
The geographical distribution of the SARS-CoV-2 lineages/clades in Italy (Fig. 1) showed several different
epidemiological patterns. Some regions mainly in Northern-Central Italy (Friuli Venezia Giulia, Marche, Emilia
Romagna, Lombardy, Lazio) showed a high prevalence of B.1/20A (between 70 and 100%). Other regions, mainly
in the Central-Southern Italy (Sardinia, Sicily, Abruzzo, Apulia) had the highest prevalence of B.1.1/20B (from
57% to more than 90%). Other regions showed an equal proportion of both lineages (Basilicata, Liguria, Tuscany,
Umbria). Two regions had a unique pattern: Veneto, in which the most prevalent lineage was B/19A (66/97, 68%)
and Piedmont, showing 73% (27/37) of B.1.1.1/20D lineage.
Scientific Reports | (2022) 12:5736 | https://doi.org/10.1038/s41598-022-09738-0 2
Vol:.(1234567890)
www.nature.com/scientificreports/

                                                                          Sequences (n = 192)
                                   Age              Median (min–max)      68 (9–99)
                                                    M                     89
                                   Gender
                                                    F                     76
                                                    Apulia                9
                                                    Campania              4
                                                    Emilia Romagna        14
                                                    Lazio                 20
                                                    Liguria               15
                                                    Lombardy              10
                                   Region
                                                    Marche                11
                                                    Piedmont              17
                                                    Sardinia              13
                                                    Sicily                12
                                                    Umbria                2
                                                    Veneto                65
                                                    Yes                   0
                                   Travel History   No                    121
                                                    n.a.*                 16

                                  Table 1.  Characteristics of the studied populations. *n.a.: not available.

                                  Figure 1.  Spatial distribution of lineages and clades. (a, b) Map of Italy reporting the lineage distribution (a)
                                  and the clade assignment (b) in every region.

                                     A change in the prevalence of the SARS-CoV-2 lineages between February and May was observed. The
                                  most frequently detected lineages were B/19A and B.1/20A in February and first half of March, representing
                                  88% of all the genomes obtained in that period of time. Subsequently, starting from the second half of March,
                                  B.1.1/20B and other lineages (B.1.1.1/20D) became more prevalent (60.7% between 15 and 31 March, 46.2% in
                                  April, 51.6% in May).

Scientific Reports |   (2022) 12:5736 |                      https://doi.org/10.1038/s41598-022-09738-0                                                3

                                                                                                                                                 Vol.:(0123456789)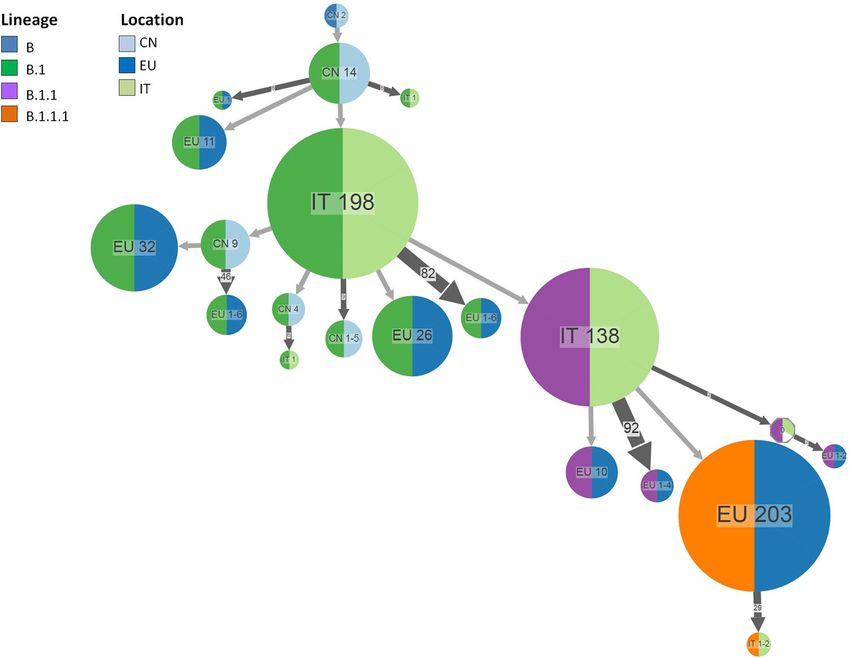
www.nature.com/scientificreports/
B.1.1 n = 141 B.1.1.1 n = 29 20A n = 207 20B n = 141 20D n = 29
Gene B n = 73 (%) B.1 n = 222 (%) (%) (%) 19A n = 85 (%) (%) (%) 20C n = 4 (%) (%)
T265I – – – – – – 4 (100) –
T1246I – – – 29 (100) – – – 29 (100)
T1543I 11 (15.6) – – – 11 (13.1) – – – –
a
G3278S – – – – – – – 29 (100)
ORF1a
M3752L – – – 5 (17.2) – – – 5 (17.2)
M3752T – – – 5 (17.2) – – – 5 (17.2)
L3606F 67 (91.8) – – – 69 (82.1) – – – –
F3753I – – – 8 (27,6) – – – 8 (27.6)
ORF1bb P314L – 214 (96.4) 130 (92.2) 29 (100) 207 (100) 130 (92.2) 4 (100) 29 (100)
Sc D614G – 205 (92.3) 18 (84.3) 29 (100) 9 (10.7) 197 (95.2) 118 (83.7) 1 (25) 29 (100)
Q57H – – – – – – 4 (100) –
ORF3ad A99V – – – – – – 3 (75) –
G251V 67 (91.8) – – – 69 (82.1) – – – –
Me D3G – 51 (22.9) – – – 49 (23.7) – –
R203K – – 140 (99.3) 29 (100) – – 140 (99.3) – 29 (100)
Nf
G204R – – 140 (99.3) 29 (100) – – 140 (99.3) – 29 (100)
ORF14g G50R – – 138 (98.6) 29 (100) – – 138 (97.9) – 29 (100)
Table 2. Aminoacid substitutions found in more than 10% of sequences stratified according to lineage
and clade. a Open Reading Frames 1a. b Open Reading Frames 1b. c Spike gene. d Open Reading Frames 3a.
e
Membrane gene. f Nucleocapsid gene. g Open Reading Frames 14.
Genetic distances and mutation analyses. The overall mean p-distance between all the Italian isolates was 3.9
(SE: 0.4) s/10,000 nts corresponding to a mean of 10.1 (SE: 1.01) substitutions per genome. Genetic distance
remained small with a mean of 10.23 (SE: 1.09) substitutions, of which 3.13 (SE:0.59) were synonymous and 6.85
(SE:0.79) non-synonymous. A higher heterogeneity was observed in sequences from Piedmont (20.4, SE: 1.6)
and Sicily (18.4, SE: 1.2) compared to other regions. Interestingly, an increasing number of differences over time
was recorded, from 5.7 (SE: 0.81) in February to 20.1 (SE: 1.1) in May.
Seventeen amino acid substitutions were present in more than 10% of the Italian isolates but only one of
them was in the spike protein (D614G). No mutations were observed in the receptor binding domain (RBD) in
the whole Italian sequence dataset. Only eleven B lineage sequences in the whole dataset, all from Veneto (clade
19A), carried T1543I in orf1a. Overall, the B sequences showed a distinct mutations pattern from those of other
lineages, including mutations L3606F, G251V in orf1a and orf3a, respectively. The B.1.1.1 lineage presented
additional substitutions in comparison with B.1 and B.1.1 lineages such as T1246I in orf1a in all isolates. Table 2
shows the most frequent amino acid substitutions stratified by lineage and clade.
Phylogenetic analysis by ML and Bayesian methods. The phylogenetic analysis by Bayesian method assigning
each tip to its lineage showed 4 large highly significant clades corresponding to the main circulating lineages in
Italy (B, B.1, B.1.1, and B.1.1.1) (Fig. 2). B1, B.1.1 and B.1.1.1 were nested into each other, while B segregated
independently. Chinese sequences tended to segregate at the outgroup of the Italian clades within B and B.1 line-
ages. The estimation of the tMRCAs of the main clades suggested that B lineage spread to Italy in the last week of
January 2020, lineage B.1.1 emerged later, in mid-February and B.1.1.1 was the latest, spreading in early March.
ML analysis showed similar tMRCAs but with broader confidential intervals (Table 3).
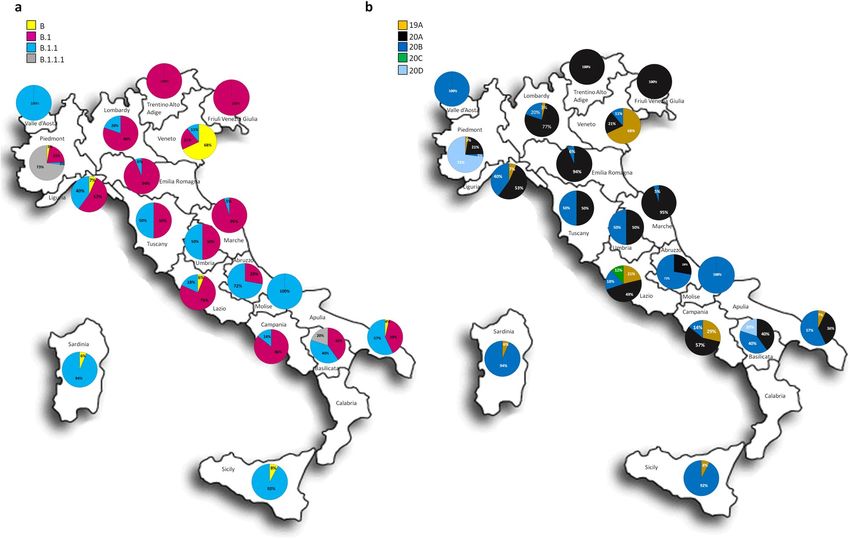
Phylogeography in Italy. The phylogeography of SARS-CoV-2 identified China as the location of the tree root
(Fig. 3 and Supplementary Fig. 1). Four main large clusters were identified. The earliest clusters were in Lom-
bardy and Veneto, directly linked to China, while later (around the second half of March) other clusters appeared
in Abruzzo and Piedmont. Combining the phylogeography with the SARS-CoV-2 lineages, the reconstruction
of the ancestral state showed that lineage B and B.1 spread from China to Veneto and Lombardy, respectively.
While lineage B apparently remained confined to Veneto (and it was successfully extinguished), lineage B.1 fur-
ther spread from Lombardy to other Italian regions (Veneto, Emilia Romagna, Abruzzo, Marche, Apulia, Friuli
Venezia Giulia and Lazio). Lineage B.1.1 spread from central Italy (Abruzzo) to other Italian regions (Veneto,
Lombardy, Apulia, Sardinia). Finally, the lineage B.1.1.1 emerged later and remained apparently localized in
Piedmont without further spread to other regions.
Analysis of the international data set. Italian clusters. The phylogenetic analysis by ML of the entire
dataset including Italian, European and Chinese genomes showed that the majority of the Italian isolates were
dispersed in the entire tree. A total of 80 (out of 465, 17.2%) Italian isolates were included in 22 highly supported
clusters (Table 4). Of these, 12 (54.5%) were within the lineage B.1, five (22.7%) were B.1.1/20B, three (13.6%)
were B.1.1.1/20D and two (9.1%) were B/19A. All but one B.1 clusters were classified as 20A clade. Cluster #19
was the only exception and included four Italian strains classified as clade 20C (all from Rome), showing a mean
Scientific Reports | (2022) 12:5736 | https://doi.org/10.1038/s41598-022-09738-0 4
Vol:.(1234567890)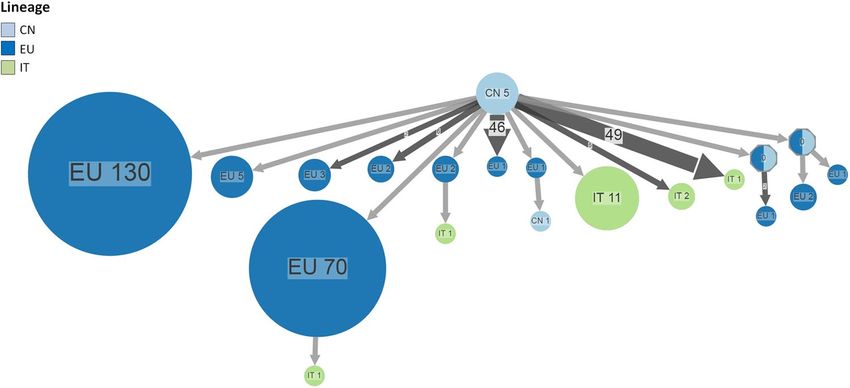
www.nature.com/scientificreports/

                                  Figure 2.  SARS-CoV-2 Bayesian phylogeographic tree of 479 strains. Large red and purple circles indicate
                                  highest posterior probability ranging from 1 to 0.9. The branches are coloured based on the most probable
                                  lineage of the descendent nodes.

                                               Maximum likelihood                       Bayesian
                                   Node        Median         CI_low       CI_up        Median       CI_low       CI_up        spp*
                                   Tree root   17/12/2019     05/11/2019   28/12/2019   20/12/2019   09/12/2019   28/12/2019   1
                                   B           24/12/2019     30/11/2019   10/01/2020   04/01/2020   28/12/2020   04/01/2020   0.82
                                   B IT        29/01/2020     20/01/2020   29/01/2020   19/01/2020   08/01/2020   26/01/2020   0.92
                                   B.1         24/12/2019     30/11/2019   10/01/2020   15/01/2020   09/01/2020   23/01/2020   0.95
                                   B.1 IT**    24/01/2020     13/01/2020   24/01/2020   19/01/2020   16/01/2020   23/01/2020   0.99
                                   B.1.1       12/02/2020     31/01/2020   16/02/2020   17/02/2020   10/02/2020   21/02/2020   0.73
                                   B.1.1.1     22/02/2020     10/02/2020   05/03/2020   03/03/2020   03/03/2020   10/03/2020   0.99

                                  Table 3.  Time of the Most Recent Common Ancestor (tMRCA) estimates and confidence intervals (CI) of the
                                  mains lineages. *spp, state posterior probability. **IT, Italy.

                                  tMRCA falling in March 2020. Three clusters (13.6%) were singletons (including only single Italian isolates not
                                  linked to other Italian sequences), probably corresponding to sporadic introductions followed by limited circu-
                                  lation, while the remaining 19 clusters encompassed at least two Italian isolates, suggesting a local transmission.
                                  Thirteen of these (68.4%) included only Italian strains (suggesting a mainly local circulation of this lineage),
                                  while 6 (31.6%) included isolates from other European countries, and one of them (B.1) included also one Chi-
                                  nese genome.
                                      The estimate of the clusters tMRCA by ML method confirmed that the first transmission events in Italy dated
                                  around the second half of January and early February. Eighteen clusters had a common ancestor dating before the
                                  introduction of the containment measures in our country. In particular, B.1/20A clusters predominated (10/14)
                                  at earlier time points (before March) while in March other clades (20B, 20C and 20D) prevailed (6/8). Moreover,
                                  the mixed and singleton clusters were prevalent at the beginning, while pure Italian clusters were the only clusters
                                  observed after the lockdown. The earliest cluster (#1), was lineage B.1/20A, dated back to average 20/01/2020
                                  (CI95% 08/01–24/01/2020) and included only four North Italian strains: one from Lodi, two from Milan (the
                                  locations where autochthonous COVID-19 cases were firstly identified in Italy) and one from Piacenza. The first
                                  B.1.1 cluster dated back to 10/02/2020 (CI95% 28/01/2020–12/03/2020) and included 3 Italian isolates from
                                  Abruzzo. Three B.1.1.1/20D clusters dated back to 02 March (CI95% 22/02/2020–02/03/2020). Only two small
                                  Italian clusters supported by significant bootstraps were observed within the ML tree including B/19A isolates.
                                  In particular a single pure Italian cluster included 11 genomes from Veneto (province of Padua), characterized
                                  by the substitution T1543I in orf1a, not detected in any of the other B/19A genomes in our international dataset.

                                  Phylogeographical analysis in Europe. Combining the ancestral state reconstruction for the location with the
                                  lineage (Fig. 4 and Supplementary Fig. 2), the analyses showed that B.1 probably originated in China and spread

Scientific Reports |   (2022) 12:5736 |                     https://doi.org/10.1038/s41598-022-09738-0                                              5

                                                                                                                                               Vol.:(0123456789)
www.nature.com/scientificreports/
Figure 3. Ancestral reconstruction of SARS-CoV-2 lineages B.1 using the Italian dataset. The figure shows the
compressed visualization produced by PastML using marginal posterior probability approximation (MPPA)
with an F81-like model. Different colours correspond to different Italian geographical regions and lineages.
Numbers inside (or next to) the circles indicate the number of strains assigned to the specific node.
Cluster_ID Num Seqs ITa EUb CNc Lineage Clade MLd median CIe_low CI_up Type of cluster*
1 4 4 0 0 B.1 20A 20/01/2020 08/01/2020 24/01/2020 IT
6 11 2 8 1 B.1 20A 24/01/2020 10/01/2020 21/02/2020 M
22 3 3 0 0 B.1 20A 31/01/2020 11/01/2020 03/03/2020 IT
2 6 6 0 0 B.1 20A 01/02/2020 17/01/2020 10/02/2020 IT
8 3 3 0 0 B.1.1 20B 10/02/2020 28/01/2020 12/03/2020 IT
3 7 5 2 0 B.1 20A 13/02/2020 26/01/2020 22/02/2020 M
7 3 2 1 0 B.1 20A 17/02/2020 17/01/2020 01/03/2020 M
11 3 3 0 0 B.1 20A 20/02/2020 18/01/2020 11/03/2020 IT
10 4 2 2 0 B.1.1 20B 20/02/2020 31/01/2020 12/03/2020 M
9 5 3 2 0 B.1 20A 20/02/2020 26/01/2020 13/03/2020 M
12 6 1 5 0 B.1.1 20B 22/02/2020 06/02/2020 27/02/2020 S
13 3 3 0 0 B.1 20A 23/02/2020 22/01/2020 24/03/2020 IT
5 11 11 0 0 B 19A 24/02/2020 14/02/2020 24/02/2020 IT
4 3 1 0 0 B 19A 24/02/2020 28/01/2020 28/02/2020 S
14 3 3 0 0 B.1 20A 01/03/2020 29/01/2020 01/03/2020 IT
15 11 3 8 0 B.1.1.1 20D 02/03/2020 22/02/2020 02/03/2020 M
17 5 1 4 0 B.1.1.1 20D 02/03/2020 22/02/2020 02/03/2020 S
16 8 8 0 0 B.1.1.1 20D 02/03/2020 22/02/2020 02/03/2020 IT
19 4 4 0 0 B.1 20C 08/03/2020 07/02/2020 11/03/2020 IT
18 3 3 0 0 B.1.1 20B 08/03/2020 06/02/2020 17/03/2020 IT
20 5 5 0 0 B.1.1 20B 18/03/2020 24/02/2020 24/03/2020 IT
21 4 4 0 0 B.1 20A 31/03/2020 05/03/2020 15/04/2020 IT
Table 4. Main characteristics of the identified clusters. a Italian strains. b European strains, with the exception
of Italy. c Chinese strains. d Maximum likelihood. e Confidence Interval. *Type of cluster: M, mixed; IT, Italian; S,
single Italian isolate.
Scientific Reports | (2022) 12:5736 | https://doi.org/10.1038/s41598-022-09738-0 6
Vol:.(1234567890)www.nature.com/scientificreports/
Figure 4. Ancestral reconstruction of SARS-CoV-2 lineages B.1 using the European dataset. The figure shows
the compressed visualization produced by PastML using marginal posterior probability approximation (MPPA)
with an F81-like model. Different colours correspond to different European countries and lineages. Numbers
inside (or next to) the circles indicate the number of strains assigned to the specific node. The joint ancestral
scenario (Joint) and maximum a posteriori (MAP) predictions are shown for the uncertain nodes (shown as
octagonal icons). CN, China; IT, Italy, EU, Europe.
to several European countries reaching Italy several times, forming a large cluster which included initially 59
(around the first week of March) and finally 198 genomes, and 6 further independent introductions mainly cor-
responding to a group of genomes characterized only by the substitution D614G but lacking other substitutions,
in particular the P314L in the RdRp identifying the clade 20A (lineage B.1, clade 19A).
Starting from Italy, B1/20A spread to other European countries being also reintroduced later to China.
A second large Italian cluster, including 138 genomes of lineage B.1.1, emerged from the Italian B.1 cluster.
Multiple introductions of B.1.1 were observed from Italy to other European countries. A large cluster (n = 203
genomes) corresponding to B.1.1.1 lineage appeared in Europe in the early March and reached Italy only later
(second half of March) (Fig. 4). A total of 7 nodes remained undetermined. A separate analysis conducted dis-
tinguishing European countries (rather than considering a single generalized group), generally confirmed this
scenario and allowed to reconstruct in greater detail the dispersion of the epidemic in the European countries
(Supplementary Fig. 3).
The analysis of lineage B showed that only 2 nodes remained undetermined between Europe and China (Sup-
plementary Fig. 4). The visualization (Fig. 5) suggested several introductions from China to Italy starting with
the end of February. A single cluster corresponding to the previously described cluster#5 was observed, while
the other strains apparently represent multiple independent introductions forming small groups of no more than
2 sequences. Two sporadic introductions from Europe were also observed. Unlike the ancestral reconstruction
for B.1 lineage, this scenario was different as the migratory flows seem to stop in Italy without further spread.
The analysis conducted among European countries (Supplementary Fig. 5), highlighted the same ancestral
scenario but did not show any introduction from Europe.
Discussion
The present study shows that a few different SARS-CoV-2 lineages (B, B.1 and B.1.1, which largely correspond
to clades 19A, 20A and 20B) were the most prevalent in Italy since the beginning of the pandemic, accounting
for more than 93.8% of the 465 isolates in the dataset considered. This is in accordance with previous studies
of the genomic epidemiology of SARS-CoV-2 in Italy performed by our and other Italian research teams6,9,10.
Nevertheless, we observed important differences in the distribution of such lineages and clades both in space
and in time. Several regions, mostly in Northern Italy, showed a high prevalence of B.1 lineage (clade 20A),
while other regions, predominantly in Central/Southern Italy, were characterized by a higher prevalence of B.1.1
(clade 20B). Two regions presented a unique scenario with one highly predominant lineage: Veneto, in North-
Eastern Italy, where a high prevalence of lineage B (19A clade) was observed in the early hit area of Padua and
Scientific Reports | (2022) 12:5736 | https://doi.org/10.1038/s41598-022-09738-0 7
Vol.:(0123456789)www.nature.com/scientificreports/
Figure 5. Ancestral reconstruction of SARS-CoV-2 lineages B using the European dataset. The figure shows
the compressed visualization produced by PastML using marginal posterior probability approximation (MPPA)
with an F81-like model. Different colours correspond to different European countries and lineages. Numbers
inside (or next to) the circles indicate the number of strains assigned to the specific node. The joint ancestral
scenario (Joint) and maximum a posteriori (MAP) predictions are shown for the uncertain nodes (shown as
octagonal icons). CN, China; IT, Italy, EU, Europe.
Piedmont, in North-Western Italy, where lineage B.1.1.1 (clade 20D) was highly prevalent (73%) as opposed to
no cases in the other regions.
Lineages B and B.1, as well as clades 19A and 20A, were largely prevalent at the beginning of the epidemic
between January and the first half of March, while other lineages (B.1.1, B.1.1.1) and clades (20B, 20C and 20D)
were more prevalent later in the pandemic. The substitution of distinct SARS-CoV-2 lineages over time was con-
firmed by the estimation of the main lineages tMRCAs, suggesting an early spread in Italy of lineages B and B.1
in the second half of January 2020, followed later by the emergence of other B.1 descendants (B.1.1 and B.1.1.1)
between late February and March. These results correlate with the consolidated epidemiological data showing
that the first introduction of imported COVID-19 cases in Italy occurred at the end of January 2020, after the
identification of two Chinese tourists in Rome infected by lineage B SARS-CoV-2, apparently without further
spread. The first autochthonous cases of COVID-19 in Italy were documented several weeks later (21 Febru-
ary) when the first Italian transmissions without obvious connections with China were described in Lombardy
(Codogno and in other centres of the Lodi’s area), where lineage B1 was prevalent, and Veneto (the province of
Padua), where dominated lineage B at the beginning. On the contrary, the earliest cases in Central-Southern
regions were reported a few days later (in Emilia Romagna and Tuscany on February 24 and in Sicily, Abruzzo,
Marche and Apulia on February 26), while the number of cases remained relatively low until at least the second
half of March (https://www.epicentro.iss.it/coronavirus/sars-cov-2-dashboard).
The analysis by ancestral character reconstruction of the Italian dataset, assigning each taxon to the region
where it was sampled and the main viral lineage to which it belongs, showed two distinct patterns of dispersion
of SARS-CoV-2. The first pathway concerns lineage B which was introduced to Veneto giving rise to a cluster
that apparently disappeared in that region within the first half of March. The second pattern involved lineage B.1
which seems to have entered Lombardy and spread from there to other Italian regions, mainly in Central (i.e.
Marche, Abruzzo) and Northern (i.e. Emilia Romagna, Veneto) Italy. This observation is in agreement with the
epidemiological data showing the effective suppression of the SARS-CoV-2 outbreak in Veneto in the early times
of the epidemic by a highly effective comprehensive testing and tracing approach and local lockdowns11. Central
Italy (Abruzzo) seems to represent another important centre of dispersion of the lineage B.1.1 (descendant from
B.1) mainly to South in mid-March. The introduction of the SARS-CoV-2 lineage B.1.1.1 occurred in Piedmont
in the second half of March and apparently did not spread further.
The cluster analysis performed on the ML tree of the global dataset showed few and small (≤ 11 isolates)
Italian clusters, including 17.2% of total Italian strains, while the majority of them were intermixed in the whole
tree, frequently near the clades’ root (in particular for clades B.1 and B.1.1). This observation is in contrast with
data from other European countries (i.e. Spain, Scotland or UK) describing from hundreds to thousands of phy-
logenetic clusters. This may be related to several reasons, including the poor sampling in the early stages of the
Italian outbreak and the low variability of the virus. Nevertheless, Italy was one of the earliest European countries
involved in the pandemic, thus the position of Italian strains near to the root of the tree is not surprising and
highlights the central role played by Italy in the early spread of the epidemic. Moreover, most of the earliest clus-
ters, dating before the implementation of the Italian national lockdown (2020-03-11), were frequently “mixed” or
singletons, including international isolates, while clusters dating after the lockdown were mainly pure Italian. This
could be related to the fact that the social distancing measures “froze” the transmission chain and in turn shut
off viral evolution. The blockade or limitation of international travelling likely contributed to halt virus spread.
These observations were more deeply investigated by reconstructing the ancestral scenario from the ML trees
obtained with the International data set which, similar to that obtained with Italian data set, showed two well
Scientific Reports | (2022) 12:5736 | https://doi.org/10.1038/s41598-022-09738-0 8
Vol:.(1234567890)www.nature.com/scientificreports/
defined phylogeographic patterns. The first pathway is that of lineage B showing a large number of independent
introductions indicating multiple importation events, most probably from China (or elsewhere in Asia) to Italy
as well as to other European countries, even if sporadic introductions to Italy from other European countries
could not be excluded. The second phylogeographic scenario involving lineage B.1, showed initially only a few
introductions from Asia to Italy and Europe (more precisely defined as Germany in the more detailed country
based analysis)1,12, of small clusters corresponding to ancestral B.1/19A isolates, characterized by the substitution
D614G in the spike protein in the absence of the P314L in the RdRp. A second introduction to Italy corresponded
to the largest B.1 cluster characterized by all the substitutions typical of 20A clade giving rise to smaller clusters
dispersed to other European and Asian countries and to a further large Italian cluster, corresponding to the
lineage B.1.1 which was then dispersed to Italy and to Europe at multiple times. The biggest European cluster
descending from B.1.1, corresponding to the lineage B.1.1.1, spread to Italy only in the second half of March.
The phylogeographic analysis based on the sampling countries suggested the important roles played from several
other European countries, in particular after the second week of March.
The major limitations of this study are intrinsic to the application of the phylogeographical approach to
SARS-CoV-2 due to the relatively low evolutionary rate of SARS-CoV-2 in comparison with other RNA viruses,
the limited number of sequences, available at the time of the study was performed, possibly affected by sam-
pling bias for the characters underrepresented in several countries, including Italy, in the early epidemic and
the rapid dissemination of the infection3. Furthermore, a frequent homoplasy13,14, that affects multiple protein
sites of the viral genome, and the founder effect played a dominant role in the early evolution of the v irus15,16.
For these reasons, a limited number of studies on the SARS-CoV-2 phylogeography have been published, based
on maximum p arsimony17, maximum likelihood and Bayesian f ramework3,18 or phylogenetic n etwork19. These
studies analysed a limited number of genomes available at the time in the short interval elapsed since the origin
of the v irus20 while others highlighted the importance of including travel-related information in the a nalysis18.
These limitations could be overcome by adding more sequences and increasing the signal, which would allow
to reduce biases and uncertainties. However, classical Bayesian phylogenetic methods, allowing the joint estima-
tion of tree topology with evolutionary parameters and the character state, is very computationally demanding
and time consuming; on the other hand, ML, based on ancestral character reconstruction, can be performed in
large trees with thousands of tips in a relatively short t ime21. Another limitation of the study is that travel-related
information was not available for all cases. Nevertheless, the absence of international travel among those for
whom the information was available is probably due to a low and scattered sampling density restricted mainly
to symptomatic patients and a prevalent circulation of the virus in small communities rather than in large cities,
during the first phase of the epidemic in Italy. It therefore emphasizes the importance of phylogeographic recon-
struction in attempting to formulate hypotheses on the possible flows of the virus in the international context.
In conclusion, a possible scenario was reconstructed by employing an ancestral character method allowing
the analysis of a large amount of data. Based on our reconstruction, initial multiple sporadic introductions
of B lineage to Italy occurred at least since the second half of January 2020 and remained relatively confined.
Subsequently, in the month of February the D614G mutant entered in North Italy rapidly spreading to the rest
of Italy and Europe, determining a different epidemiological profile of the Italian epidemic since then sustained
only by B.1 lineage and his descendants. B.1.1 apparently emerged from the Italian B.1 cluster, suggesting a local
evolution, lineage B.1.1.1 most probably emerged from B.1.1 in other European countries, and was introduced
in Piedmont after the Italian national lockdown. Overall, our data suggests a central role of Italy in the exporting
of some viral lineages at the beginning of the European epidemic, while subsequently, after mid-March, it was
an importing centre from other European countries. Future studies, employing all the isolates collected in the
early phases of the epidemic, many of which became available only after this study began, could provide more
information about the origin of the pandemic spread in Italy and Europe.
The introduction in Italy of the D614G variant with a greater transmissibility and its hidden circulation for
weeks before the detection of the first cases in Italy could be responsible for the rapid spread of the epidemic
in Northern Italy followed by spread to other Italian regions and possibly to the rest of Europe, similar to what
was observed for lineage B.1.7.7, firstly predominating in UK and, subsequently, in many other European (and
extra-European) countries (eCDC, rapid risk assessment, 15 February 2021).
Materials and methods
Specimen collection. Sequence and epidemiological data were collected at the centres participating to
the collaborative group SCIRE (SARS-CoV-2 Italian Research Enterprise), established at the beginning of the
pandemic. SARS-CoV-2 RNA positive samples were collected between 24th February to 18th June 2020 from
the respiratory tract of individuals who were either hospitalized or tested within screening programs. Samples
were collected in most Italian regions, including Apulia, Campania, Emilia Romagna, Lazio, Liguria, Lombardy,
Marche, Piedmont, Sardinia, Sicily, Tuscany, Umbria and Veneto. All participants gave the written informed
consent to the storage of their anonymised data in a protected database. All of the data used in this study were
previously anonymized as required by the Italian Data Protection Code (Legislative Decree 196/2003) and the
general authorizations issued by the Data Protection Authority. The study was approved by the Ethical Commit-
tee of the Sacco Hospital (Prot N. 0,012,266) and conducted in compliance with Good Clinical Practice guide-
lines and the Declaration of Helsinki.
Virus genome sequencing. SARS-CoV-2 RNA was extracted using the Kit QIAsymphony DSP Virus/
Pathogen Midi kit on the QIAsymphony automated platform (QIAGEN, Hilden, Germany) (n = 11), the
NucleoMag 96 Virus (Macherey–Nagel, Dueren, Germany) on automated KingFisher ml Magnetic Particle
Processors (Thermo Fisher Scientific, Waltham, MA, USA) (n = 44) and manually with QIAamp Viral RNA
Scientific Reports | (2022) 12:5736 | https://doi.org/10.1038/s41598-022-09738-0 9
Vol.:(0123456789)www.nature.com/scientificreports/
Mini Kit (QIAGEN, Hilden, Germany) (n = 137). Full genome sequences were obtained with different proto-
cols, by amplifying 26 fragments as previously described (n = 137)10 or by Ion AmpliSeq SARS-CoV-2 Research
Panel (Thermo Fisher Scientific, Waltham, Massachusetts, USA) (n = 11) or by CleanPlex SARS-CoV-2 Panel
(Paragon Genomics Inc, Hayward, CA, USA) (n = 44). Sequencing was performed on Illumina Miseq platform
for all samples except for 11 that were sequenced with Ion GeneStudioS5 System instrument. The results were
mapped and aligned to the reference genome obtained from GISAID (https://www.gisaid.org/, accession ID:
EPI_ISL_406800) using Geneious Prime software v. 9.1.5 (Biomatters, Auckland, New Zealand) (http://www.
geneious.com) or Torrent Suite v. 5.10.1 (Euformatics Oy, Espoo, Finland) or BWA-mem and rescued using
Samtools alignment/Map (Hinxton, UK) (v. 1.9).
SARS‑CoV‑2 data sets. A total of 254 genomes characterized by SCIRE group since the beginning of
the collaboration (192 of which sequenced for this study), were combined with all the SARS-CoV-2 genomes
collected between 29th January 2020 and 18th June 2020 available from Italy in the GISAID database (October
2020, Supplementary Table 1) to form the Italian data set (n = 465). Fourteen Chinese strains were added as
outgroup obtaining a global dataset of 479 sequences.
To place the Italian sequences in the context of the international COVID-19 pandemic, an additional dataset
was built including Chinese (n = 52) and European (n = 858) sequences collected in the same period. Due to the
large amount of European sequences available, we included at least 2 strains per country/week (Supplementary
Table 2 and Supplementary Fig. 6). Identical strains or those with more than 5% of gaps were excluded. For
countries with a limited number of sequences, all strains were included. Only sequences reporting a certain
sample collection were included. Consequently, the final dataset encompassed 1,375 sequences. SARS-CoV-2
sequences were aligned using MAFFT (https://m afft.c brc.j p/a lignm
ent/s erver/) and the alignment was manually
cropped using BioEdit v. 7.2.6.1 (https://bioedit.software.informer.com/).
Genetic distance. The MEGA X program was used to evaluate the genetic distance between and within Ital-
ian strains on full length genome, with variance estimation performed using 1,000 bootstrap replicates. Amino
acid changes were evaluated using MN908947 as the reference sequence (https://www.megasoftware.net/).
Phylogenetic analysis. SARS-CoV-2 sequences were classified using the Pangolin COVID-19 Lineage
Assigner tool v. 2.3.2 (last access 15 April 2021, https://pangolin.cog-uk.io/) and Nextclade v. 0.14.1 (https://
clades.nextstrain.org/). The maximum likelihood trees of the two data sets were estimated using IQ-TREE v.
1.6.12 (http://www.iqtree.org/), using the GTR + F + R4 (General time reversible + empirical base frequen-
cies + four number of categories) model selected by the program and 1,000 parametric bootstrap replicates for
nodes support. Phylogenetic dating was obtained by the least squares dating method (LSD2) implemented in
IQ-TREE with 100 replicates to obtain confidence intervals in node a ges22. The genome sequence hCoV-19/
Wuhan/WH04/2020|EPI_ISL_406801|2020-01-05 was used as an outgroup, as it falls in a basal position with
respect to the tree and it results within a reasonable estimate of the time of emergence (time to the most recent
common ancestor, tMRCA). Italian clusters (including more than 2 sequences) were identified in the ML tree by
Cluster Picker v.1.2.3 using 80% bootstrap support and a mean genetic distance of less than 0.3% as thresholds.
Epidemiological characteristics of the identified clusters were further investigated using Cluster Matcher v.1.2 23
which allows the identification of clusters meeting given criteria. The Italian dataset was also analysed by BEAST
v. 1.10 (https://beast.community/) in order to estimate the tMRCAs of the main clades. A previously estimated
evolutionary rate of 8 × 10⁻⁴ substitutions/site24 and the selected substitution model (GTR + I + G) were used
as priors. An exponential coalescent tree, with priors on population size and growth rate and an uncorrelated
relaxed molecular clock model with an underlying lognormal distribution were chosen. Two runs of 150 million
interactions were compared to assess convergence and then post-burnin samples pooled to summarize param-
eter estimates to obtain an effective samples sizes of at least 200. Finally, all trees were visualised in FigTree v.
1.4.4 (http://tree.bio.ed.ac.uk/software/figtree/).
Phylogeographic analysis with PastML. The phylogeography was reconstructed from the time-scaled
tree generated previously on the basis of annotated sampling location using PastML with maximum likelihood
marginal posterior probabilities approximation (MPPA) and Felsenstein 1981 (F81) model options (https://
pastml.pasteur.fr/). The PastML generated tree was visualized and edited using FigTree v.1.4.4 (http://tree.bio.
ed.ac.uk/software/figtree/).
astML21 to reconstruct the ancestral
Each taxon was assigned to its sampling locations character, and we used P
character states and their changes along the trees. We used the MPPA as prediction method (standard settings)
and added the character predicted by the joint reconstruction even if it was not selected by the Brier score
(option-forced_joint). Additionally, we repeated the PastML analysis for the SARS-CoV-2 lineages. Phylogeog-
raphycal reconstruction was conducted using both Italian and European datasets.
In order to avoid ambiguities in the root reconstruction and given that lineages B and B.1 represent mono-
phyletic groups we performed two independent ancestral state reconstructions: one for lineages B.1 and its
descendent lineages (B.1.1 and B.1.1.1) and one for lineage B. The same outgroup was used for both analysis
(EPI_ISL_406800).
Data availability
All consensus genomes are being submitted at the GISAID database (https://www.gisaid.org). All the files used
for the analyses are available upon request.
Scientific Reports | (2022) 12:5736 | https://doi.org/10.1038/s41598-022-09738-0 10
Vol:.(1234567890)www.nature.com/scientificreports/
Received: 29 July 2021; Accepted: 25 March 2022
References
1. Zehender, G. et al. Genomic characterization and phylogenetic analysis of SARS-COV-2 in Italy. J. Med. Virol. 92, 1637–1640
(2020).
2. Boehm, E. et al. Novel SARS-CoV-2 variants: The pandemics within the pandemic. Clin. Microbiol. Infect. 17, 00262–00267 (2021).
3. Worobey, M. et al. The emergence of SARS-CoV-2 in Europe and North America. Science 370, 564–570 (2020).
4. Rambaut, A. et al. Addendum: A dynamic nomenclature proposal for SARS-CoV-2 lineages to assist genomic epidemiology. Nat.
Microbiol. 6, 415 (2021).
5. Piras, G. et al. Early Diffusion of SARS-CoV-2 Infection in the Inner Area of the Italian Sardinia Island. Front. Microbiol. 11, 628194
(2020).
6. Alteri, C. et al. Genomic epidemiology of SARS-CoV-2 reveals multiple lineages and early spread of SARS-CoV-2 infections in
Lombardy, Italy. Nat. Commun. 12, 434 (2021).
7. Di Giallonardo, F. et al. Genomic epidemiology of the first wave of SARS-CoV-2 in Italy. Viruses 12, 1438 (2020).
8. Tang, X. et al. Evolutionary analysis and lineage designation of SARS-CoV-2 genomes. Sci. Bull. (Beijing) 6, 012 (2021).
9. Giovanetti, M. et al. SARS-CoV-2 shifting transmission dynamics and hidden reservoirs potentially limit efficacy of public health
interventions in Italy. Commun. Biol. 4, 489 (2021).
10. Lai, A. et al. Molecular tracing of SARS-CoV-2 in Italy in the first three months of the epidemic. Viruses 12, 25794 (2020).
11. Lavezzo, E. et al. Suppression of a SARS-CoV-2 outbreak in the Italian municipality of Vo’. Nature 584, 425–429 (2020).
12. Rothe, C. et al. Transmission of 2019-nCoV infection from an asymptomatic contact in Germany. N. Engl. J. Med. 382, 970–971
(2020).
13. Turakhia, Y. et al. Stability of SARS-CoV-2 phylogenies. PLoS Genet. 16, e1009175 (2020).
14. van Dorp, L. et al. Emergence of genomic diversity and recurrent mutations in SARS-CoV-2. Infect. Genet. Evol. 83, 104351 (2020).
15. Jones, L. R. & Manrique, J. M. Quantitative phylogenomic evidence reveals a spatially structured SARS-CoV-2 diversity. Virology
550, 70–77 (2020).
16. Díez-Fuertes, F. et al. A founder effect led early SARS-CoV-2 transmission in Spain. J. Virol. 95, 01583–11520 (2021).
17. Gómez-Carballa, A. et al. Phylogeography of SARS-CoV-2 pandemic in Spain: A story of multiple introductions, micro-geographic
stratification, founder effects, and super-spreaders. Zool. Res. 41, 605–620 (2020).
18. Lemey, P. et al. Accommodating individual travel history and unsampled diversity in Bayesian phylogeographic inference of SARS-
CoV-2. Nat. Commun. 11, 5110 (2020).
19. Forster, P., Forster, L., Renfrew, C. & Forster, M. Phylogenetic network analysis of SARS-CoV-2 genomes. Proc. Natl. Acad. Sci. U.
S. A. 117, 9241–9243 (2020).
20. Nabil, B., Sabrina, B. & Abdelhakim, B. Transmission route and introduction of pandemic SARS-CoV-2 between China, Italy, and
Spain. J. Med. Virol. 93, 564–568 (2021).
21. Ishikawa, S. A., Zhukova, A., Iwasaki, W. & Gascuel, O. A fast likelihood method to reconstruct and visualize ancestral scenarios.
Mol. Biol. Evol. 36, 2069–2085 (2019).
22. Minh, B. Q. et al. IQ-TREE 2: New models and efficient methods for phylogenetic inference in the genomic era. Mol. Biol. Evol.
37, 1530–1534 (2020).
23. Ragonnet-Cronin, M. et al. Automated analysis of phylogenetic clusters. BMC Bioinform. 14, 317 (2013).
24. Lai, A., Bergna, A., Acciarri, C., Galli, M. & Zehender, G. Early phylogenetic estimate of the effective reproduction number of
SARS-CoV-2. J. Med. Virol. 92, 675–679 (2020).
Acknowledgements
We acknowledge the authors and the originating and submitting laboratories of the GISAID sequences. The
research was conducted under a cooperative agreement between Università degli Studi di Milano—Medicina
del Lavoro e Clinica delle Malattie Infettive del Dipartimento di Scienze Biomediche e Cliniche "Luigi Sacco",
Intesa Sanpaolo and Intesa Sanpaolo Innovation Center.
Author contributions
M.G., A.C., S.M., V.G., B.B., M.C., V.F., E.V.R., G.A., L.S., G.B., C.S., D.F., F.C., A.O., R.S., S.B., G.N., C.M.M.,
M.A., L.M. and N.C. acquired the clinical samples. A.L., A.B., S.T., M.M., S.M., A.C., I.V., G.T., D.C., I.M., D.G.
and S.C. performed the sequencing data and optimized protocols. A.L., A.B., A.M. and G.Z. performed genome
alignment. A.L., A.B., A.M. and G.Z. performed the phylogenetic analyses. A.L., A.B. and G.Z. analysed and
interpreted data. A.L., A.B. and G.Z. wrote the manuscript. M.G., A.L., A.B. and G.Z. performed the conception
and design of the study. All authors reviewed and contributed to the final version of the manuscript. All authors
approved the submitted version.
Competing interests
The authors declare no competing interests.
Additional information
Supplementary Information The online version contains supplementary material available at https://doi.org/
10.1038/s41598-022-09738-0.
Correspondence and requests for materials should be addressed to G.Z.
Reprints and permissions information is available at www.nature.com/reprints.
Publisher’s note Springer Nature remains neutral with regard to jurisdictional claims in published maps and
institutional affiliations.
Scientific Reports | (2022) 12:5736 | https://doi.org/10.1038/s41598-022-09738-0 11
Vol.:(0123456789)www.nature.com/scientificreports/
Open Access This article is licensed under a Creative Commons Attribution 4.0 International
License, which permits use, sharing, adaptation, distribution and reproduction in any medium or
format, as long as you give appropriate credit to the original author(s) and the source, provide a link to the
Creative Commons licence, and indicate if changes were made. The images or other third party material in this
article are included in the article’s Creative Commons licence, unless indicated otherwise in a credit line to the
material. If material is not included in the article’s Creative Commons licence and your intended use is not
permitted by statutory regulation or exceeds the permitted use, you will need to obtain permission directly from
the copyright holder. To view a copy of this licence, visit http://creativecommons.org/licenses/by/4.0/.
© The Author(s) 2022
SCIRE-SARS-CoV-2 Italian Research Enterprise-Collaborative Group
Claudia Balotta1, Carla della Ventura1, Marco Schiuma1, Enrico Lavezzo3, Paolo Fontana29,
Luca Bianco30, Luigi Bertolotti30, Laura Manuto3, Marco Grazioli3, Federico Bianca3, Claudia
Del Vecchio3, Elisa Franchin3, Francesco Onelia3, Andrea Spitaleri31, Francesca Saluzzo31,
Giovanni Lorenzin31, Stefano Pongolini5, Erika Scaltriti5, Laura Soliani5, Patrizia Bagnarelli6,
Chiara Turchi6, Valerio Onofri6, Filomena Melchionda6, Adriano Tagliabracci6, Elisa Burdino7,
Maria Grazia Milia7, Patrizia Caligiuri8, Vanessa De Pace8, Valentina Ricucci8, Alexander
Domnich8, Simona Boccotti23, Leoni Maria Cristina9, Giuliana Lo Cascio9, Salvatore Rubino32,
Vincenzo Lai32, Giulia Rocca32, Rosalba Govoni32, Giuseppe Mancuso33, Roberta Campagna12,
Laura Mazzuti12, Giuseppe Oliveto12, Ombretta Turriziani12, Laura Campogiani13, Mirko
Compagno13, Luigi Coppola13, Angela Maria Antonia Crea13, Giuseppe De Simone13, Andrea
Di Lorenzo13, Ludovica Ferrari13, Marco Iannetta13, Vincenzo Malagnino13, Tiziana Mulas13,
Benedetta Rossi13, Ilaria Spalliera13, Simona Tedde13, Elisabetta Teti13, Pietro Vitale13, Marta
Zordan13, Eugenio Milano14, Antonella Lagioia14, Rosa Gallitelli15, Mario Starace16, Carmine
Minichini16, Alessia Di Fraia16, Maddalena Schioppa34, Rita Greco34, Anna Gidari17, Maurizio
Zazzi18, Filippo Dragoni18, Laura Li Puma19, Silvia Ronchiadin19, Luigi Ruggerone19 & Dario
Russignaga35
29
Research and Innovation Centre, Fondazione Edmund Mach, San Michele All’Adige, Trento, Italy. 30Department
of Veterinary Science, University of Studies of Torino, Turin, Italy. 31Emerging Bacterial Pathogens Unit IRCCS
Ospedale San Raffaele, Milan, Italy. 32Department of Biomedical Science, University of Sassari, Sassari, Italy.
33
Department of Human Pathology in Adulthood and Childhood “Gaetano Barresi” Division of Microbiology,
University of Messina, Messina, Italy. 34AORN S. Anna E S. Sebastiano Caserta, Caserta, Italy. 35Prevention and
Protection Service, INTESA s.p.a., Milan, Italy.
Scientific Reports | (2022) 12:5736 | https://doi.org/10.1038/s41598-022-09738-0 12
Vol:.(1234567890)You can also read