PIRATES COVE WATER PARK - EXPANSION FEASIBILITY STUDY - ADOPTION DRAFT: MARCH 2017 - City of Englewood
←
→
Page content transcription
If your browser does not render page correctly, please read the page content below
PIRATES COVE
WATER PARK
EXPANSION FEASIBILITY STUDY

ADOPTION DRAFT: MARCH 2017
PREPARED BY:
               Contact: George Deines
               10733 Sunset Office Drive
               Suite 400
               St. Louis, MO 63127
               314-894-1245
Table of Contents
Executive Summary ...................................................................................................................... 5
   Introduction .............................................................................................................................................. 5
   Options for Consideration ........................................................................................................................ 5
Section 1: Waterpark Trends ...................................................................................................... 9
   Capacity Holders ...................................................................................................................................... 9
   Design Considerations ............................................................................................................................ 11
   Schedules and Fees ................................................................................................................................. 12
   Future Waterpark Expectations ......................................................................................................... 12
   Marketing ............................................................................................................................................... 13
Section 2: Market Area Demographics ..................................................................................... 19
   Population ............................................................................................................................................... 20
   Income .................................................................................................................................................... 22
   Age Distribution ..................................................................................................................................... 24
   Weather................................................................................................................................................... 27
   Existing Facility...................................................................................................................................... 28
   Analysis of Pirate’s Cove Revenue/Expense .......................................................................................... 29
   Focus Groups .......................................................................................................................................... 30
Section 3: Area Provider Analysis ............................................................................................. 33
Section 4: Concepts ..................................................................................................................... 41
   Option 1: Boomerango Family Raft Ride ............................................................................................... 42
   Option 2: Four Lane Mat Racer Slide..................................................................................................... 44
   Option 3: Flying Saucer Tube Ride ........................................................................................................ 46
   Capacity .................................................................................................................................................. 47
   Phasing the Attractions ........................................................................................................................... 48
Section 5: Operations .................................................................................................................. 53
   Opinion of Revenue ................................................................................................................................ 54
   Opinion of Expenses............................................................................................................................... 56
   Operations Summary .............................................................................................................................. 58
Appendix A: Glossary of Terms & Abbreviations.................................................................. 59
Appendix B: General Limiting Conditions............................................................................... 61

                                                                                                                                                               3
Executive Summary
Introduction
The City of Englewood, Colorado, contracted Counsilman-Hunsaker and Logan Simpson to
develop an Aquatics Feasibility Study for a potential Pirate’s Cove Water Park expansion. This
study is based on extensive research through the following processes:
Needs Assessment
Community Outreach and Survey
Common Vocabulary, Vision
Evaluate Existing Area Providers
Life Cycle Analysis of Existing Facility
Research Area Demographics
Site Analysis
Facility Program and Space Requirements
Develop Schematic Design Options for Programming
Develop Project Cost Estimates
Operations and Business Plan
Opinion of Revenue
Opinion of Operating Expenses
Determine Cashflow
Sources of Funding
Options for Consideration
Three expansion concepts were developed for the city’s consideration. Each concept features:
Signature attraction
FlowRider addition
Climbing wall (in the existing competition pool)
Aquaplay 750 to replace the SCS
Replace the spraypad features
Addition of a group pavilion
Addition of cabanas
Enclosure for slide pumps
Heating for mechanical room
5
Option 1 Signature Attraction: Boomerango Family Raft Ride
Cost: $5,494,000

Option 2 Signature Attraction: Four Lane Mat Racer Slide
Cost: $5,356,000

Option 3 Signature Attraction: Flying Saucer Tube Ride
Cost: $5,838,000

6
Section 1:
Waterpark Trends

   Capacity Holders
   Design Considerations
   Schedules and Fees
   Future Waterpark Expectations
   Marketing

                                   7
Section 1: Waterpark Trends

The design of swimming pools throughout Englewood and the nation has changed markedly over
the several decades. For most of us who learned to swim in the environment of the rectangular
municipal pool, much of what is being built today represents a radical departure from our
historical standard. With the bar being set ever higher as rising expectations are fueled by fierce
competitors vying for discretionary leisure spending, stimulating waterparks have become the
norm not only for four and five-star hotels and resorts but increasingly for the municipal and
educational markets as well.

Rising and often sophisticated design standards supported by a greater range of products that
include exotic finishes—stone, artificial rockwork, trees, coral, decorative tiles—have made it
achievable to build ever more interesting and engaging facilities. These liquid escapes offer
imaginative pools with inspiring and sensitively designed environments that create a sense of
interest and intrigue as guests decipher what all there is to dive into, splash around in, or relax
by.

Expected in the hospitality industry and now being seen in public parks and aquatic centers, the
rise in waterscape ambience indicates a growing trend toward first-class aquatic experiences,
from high end resort to local community to university. Waterscape wonderlands, whether
adventurous for the young or rejuvenating for the not-so-young, provide hours of entertainment,
relaxation, and the experience of togetherness that create indelible memories in a world beyond
everyday lives.

  Water Chutes     Log Flume Ride      Wave Pool        Wet 'N Wild
    Chicago        6 Flags over TX     Decatur, AL      Orlando, FL
     1893               1963              1970             1977

Capacity Holders

Initially, waterslides were a free standing attraction. Then wave pools splashed onto the scene.
When wave pools and waterslides merged into a single complex, the waterpark was born.
Capacity became less of a problem since no single element was required to bear the load. In
addition to wave pools and waterslides, another popular capacity
holder wound its way into the waterpark, the lazy river. These
capacity holders serve as the hub of the waterpark and are a crucial
part of overall success.

Children’s Area
Sensitively designed environments for children can be vital to
attendance. Families with toddlers need to be accommodated in

                                                                                                  9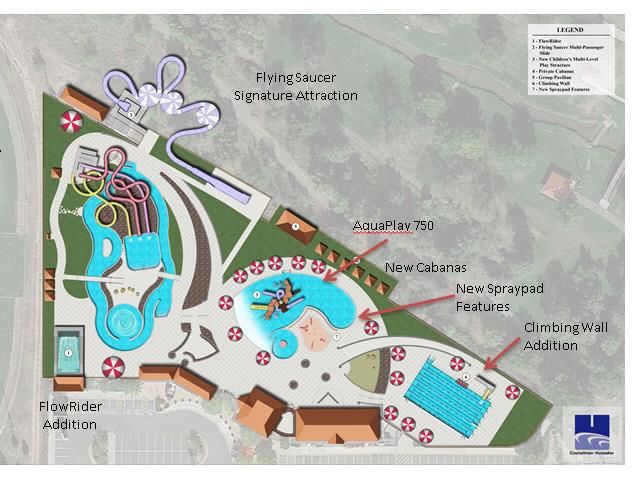
order for them to come to the park and spend the day together. Spraygrounds, tot pools, and
children’s pools with participatory play features with all sorts of pulleys, rope ladders, buckets,
geysers, and slides need to be located near the bathhouse for convenience purposes.

Rides/Signature Attractions
Teens like thrill rides while families like modest rides that most anyone can enjoy. These can be
a mix of body slides or tube slides, and should be both open and closed flumes to offer diversity.
Having a ride that allows multiple riders is another way of keeping the entire family happy. Big
tube slides that have three to four people per ride add to the social aspect. Having a head first mat
slide, where riders can race their friends, can provide a grand experience for young teens. In
general, the more thrilling the ride, the less people will ride due to age preference and/or height
restriction. The thrill ride can be the signature attraction that differentiates the park from the
competition, incorporating physical action and adventure that can have an impact on guests
returning to experience the thrill over and over again.

Examples:

Boomerango Family Raft Ride

Four Lane Mat Racer Slide

10
Flying Saucer Tube Ride

                           In addition to slides, large water play structures provide water play
                           gyms for the entire family. They can be themed as water jungles,
                           pirate coves, and rainforest temples to name a few. With slides,
                           waterfalls, and water features, families are entertained for hours while
                           experiencing physical fitness and family togetherness.

Artificial surfing is another “thrill” ride. These environments use high-
output pumps to produce a flow of water approximately two inches
thick over a fixed foam-padded surface. Competitions are formed and
spectators enjoy watching as much as “inland surfers” enjoy the
challenge. A climbing wall over the water offers the physical activity
and challenge of climbing while the water underneath cushions the fall.

Design Considerations

For outdoor waterparks, designers and engineers view existing site conditions as naturally
occurring pieces of art, so to speak, rather than approaching them as obstacles. Instead of
muscling their way into a site, designers test to determine if the selected amenities will fit the
space. Natural geographic elements can accentuate the organization of waterpark features. The
site can be balanced, a process that involves moving existing soil around rather than bringing in
more dirt or hauling it away. Before removing soils and natural formations, attempts must be
made to envision using the land contours for landscaping in and around the pools and attractions.
Such contours, for example, can accommodate serpentine sidewalks that create interesting and
intimate areas.

In providing for the triangulation of different activity zones, slope and contour play a dramatic
role. Triangulation creates synergy of spaces and also allows diverse age groups to have their
own zones by taking advantage of the natural topography. Zoning the facility involves a logical
progression throughout the site. Separate, intimate spaces are created according to different water
depths and appropriate age-group activities. The sun’s path is another physical consideration in
pool placement, as well as in the location of shade and social spaces for sunbathing. Since

                                                                                                 11
swimmers typically prefer sunlit water, shade structures and cabanas need to be strategically
placed. Existing trees can provide heat relief in picnic areas, while creating natural barriers to
wind.
Proper site design also includes providing for the efficient flow of support spaces, which ideally
are located out of sight, but within easy walking distance. Service vehicles require access to
support spaces for ease in delivering chemicals and in maintaining mechanical pumps and
motors. Site development also dictates compliance with ADA accessibility requirements
throughout the facility.
Landscaping and bathhouses can be used to provide a pleasing ambiance and to buffer the site
acoustically and visually. Increasingly, site design incorporates natural resources as valuable
amenities. Xeriscape, a concept involving the conservation of water through creative
landscaping, uses native plants (once established) that can thrive with little or no supplemental
watering.
Schedules and Fees
The local school schedule is an important factor in determining the operating schedule for a
waterpark to determine labor as well as attendance. The normal operating schedule for an
outdoor waterpark in Colorado typically consists of approximately 100 days per season from
June through August, with July, on average, capturing the most visits. Waterparks suffer from
lost attendance and staff in early June and late August, depending on the school schedule.
Ultimately, waterparks depend on repeat business to survive. An affordable experience, both in
terms of admission and spending, is a condition of entry, and it is important to charge what the
market will bear. The top rate is the general admission rate, which is usually charged to adults
over the age of 18. In addition to the general admission rate, there are a number of discounted
rates, including youth and senior general admissions, group rates, promotional rates, and season
passes for individuals and families. Per capita expenditure for all ticket sales is typically 70
percent of the general admission price. In order to analyze revenue, the following is an industry
evaluation of daily admissions, season pass memberships, and concession percentages.
General Admission 70%
Season Passes 25%
Food & Beverage 5%
Total 100%
Future Waterpark Expectations
To ensure that existing customers keep coming back and to get more customers through the
turnstiles, staying ahead of the trends impacts the recreation industry. Many waterparks feature
enough space for phased expansion to accommodate future community growth. As a community
grows, more individuals and groups will inevitably get involved in the planning of future outdoor
spaces and attractions.
12“Local” is the environmental buzzword when it comes to entertainment during economic
disruptions. A large part of aquatic expectations are the result of tourism whereby travelers have
seen what distant communities have in the form of public sector, affiliated with a hotel/resort,
part of a corporate chain, privately owned, or international aquatics, including European
communities.
Hotel/Resort Influence
• The hospitality industry has exploded in destination
aquatic environments that create indelible
memories.
• Experiences include a combination of tranquil and
exhilarating pools and attractions, relaxing spas,
exquisite poolside dining, and children’s programs.
• Attractions include infinity edge pools with
cascading waterfalls, hydrotherapy bubbling spas, caves, fountains, waterslides, and
adventure rides.
• Some designs blend with a spectacular geologic formation or a scenic region, while
others, such as Las Vegas and Orlando, create themed immersive environments where
guests can imagine they are in far-away locations.
European waterparks are beginning to offer more adult-oriented amenities. With lifetime
expectancy up 30 years in the U.S. since 1900, adults are strong advocates of well-being
pursuits, i.e., therapy pools, leisure pools, and lap swimming. Thus, European influence will
most likely be embraced in the U.S. in the near future.
European Influence
Schwaben Quellen, a large spa/waterpark complex located in Stuttgart, Germany, offers multiple
steam rooms, saunas, and themed shower experiences complete with special effects, sounds, and
aromatherapy, even rooms where guests can roll in the snow following the use of a sauna or
other type of steam room.
Wave-die Worgler Wasserwelten, Austria, offers concentrated body-warm (98.6) saline
baths enriched with salt from the Dead Sea, creating a weightless floating experience
with a play of colors and atmospheric underwater music, putting the guest in a state of
mental balance.
The addition of more adult amenities influences childcare activities so that mom and dad
can partake in revitalization, purification, and other well-being experiences. Inspired by
kids’ clubs on cruise ships and resorts, childcare activities engage in more supervised
events and dynamic aquatic activities.
Marketing
Many marketing efforts will focus on the sales budget, developing an easy and concise means of
explaining activities and fees to users, and creating a simple protocol for scheduling rentals and
other events. Branding refers to the summation of all the amenities—state-of-the-art facility,
attractions, and programming—in an eye-appealing package with a competitive advantage.
Strong aesthetic visuals include a cohesive logo, website, brochures, video spots, and staff
uniforms. Competitive advantages may include cross-generational multiplicity, daily admission
fees versus membership fees, cultural diversity, or perhaps the facility is the only championship
13venue in the region. For a loyal customer base, a great deal of marketing effort will be focused
on customer outreach.
Customer Outreach
Marketers understand their target market—a vital investment to success—by identifying
potential user groups while developing a clear message that explains how the aquatic center
expansion can fulfill their needs. Marketers define the identity and mission (sell the experience)
by branding around the core competencies of the facility. They continue to benchmark successful
recreation providers who are meeting the needs of a market segment and generating demand,
while finding what makes it work and determining what would make it better. Their single most
important ingredient is customer relationships (getting them and gaining their loyalty). Valuing
customers and their opinions gives users a sense of ownership and pride in the facility, a perfect
combination for continued word-of-mouth promotion. Customers are a source of innovative
ideas, thus marketers must:
Identify user groups and verify that the message of each marketing campaign is being
successfully communicated.
Ask for feedback through focus groups and surveys of programs while being open to
customers’ observations and suggestions to help build a network within the
community.
Evaluate customer feedback to measure how users and nonusers view the image of
the facility. Use the information to determine current levels of satisfaction, program
fulfillment, and future needs.
Make quantitative and qualitative improvements based on data (from what makes
programs and services successful) so that services are consistently high quality to
increase revenue.
Set objectives for improvement to increase market share.
Identify resources and means of implementation by listing key action plans and cycle
times.
Brand services with consistency; position each service to fit the market segment and
promote the benefit of the experience; people buy benefits.
Marketing Development Plan
Take time to address market conditions and challenges; define steps to solve the challenges and
improve all aspects of the event or program by using a marketing development plan. When
developing a special event or program, answer the following questions.
1. What is the current situation you are addressing?
2. What are the market conditions?
3. What are the objectives of this marketing plan?
4. What are the key elements you wish to implement?
5. What are the timelines for each element?
6. What resources will be used for this implementation?
(funds, staff, external support)
7. How will you measure the success of the plan?
Media and Community Relations
Traditional advertising such as program brochures, school flyers, visual displays, newspaper,
radio, and television can target specific campaigns. As a not-for-profit entity, various local media
14outlets represent a valuable opportunity for free or low-cost publicity. Develop public relation
contacts with local broadcast and print media by submitting articles or suggesting topics on the
aquatic center’s activities and services, including issues involving education and accident
prevention. The use of local celebrities, such as sports and radio personalities, can also help
promote events or sponsor organizations and outreach programs to local groups, including
girl/boy scouts, hospitals, retirement communities, and corporations. Such programs can be
tailored to the needs and interests of individual groups by focusing on wellness, safety, training,
competition, or recreation. Utilize small segmented promotions to create an individualized plan
for items of user interest, special events, and fun activities.
Corporate Sponsorship and Venue Signage
Shrinking funds and tightening budgets result in seeking opportunities to subsidize expenses of
construction and operation. Marketing opportunities look to local, regional, and even national
businesses for sponsorship and advertising signage. These opportunities can range from naming
the entire facility for an individual or commercial benefactor, to naming individual rooms,
benches, tiles, and so forth. Opportunities for revenue include selling permanent and temporary
venue signage.
Digital Marketing
Marketers widen the scope of multimedia plans through the increased use of on-demand media
such as online broadcasting and video spots, and utilizing email marketing. Marketing must
thrive in an exciting digital culture in order to grab and retain potential customers to positively
affect revenue, influence attendance, and promote sponsorships.
Embracing information sharing can prove to be a benefit to City business practices. These
inexpensive information sharing platforms are becoming more and more effective in direct
connection and building community. For example, You-Tube can be used as a free web host of
professional video tours of the facility as well as on-going training videos for staff. A Facebook
business page can be a free web host of amenities, hours of operation, and employee and
program scheduling with email access to “fans” regarding specials, coupons, and special events.
Twitter can quickly tweet cancelations or reminders for lessons, classes or programs to
followers.
Customer email addresses may be submitted when registering for memberships, classes, and
special events. With customer permission, marketers may use these email addresses for email
marketing campaigns of monthly newsletters and promotional messages regarding upcoming
events and classes.
Websurfers looking for exciting visual examples of recreation opportunities will stop and shop
cutting-edge websites that showcase the recreation portfolio in an outstanding way. Online photo
galleries and streaming video can demonstrate exciting swim meets, families playing in shallow
water, teens sliding down waterslides, and seniors swimming laps, thus allowing potential
customers to browse the facility without having to be on site. An immediate price quote offers a
means to sell rental opportunities for birthday parties, reunions, and corporate picnics. Voice-
overs can communicate classes, programs, drop-in activities, meets, and special events.
The face of fundraising is also enhanced by interactive media. When sent a video spot, potential
sponsors can witness a cohesive branding package accompanied by exciting video of an event,
showing crowds of people in attendance, and other sponsors’ booths.
15A study conducted by Media Life Research reveals that 63% of moviegoers are not opposed to onscreen commercials; 79% of U.S. theaters offer commercial spots before a movie. Onscreen ads can promote local recreation attractions to a receptive young demographic. Video spots of a thrilling aquatic center on a hot summer day can potentially reach thousands of people in one month. Other ways of utilizing video spots to help launch the new facility campaign include looping video spot DVDs on in-house TVs at the park and recreation headquarters, the county welcome center, the visitors’ bureau, and realtor offices to communicate to the community, visitors, and potential residents the creative recreation amenities that the community has to offer. 16
Section 2
Market Area Demographics

       Population
       Income
       Age Distribution
       Weather

                          17
Section 2: Market Area Demographics
Factors that can influence attendance include projections for growth/decline of population,
income levels, and age groups. Market studies are used to predict how relevant products,
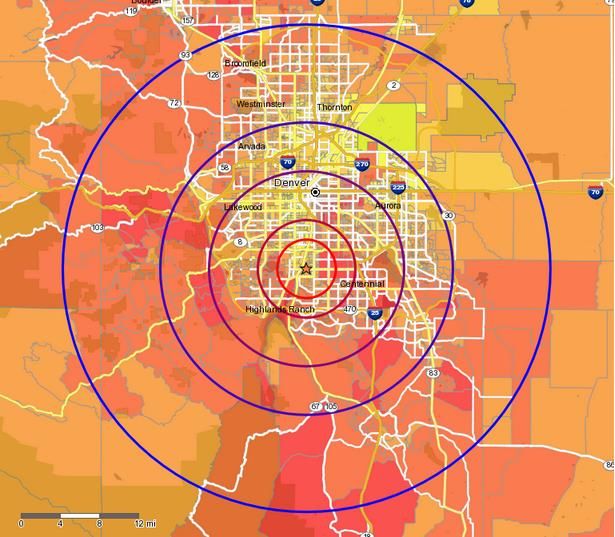
services, and fees are to residents. Originating from 1225 W. Belleview, Englewood, Colorado,
the primary area is assumed as 25 miles, and the service area is assumed as 5 miles. The
difference between “primary” (25-mile market area) and “service area” (5-mile market area) is
that waterpark users will customarily drive farther to use a facility than will community pool
users (about 5 miles). Thus, a study of demographic patterns in the area is helpful in projecting
usage rates. The resident market area has been divided into the following distances with the
description in parentheses being the standard type of aquatic facility that draws from that radius.
Distance From Site
0 to 3 Miles (Neighborhood Pool)
3 to 5 Miles (Community Pool)
5 to 10 Miles (Family Aquatic Center)
10 to 15 Miles (Regional Destination)
15 to 25 Miles (Large, Destination Waterpark)
Distance Map
19Population
The following chart presents a summary of market area population with concentric rings
surrounding 1225 W. Belleview, Englewood, Colorado. The 2010 U.S. Government Census was
used to estimate the population for 2015 and to make projections for 2020.
• The population base for the City of Englewood is projected to increase from 32,200
residents to 32,400 by 2020. While new housing units continue to be constructed in
Englewood, population growth remains fairly flat due to shrinking family size and the
conversion of single-family to multi-family units. An expansion of Pirates Cove can help
Englewood attract the young family demographic.
• Population is trending up in the 25-mile area.
2021
Englewood, CO
1225 W Belleview
MARKET AREA POPULATION BY DISTANCE
Population Average Annual Change
2010 2015 2020 2010-2015 2016-2020
Radius Number Percent Number Percent Number Percent Number Percent Number Percent
(000's) of Total (000's) of Total (000's) of Total (000's) Change (000's) Change
0 to 3 Miles 93.1 3.7% 99.9 3.7% 101.0 3.6% 1.4 1.4% 0.2 0.2%
3 to 5 Miles 183.7 7.3% 197.3 7.4% 200.5 7.1% 2.7 1.4% 0.6 0.3%
5 to 10 Miles 820.7 32.5% 891.6 33.3% 924.9 32.6% 14.2 1.7% 6.7 0.7%
Subtotal 1,097.5 43.4% 1,188.8 44.4% 1,226.3 43.2% 18.3 1.6% 7.5 0.6%
10 to 15 Miles 684.0 27.1% 746.9 27.9% 787.9 27.8% 12.6 1.8% 8.2 1.1%
15 to 25 Miles 744.7 29.5% 744.7 27.8% 824.1 29.0% 0.0 0.0% 15.9 2.0%
Subtotal 1,428.7 56.6% 1,491.6 55.6% 1,612.0 56.8% 12.6 0.9% 24.1 1.6%
Total (0-25 Miles) 2,526.2 100.0% 2,680.4 100.0% 2,838.3 100.0% 30.8 1.2% 31.6 1.2%
Englewood, CO 30.3 32.2 32.4 0.4 1.3% 0.0 0.1%
Source: AlteryxIncome
To a certain degree, the likelihood of residents to engage in aquatics depends on their ability to
pay for admission and program fees. In the following chart, the U.S. national average is set at
1.00. Index refers to the percentage higher or lower than the national average.
• Per capita income for the City of Englewood is 7% higher than the national average,
shown as an index of 1.0.
• Median household income for the City of Englewood is 15% lower than the national
average.
MARKET AREA INCOME
Radius Per Capita Incomes Median Household Incomes
Dollars Index Dollars Index
0 to 3 Miles $33,897 1.28 $51,669 0.98
3 to 5 Miles $40,488 1.53 $67,358 1.28
5 to 10 Miles $40,029 1.51 $61,357 1.17
10 to 15 Miles $30,375 1.15 $59,485 1.13
15 to 25 Miles $36,794 1.39 $78,309 1.49
Englewood, CO $28,351 1.07 $44,507 0.85
Total U.S. $26,464 1.00 $52,599 1.00
Source: Alteryx
22Map of Market Area Income
23Age Distribution
Age distribution is another population characteristic used to determine the type and level of use
of any type of program. The following table provides the number of residents and the percentage
of total population for each age group compared to the U.S. column, which identifies the national
average.
• Children ages 0-19 constitute 19.4% of the City of Englewood’s population compared to
the national average of 26.5%.
• Median age for the city is right at the national average (37.1 compared to 37.0
respectively).
2425
MARKET AREA AGE DISTRIBUTION
Age Groups 0 to 3 Miles 3 to 5 Miles 5 to 10 Miles 10 to 15 Miles 15 to 25 Miles Englewood, CO U.S. Age
# % # % # % # % # % # % Population
Age 0-4 5,774 5.8% 11,369 5.8% 54,119 6.1% 54,636 7.3% 51,471 6.9% 1,958 6.1% 6.5%
Age 5-9 5,701 5.7% 11,462 5.8% 53,933 6.0% 57,113 7.6% 58,758 7.9% 1,611 5.0% 6.5%
Age 10-14 5,722 5.7% 11,443 5.8% 50,970 5.7% 53,138 7.1% 59,139 7.9% 1,388 4.3% 6.6%
Age 15-19 5,308 5.3% 12,587 6.4% 45,730 5.1% 47,942 6.4% 49,649 6.7% 1,284 4.0% 6.9%
Subtotal 22,505 22.5% 46,861 23.7% 204,752 23.0% 212,829 28.5% 219,017 29.4% 6,241 19.4% 26.5%
Age 20-24 6,583 6.6% 13,100 6.6% 56,469 6.3% 48,579 6.5% 42,846 5.8% 2,300 7.1% 7.1%
Age 25-29 8,155 8.2% 15,777 8.0% 85,181 9.6% 55,813 7.5% 48,747 6.5% 3,235 10.0% 6.8%
Age 30-34 7,578 7.6% 14,039 7.1% 81,238 9.1% 59,716 8.0% 53,764 7.2% 3,202 9.9% 6.6%
Age 35-39 6,254 6.3% 12,085 6.1% 66,946 7.5% 55,513 7.4% 54,338 7.3% 2,510 7.8% 6.3%
Age 40-44 6,137 6.1% 12,655 6.4% 65,614 7.4% 55,736 7.5% 57,752 7.8% 2,110 6.6% 6.8%
Age 45-49 6,503 6.5% 12,314 6.2% 58,365 6.5% 50,497 6.8% 53,121 7.1% 2,188 6.8% 7.1%
Age 50-54 7,751 7.8% 14,321 7.3% 60,747 6.8% 51,429 6.9% 53,625 7.2% 2,471 7.7% 7.3%
Age 55-59 7,159 7.2% 14,076 7.1% 56,790 6.4% 45,913 6.1% 48,120 6.5% 2,207 6.9% 6.5%
Age 60-64 5,732 5.7% 12,389 6.3% 49,769 5.6% 36,571 4.9% 39,807 5.3% 1,597 5.0% 5.7%
Age 65-69 4,382 4.4% 9,621 4.9% 37,198 4.2% 26,524 3.6% 29,351 3.9% 1,151 3.6% 4.2%
Age 70-74 3,319 3.3% 6,535 3.3% 24,146 2.7% 17,618 2.4% 18,199 2.4% 812 2.5% 3.1%
Age 75-79 2,748 2.8% 4,826 2.4% 16,787 1.9% 12,149 1.6% 11,513 1.5% 621 1.9% 2.4%
Age 80-84 2,352 2.4% 4,148 2.1% 13,075 1.5% 9,064 1.2% 7,551 1.0% 609 1.9% 1.9%
Age 85+ 2,753 2.8% 4,592 2.3% 14,485 1.6% 8,942 1.2% 6,947 0.9% 944 2.9% 1.9%
TOTAL: 99,911 100.0% 197,339 100.0% 891,562 100.0% 746,893 100.0% 744,698 100.0% 32,198 100.0% 100%
Median Age 39.1 38.7 36.3 34.7 35.7 37.1 37.0
Source: AlteryxMap of Market Area Age Distribution 26
Weather
Given the sensitivity of aquatics to weather conditions, it is appropriate to include an assessment
of local weather patterns in the market analysis. The factors in the following chart from
Englewood, CO, weather data were used to determine user days in the financial models.
CLIMATOLOGICAL DATA
Temperatures Precipitation Precipitation
Month Average High Low Inches Days
January 30.5 45.8 15.3 0.5 4
February 33.3 48.7 18.1 0.5 4
March 38.6 53.9 23.3 1.2 6
April 46.6 62.0 31.3 1.8 7
May 56.3 72.0 40.6 2.6 9
June 66.2 83.1 49.3 2.0 8
July 72.3 89.5 55.1 2.4 9
August 70.2 87.0 53.5 1.9 8
September 61.8 78.9 44.8 1.3 6
October 50.9 67.7 34.0 1.1 4
November 38.5 54.0 23.2 1.0 5
December 32.4 47.5 17.3 0.5 4
Source: Weatherbase
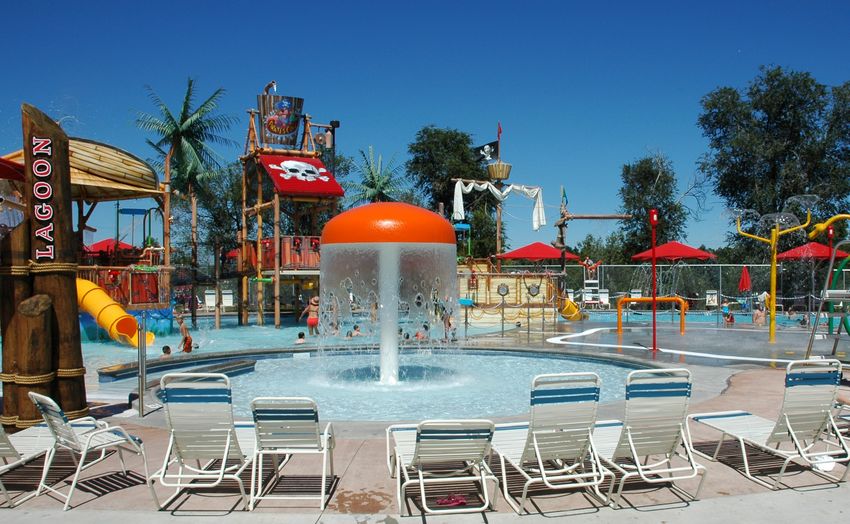
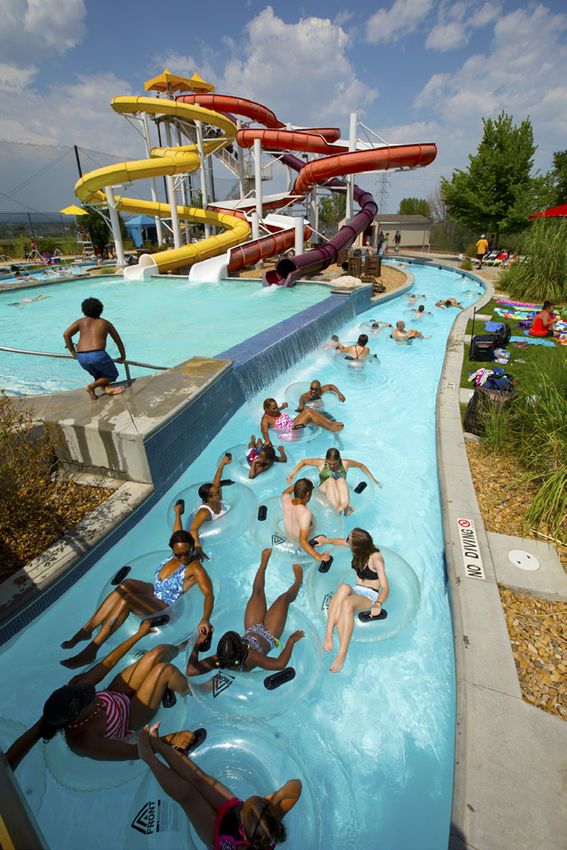
27Existing Facility Pirate’s Cove Water Park 1225 W. Belleview Englewood, Colorado Features Leisure Pool Dump Bucket Lazy River Three Waterslides Competition Pool Spray Pad Sand Play Area Programs Swim Lessons Birthday Parties Daily Admission Resident Age 2 -17: $6.75 Age 18-54: $7.75 Senior: $6.75 Daily Admission Nonresident Age 2 -17: $9.75 Age 18-54: $11 Senior: $9.75 Season Pass Resident Child/Senior: $104 Adult: $125 Family: $263 Season Pass Nonresident Child/Senior: $131 Adult: $157 Family: $329 28
Analysis of Pirate’s Cove Revenue/Expense

Pirate’s Cover Family Aquatic Center has a long history of recovering over 100% of its
operating expenses. Below is chart that shows the past 5 years of revenue vs. expenses for
Pirate’s Cove with a cost recovery from 120% to 145%. This cost recovery percentage includes
the expenses as detailed in the SD Scorecard process that is running concurrenty with the Pirate’s
Cove Feasibility and Expansion Study.

                                                                                                29
Focus Groups
City staff, Councilman-Hunsaker and Logan Simpson met with various community stakeholders
to gather information about what support spaces and features could be utilized if the waterpark
were to be expanded. Key themes included the following:
Support Spaces:
More storage
Better storage aesthetics
Pump pit for slides needs enclosure
Pavilion for 150
More cabanas
Renovate pirate
New lockers
Add room for expanded pro shop
Heated pump room
Explore enterprise fund for ongoing maintenance and repairs
New entry signage
Explore season pass pricing structure
Explore addition of turf areas
More rental/party areas
Extra concession areas
Expand lifeguard break area/first aid room
Features:
Explore family raft rides
Flowrider
Replace SCS structure
New spray features
Evaluate sand play area
Mat racer
Drop slide addition to competition pool
Kids’ slides
Lazy river entry
Climbing wall in competition pool
Concepts were shared with staff in a May 6 Concept Review Meeting. Comments received
included:
Place signature attraction on north side of fence line on backside of the park
Explore possibility of Proslide’s flying saucer attraction
Southwest corner is preferred placement for Flowrider
Pavilion placement in northwest corner
Maintain current turf areas and explore addition of more turf areas
30Section 3
Area Provider Analysis
Sunset Pool, Longmont
Eldorado Spring Pool
Bay Aquatic Park
Splash at Fossil Trace
Deer Creek Pool
Globeville Pool at Argo Park
City Park Pool, Thornton
Brighton Oasis
Highland Hills
31Section 3: Area Provider Analysis
The recreation industry is a competitive market vying for disposable income driven by
population trends, income levels, demographic profiles, and favorable locations. Large aquatic
centers and destination facilities offer a grand scale of cutting-edge amenities, deliver a unique
customer experience, and draw from a large radius. Small to medium aquatic centers compete by
offering family amenities in a cozy atmosphere, thus delivering a friendly customer experience to
the local market. The City of Englewood’s goal is not to compete for services, but to deliver high
quality programs at a reasonable cost. The following chart depicts the resident and non-resident
cost for the area aquatic facility providers listed below. While Pirate’s Cove is currently the
highest price family aquatic center for non-residents, it also offers the most play value through its
variety of aquatic amenities. Based on this data, in-park survey data that rated admissions prices
as inexpensive or reasonable, and the expansion of Pirate’s Cove to include a signature multi-
passenger slide attraction, a FlowRider, and renovated children’s area, the price could be raised
by $2-$4 as the new attractions are phased in over the course of the next several years.
Current Admission Prices of Area
Aquatic Facilities
331. Sunset Pool, Longmont
1900 Longs Peak Ave.
Longmont, CO
303-776-5823
Located next to Sunset Golf Course on a quiet street in Longmont, this public community pool has a view
of the snowcapped Indian Peaks.
Zero-depth entry pool
Two snaking waterslides
Three diving boards
Lap lanes
Sandy "beach”
Shelter rentals
Concession stand
Programs
Masters swimming
Water aerobics
Party rentals
Admission
Resident: $3.75-$5
Nonresident: $4.75-$6.25
2. Eldorado Springs Pool
294 Artesian Drive
Eldorado Springs, CO
303-499-9640
The water to this pool is fed directly from Eldorado's artesian spring. This historic pool has been a
popular spot since it opened in 1905.
Spring-fed pool
Waterslide
Diving board
Concessions
Programs
Swim lessons
Admission
Adults: $10
Children/Seniors: $7
343. Bay Aquatic Park, Broomfield
250 Lamar St.
Broomfield, CO
303-464-5520
Leisure pool with zero-depth entry
Two serpentine waterslides
Interactive water-play structure
Inner-tube slide
Otter slides
Sprayground
Tot pool with waterfall
Programs
Swim lessons
Water aerobics
Birthday parties
Admission
Resident: $4
Nonresident: $8
4. The Splash at Fossil Trace, Golden
3151 Illinois St.
Golden, CO
303-277-8700
Built in 2002, this aquatic park features:
Leisure pool
Two body- and tube-riding slides
Fountain features
Large wading area
500-gallon dump bucket
"Beach-like" sand area for toddlers
Geyser sprayer
25-meter eight lane lap pool
Racing blocks
Diving board
Concessions
Funbrellas
Programs
Birthday parties
Private rentals
Admission
Residents: $3.50-$7
Nonresidents: $4.50-$9
355. Deer Creek Pool, Littleton
8637 S. Garrison St.
Littleton, CO
720-981-8393
Perfect for the 0-14 age group, this pool is 4 foot 6 at its deepest.
Zero-depth entry pool
Fountain features
Waterslide
Lap lanes
Concessions
Shade pavilions
Programs
Swim lessons
Birthday parties
Admission
$5-$7
6. Globeville Pool at Argo Park
4700 Logan St.
Denver, CO
303-292-2358
Zero-depth entry pool
Waterslide
Two lap lanes
Geyser fountain
Programs
Swim lessons
Water aerobics
Admission
Adults: $3
Children: $1
367. City Park Pool, Thornton
2141 E. 95th Ave.
Thornton, CO
303-538-7318
Renovated in 2004, City Park Pool in Thornton is a public water park that features:
Zero-depth entry pool
Lap lanes
Lazy river
300-gallon water-dump bucket
Two twisting waterslides — one for speed and one for
tubing
Tot area with colorful water features
Shade tents
Vending machines
Programs
Swim lessons
Birthday parties
Admission
Resident: $3.50
Nonresident: $4.75
8. Brighton Oasis Family Aquatic Park
1852 E Bromley Ln.
Brighton, CO 80601
303-655-2095
Leisure pool
Waterslides
Lazy river
Climbing wall
Party pavilions
Programs
Swim lessons
Swim team
Lifeguard lessons
Admission
Resident: $2.50-$4.50
Nonresident: $3.50-$6.75
9. Hyland Hills Water Park
378801 Pecos St.
Federal Heights, CO 80260
303-427-7873
Opened in 1979, Hyland Hills Water Park features:
Wave pools
Lazy rivers
Waterslides
Water coasters
White water raft rides
Tot area
Admission
General daily admission: $42
38Section 4
Concepts
Option 1
Option 2
Option 3
39Section 4: Concepts
Three concepts were developed for the City of Englewood’s consideration. Each concept
features
Signature attraction
FlowRider addition
Climbing wall (in the existing competition pool)
Aquaplay 750 to replace the SCS
Replace the spraypad features
Addition of a group pavilion
Addition of cabanas
Enclosure for slide pumps
Heating for mechanical room
41Option 1: Boomerango Family Raft Ride Cost: $5,494,000 42
43
Option 2: Four Lane Mat Racer Slide

Cost: $5,356,000

44
45
Option 3: Flying Saucer Tube Ride

Cost: $5,838,000

46
Capacity

The following is a chart that details the hourly capacity of the Boomerango, Mat Racer, Flying
Saucer and FlowRider.

                                                                                                 47
Phasing the Attractions
No matter how many amenities there are, over time people enjoy experiencing something new.
To generate additional excitement, a new ride or amenity every two to three years is about the
norm, especially when meeting the needs of an underserved group. Expansion keeps momentum
high and if attractions are added for age groups who have been previously neglected, new
segments of the population are attracted. Attendance typically increases as amenities become
more diverse and exciting. When master planning a facility, phasing in new features every few
years keeps community interest at an elevated level.
At most waterparks, Saturdays are typically at capacity, but during the week there might be a
fraction of that attendance. Finding ways to improve attendance Monday through Friday can be a
challenge, but possible. For example, a FlowRider might bring in a lot of surfers and spectators
as competitions are formed. The facility might even host the FlowRider Competitive Circuit,
which was established for existing FlowRider locations worldwide.
Phasing Option #1 - Signature Attraction (Mat Racer)
OPINION OF PROJECT COST: Option 1 - Mat Racer
Description Unit Amount Cost per Unit Opinion of Cost Opinion of Cost
Addition 7 114,286 $800,000 $800,000
Mat Racer Quantity 1 700,000 $700,000
Mechanical Area Allowance 1 100,000 $100,000
Support 574 $157,961 $157,961
Pool Deck Sq. Ft. 15,000 7 $105,000
Fencing Sq. Ft. 122 65 $7,961
Overhead Lighting Sq. Ft. 15,000 3 $45,000
Subtotal 957,961 957,961
Site Construction Costs ( landscaping, utilities, walks) $300,000 $300,000
Subtotal $1,257,961 $1,257,961
Inflation (1 year) 5.0% $62,898 $62,898
Contingency 10.0% $132,086 $132,086
Indirect Costs 10.0% $145,294 $145,294
Opinion of Probable Cost $1,598,239 $1,598,239
Total Estimated Project Costs: $1,598,239 $1,598,239
Say $1,599,000 $1,599,000
Source: Counsilman-Hunsaker
48Phasing Option #2 – FlowRider
OPINION OF PROJECT COST: Option 2 - FlowRider
Description Unit Amount Cost per Unit Opinion of Cost Opinion of Cost
Addition 8 162,500 $1,300,000 $1,300,000
FlowRider Quantity 1 1,300,000 $1,300,000
Support 574 $22,907 $22,907
Pool Deck Sq.Ft 2,000 7 $14,000
Fencing Sq.Ft 45 65 $2,907
Overhead Lighting Sq.Ft 2,000 3 $6,000
Subtotal 1,322,907 1,322,907
Site Construction Costs ( landscaping, utilities, walks) $50,000 $50,000
Subtotal $1,372,907 $1,372,907
Inflation (1 year) 5.0% $68,645 $68,645
Contingency 10.0% $144,155 $144,155
Indirect Costs 10.0% $158,571 $158,571
Opinion of Probable Cost $1,744,278 $1,744,278
Total Estimated Project Costs: $1,744,278 $1,744,278
Say $1,745,000 $1,745,000
Source: Counsilman-Hunsaker
49Phasing Option #3 – Children’s Area, Climbing Wall, Pavilion Deck
Attendance Impact of Phasing Options
The following chart details the impact of attendance on the three different phasing options. The
biggest impact on attendance and revenue to implement in Phase 1 is the Mat Racer Slide.
Phasing Option #1 Phasing Option #2 Phasing Option #3
Mat Racer FlowRider Children’s Area
Impact on HIGH MEDIUM LOW
Attendance 10,000+ 2,500 – 5,000 Under 2,500
50Section 5
Operations
Opinion of Revenue
Opinion of Expenses
Operations Summary
Funding Options
51Section 5: Operations
Revenue analysis includes special user group usage and facility per capita spending trends, thus
developing an opinion of revenue for the next five years of operation. Recreation programming
revenue is based on user groups and local programming fees. Fee structure is based on fees from
members and other users to project per capita income. Revenue is estimated, taking
recommended fee schedules into account. All revenue assumptions reflect multiplying
attendance by per capita and adding special user group income.
Expense analysis includes a detailed budget model for estimating probable expenses for major
areas of labor, contractual services, commodities, and utilities. User projections are made based
on programming. Expenses are estimated, taking into account hours of operation, attendance
projections, local weather patterns, local utility rates, and other key items. Operating data from
other facilities in the area were reviewed and taken into account to form projections.
53Opinion of Revenue
Programming
Any program schedule will require flexibility to adapt to specific needs of the community. It is
the responsibility of the aquatic supervisor to monitor user group demands and adjust schedules
accordingly. Revenue projections are based on marketing programming that would include the
following programs:
Aquatics Instruction Revenue
FlowRider Lessons
Rentals
Birthday Party/Cabana Rentals
The following table assumes details the revenue, expenses and “net” income for the above
programming options.
Aquatics Programs Revenue & Expenses
Price Per Session (8) Total Per Session No. Sellable
Revenue Mgmt. Assump. Year 1 Year 1 Sessions Year 1
Aquatics Instruction Revenue
FlowRider Lessons 8 classes/session $60 50 1 $3,000
Rentals
Cabanas $/Full Day Rental $85 255 0.75 $16,256
Area Revenue $19,256
Expense Mgmt Assump. Year 1
Program Supplies 4% of year 1 gross revenue; 3% annual increase $770
Marketing 5% of year 1 gross revenue $963
Part-Time Program Staff 50% of gross $1,500
Area Expense $3,233
Net Revenue $16,023
54Admission Fees
In order to project revenue, fee schedules have been established. Three general approaches to
evaluating the fee structure of an aquatic center include the following:
1. Maximize revenue by charging what the market will support. Programs and facilities
operate with positive cash flow. If excess funds are available at season’s end, they can be
used to support under-funded programs.
2. Break-even in the operation of the facility. This approach is increasing in popularity as
funding is becoming limited to organizations that use the facility. Capital funds are used
to create the facility; operational funds are generated from the user on a break-even basis.
3. Subsidy pricing historically has been the policy of many community facilities.
A critical component of an enterprise fund management protocol is the revenue and pricing
policy. The revenue projections are based on Pirate’s Cove current, average per capita
expenditure of $10.91 per guest.
55The following table takes into consideration the revenue streams from special user group and
general attendance, resulting in an opinion of revenue for each option.
2016 2017 2018 2019 2020
Attendance
Option 1: Boomerango 23,394 23,532 23,654 23,792 23,930
Option 2: Mat Racer 23,167 23,304 23,425 23,561 23,698
Option 3: Flying Saucer 23,372 23,510 23,631 23,769 23,907
Per Capita Spending (3% Annual Increase)
Option 1: Boomerango $10.91 $11.23 $11.57 $11.92 $12.27
Option 2: Mat Racer $10.91 $11.23 $11.57 $11.92 $12.27
Option 3: Flying Saucer $10.91 $11.23 $11.57 $11.92 $12.27
Aquatic Programming Revenue
Option 1: Boomerango $16,023 $16,146 $17,025 $17,099 $18,036
Option 2: Mat Racer $16,023 $16,146 $17,835 $17,913 $18,895
Option 3: Flying Saucer $16,023 $16,146 $17,835 $17,913 $18,895
Total Revenue (Gross)
Option 1: Boomerango $271,139 $280,466 $290,683 $300,612 $311,748
Option 2: Mat Racer $268,662 $277,900 $288,836 $298,673 $309,755
Option 3: Flying Saucer $270,892 $280,209 $291,228 $301,151 $312,322
Opinion of Expenses
Commodities
Commodities are day-to-day products used to operate aquatic centers. Office supplies, program
supplies, custodial supplies, repair supplies, and chemicals are included. In determining annual
chemical expense, chemical treatment assumes the use of calcium hypochlorite and muriatic acid
(pH buffer). Chemical use can depend on bather load and chemical balance of the water. In
estimating annual costs, medium bather load figures are assumed.
Heating/Dehumidification
In determining utility costs, current energy costs at other facilities in the area were reviewed.
Total costs include energy, energy demand, and delivery charges. Caution must be used when
comparing this cost with operating expenses of other facilities across the country.
Electricity
The calculations are based on 2016 utility rate information. A figure of $0.051 cents per kWh
was estimated, including both demand and energy costs.
Water and Sewer
Water and sewer services will be needed for domestic use and compensation for evaporation and
backwashing purposes. Backwash water and domestic water will be released to the sanitary
system. This does not include landscape irrigation.
Insurance
Insurance denotes liability for more people and more structure based on visits and labor.
56Capital Replacement Fund
The manufacturers of some types of mechanical equipment recommend annual maintenance
programs to ensure proper performance of their equipment. Much of this work will be performed
by outside contractors. In addition, for daily operation of the facility, miscellaneous items will
need to be repaired by outside firms. The capital replacement fund sets money aside for
repairs/replacement.
Facility Staff
Projected annual payroll expenses are listed by summer and winter classifications reflecting
benefits and taxes. Scheduling employees is determined by programming demand and
management procedure. Wherever possible, pay rates were determined by local job
classifications and wage scales. Cost for swim instructors and other employees associated with
program income were factored in as cost against net programming revenue.
The following table shows an opinion of expenses for each option.
2016 2017 2018 2019 2020
Direct Facility Expenses
Option 1: Boomerango 142,048 145,599 149,239 152,970 156,795
Option 2: Mat Racer 134,700 138,068 141,520 145,058 148,684
Option 3: Flying Saucer 146,127 149,780 153,525 157,363 161,297
Aquatic Programming Expenses
Option 1: Boomerango $3,233 $3,410 $3,683 $3,790 $4,098
Option 2: Mat Racer $3,233 $3,410 $3,858 $3,971 $4,293
Option 3: Flying Saucer $3,233 $3,410 $3,858 $3,971 $4,293
Total Operating Expenses
Option 1: Boomerango $145,281 $149,009 $152,922 $156,760 $160,892
Option 2: Mat Racer $137,933 $141,478 $145,378 $149,028 $152,977
Option 3: Flying Saucer $149,360 $153,190 $157,383 $161,333 $165,590
57Operations Summary
The following chart provides a “recapture rate” to define the percentage of operating expenses
recuperated or recaptured by operating revenue. The debt service assumption is based on a
repayment timeline of the total project cost at a rate of 5% over 20 years. While the annual
operational budget for the expansion creates a positive cash flow, it does not create enough
revenue to pay 100% of the debt service for the expansion.
2016 2017 2018 2019 2020
Option 1: Boomerango
Project Cost $5,493,515
Attendance 23,394
Revenue $271,139 $280,466 $290,683 $300,612 $311,748
Expense $145,281 $149,009 $152,922 $156,760 $160,892
Operating Cashflow $125,858 $131,457 $137,761 $143,851 $150,856
Recapture Rate 187% 188% 190% 192% 194%
Capital Replacement Fund $27,500 $27,500 $27,500 $27,500 $27,500
Debt Service ($422,320) ($422,320) ($422,320) ($422,320) ($422,320)
Cash Flow ($323,962) ($318,364) ($312,060) ($305,969) ($298,965)
Option 2: Mat Racer
Project Cost $5,355,030
Attendance 23,167
Revenue $268,662 $277,900 $288,836 $298,673 $309,755
Expense $137,933 $141,478 $145,378 $149,028 $152,977
Operating Cashflow $130,729 $136,422 $143,459 $149,645 $156,778
Recapture Rate 195% 196% 199% 200% 202%
Capital Replacement Fund $26,800 $26,800 $26,800 $26,800 $26,800
Debt Service ($411,674) ($411,674) ($411,674) ($411,674) ($411,674)
Cash Flow ($307,745) ($302,052) ($295,015) ($288,829) ($281,696)
Option 3: Flying Saucer
Project Cost $5,837,820
Attendance 23,372
Revenue $270,892 $280,209 $291,228 $301,151 $312,322
Expense $149,360 $153,190 $157,383 $161,333 $165,590
Operating Cashflow $121,532 $127,019 $133,845 $139,817 $146,732
Recapture Rate 181% 183% 185% 187% 189%
Capital Replacement Fund $29,200 $29,200 $29,200 $29,200 $29,200
Debt Service ($448,789) ($448,789) ($448,789) ($448,789) ($448,789)
Cash Flow ($356,458) ($350,970) ($344,144) ($338,172) ($331,257)
58Appendix A: Glossary of Terms & Abbreviations
A Baby Boomers: An increased number of
ADA: Americans with Disabilities Act. people born between 1946 and 1964.
Under Title III, no individual may be
discriminated against on the basis of Bathhouse: A building with restrooms,
disability with regards to the full and equal showers, family changing rooms, locker
enjoyment of the goods, services, facilities, rooms, concessions, supplies, and
or accommodations of any place of public equipment.
accommodation by any person who owns,
leases (or leases to), or operates a place of C
public accommodation. Census Tract: A small, permanent
subdivision of a county with homogeneous
Age Distribution: Using the 2000 Census, population characteristics, status, and living
numbers and percentages are available by conditions.
census tract showing different age groups,
thus providing a median age. Competition Community: Athletes,
coaches, trainers, etc. who work to compete
Aquatic: Of or pertaining to water. in aquatics.
Aquatic Design: Detailed drawings of pool Competition Venue: Facility capable of
shells, pool structures, pool filtration hosting aquatics with regulation sized pools,
systems, and other equipment for new or spectator seating, etc.
soon-to-be renovated swimming facilities.
CPR: Cardiopulmonary Resuscitation is an
Aquatic Center/Facility: A place designed emergency medical procedure for a victim
for fitness swimming, recreation swimming, of cardiac or respiratory arrest.
swim lessons, and water therapy programs.
D
Aquatic Exercise Association: A not-for- Demographics: Selected population
profit educational organization committed to characteristics taken from publicly available
the advancement of aquatic fitness data to determine shifting trends used in
worldwide. marketing. 16
Aquatic Providers: Facilities offering Disposable Income: Income available for
aquatics. saving or spending after taxes.
Aquatic Therapy: Health-oriented water F
programs for arthritis, obesity, surgery Facility Audit: Report that identifies areas
recovery, athletic injuries, meditation, etc. for extending life expectancy and/or
improving operational efficiency of existing
Aquatics: Water sports, including pools and natatoriums.
swimming, diving, water polo, synchronized
swimming, etc. Feasibility Study: Business plan with
concept designs and project and operating
B
59costs for a proposed aquatic or sports significance of making parks, open space,
recreation facility. and recreational opportunities available to
all Americans.
Fitness Community: People engaged in
water exercise with related devices and P
equipment for water-based exercise options. Per Capita Income: Average obtained by
dividing Total Income by Total Population.
H
HVAC/DH System: Heating, ventilating, Pro Forma: Projected cash flow in a
air conditioning / dehumidification structure business plan.
for a natatorium.
R
L Recreation Community: People engaged in
Leisure Industry: Entertainment, the fun and leisure of swimming.
recreation, and tourism related products and
services. T
Therapy Community: People engaged in
Leisure Pools: Free-form pools that include rehabilitation performed in water involving
fun attractions such as waterslides and play exercise and motion in the presence of an
features. aquatic therapist.
Lessons Community: People engaged in Therapy Pool: Pool with warm water
swim lessons, drown proofing, lifesaving, usually between 87 - 92 degrees Fahrenheit
lifeguarding, and CPR instruction. used for aquatic therapy.
M Trends: The general course or prevailing
Median Age: This measure divides the age tendency of a market.
distribution into two equal parts: one half of
the cases falling below the median value and U
one-half above the value.
United States Masters Swimming:
Median Household Income: Income of the National organization that provides
householder and all other persons 15 years organized aquatic workouts, competitions,
old and over in the household. Median clinics, and workshops for adults 18+.
represents the middle of the income in a
demographic location, dividing the income W
distribution into two equal parts, one having Waterpark: Destination-oriented facility
income above the median and the other that draws patrons from greater than 25
having income below the median. miles.
Mosaic Types: Population classifications in
terms of socio-demographics, lifestyles,
culture, and behavior.
N
National Recreation and Parks
Association: The voice advocating the
60You can also read