Plasma markers predict changes in amyloid, tau, atrophy and cognition in non-demented subjects
←
→
Page content transcription
If your browser does not render page correctly, please read the page content below
doi:10.1093/brain/awab163                                                                                   BRAIN 2021: 144; 2826–2836             | 2826

Plasma markers predict changes in amyloid,
tau, atrophy and cognition in non-demented
subjects

                                                                                                                                                               Downloaded from https://academic.oup.com/brain/article/144/9/2826/6291241 by guest on 24 October 2021
 Joana B. Pereira,1,2 Shorena Janelidze,1 Erik Stomrud,1,3 Sebastian Palmqvist,1,3
 Danielle van Westen,4,5 Jeffrey L. Dage,6 Niklas Mattsson-Carlgren1,7,8 and
Oskar Hansson1,3

It is currently unclear whether plasma biomarkers can be used as independent prognostic tools to predict changes
associated with early Alzheimer’s disease.
In this study, we sought to address this question by assessing whether plasma biomarkers can predict changes in
amyloid load, tau accumulation, brain atrophy and cognition in non-demented individuals. To achieve this,
plasma amyloid-b 42/40 (Ab42/40), phosphorylated-tau181, phosphorylated-tau217 and neurofilament light were
determined in 159 non-demented individuals, 123 patients with Alzheimer’s disease dementia and 35
patients with a non-Alzheimer’s dementia from the Swedish BioFINDER-2 study, who underwent longitudinal
amyloid (18F-flutemetamol) and tau (18F-RO948) PET, structural MRI (T1-weighted) and cognitive testing.
Our univariate linear mixed effect models showed there were several significant associations between the plasma
biomarkers with imaging and cognitive measures. However, when all biomarkers were included in the same multi-
variate linear mixed effect models, we found that increased longitudinal amyloid-PET signals were independently
predicted by low baseline plasma Ab42/40 (P = 0.012), whereas increased tau-PET signals, brain atrophy and worse
cognition were independently predicted by high plasma phosphorylated-tau217 (P 5 0.004). These biomarkers per-
formed equally well or better than the corresponding biomarkers measured in the CSF. In addition, they showed a
similar performance to binary plasma biomarker values defined using the Youden index, which can be more easily
implemented in the clinic. In addition, plasma Ab42/40 and phosphorylated-tau217 did not predict longitudinal
changes in patients with a non-Alzheimer’s neurodegenerative disorder.
In conclusion, our findings indicate that plasma Ab42/40 and phosphorylated-tau217 could be useful in clinical
practice, research and drug development as prognostic markers of future Alzheimer’s disease pathology.

1 Clinical Memory Research Unit, Department of Clinical Sciences, Lund University, SE-20502 Malmö, Sweden
2 Division of Clinical Geriatrics, Department of Neurobiology, Care Sciences and Society, Karolinska Institute, 141 83
  Huddinge, Sweden
3 Memory Clinic, Skåne University Hospital, 214 28 Malmö, Sweden
4 Diagnostic Radiology, Department of Clinical Sciences Lund, Lund University, 221 85 Lund, Sweden
5 Image and Function, Skåne University Hospital, Malmö 205 02, Sweden
6 Eli Lilly and Company, Indianapolis, IN 46225, USA
7 Department of Neurology, Skåne University Hospital, Lund University, 221 84 Lund, Sweden
8 Wallenberg Center for Molecular Medicine, Lund University, 221 84 Lund, Sweden

Received December 04, 2020. Revised March 26, 2021. Accepted April 02, 2021. Advance access publication June 2, 2021
C The Author(s) (2021). Published by Oxford University Press on behalf of the Guarantors of Brain.
V
This is an Open Access article distributed under the terms of the Creative Commons Attribution-NonCommercial License (https://creativecommons.org/licenses/
by-nc/4.0/), which permits non-commercial re-use, distribution, and reproduction in any medium, provided the original work is properly cited. For commercial
re-use, please contact journals.permissions@oup.com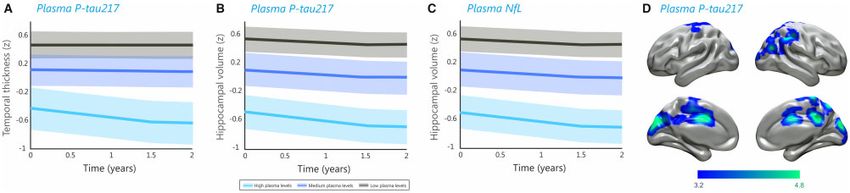
Plasma markers predict AD changes                                                               BRAIN 2021: 144; 2826–2836          | 2827

Correspondence to: Joana B. Pereira
Division of Clinical Geriatrics
Department of Neurobiology, Care Sciences and Society
Karolinska Institute, 141 83 Huddinge, Sweden
E-mail: joana.pereira@ki.se
Correspondence may also be addressed to: Oskar Hansson
Clinical Memory Research Unit, Department of Clinical Sciences
Lund University, SE-20502 Malmö, Sweden
E-mail: oskar.Hansson@med.lu.se

Keywords: plasma biomarkers; amyloid-b PET; tau PET; MRI; cognition
Abbreviations: AIC = Akaike information criterion; Ab42/40 = amyloid-b 42/40; MMSE = Mini-Mental State Examination;
NfL = neurofilament light; P-tau = phosphorylated tau; SUVR = standardized uptake value ratio

                                                                                                                                                 Downloaded from https://academic.oup.com/brain/article/144/9/2826/6291241 by guest on 24 October 2021
Introduction                                                           benefit from future disease-modifying therapies if their increased
                                                                       risk of developing the disease can be identified in advance.19
There is growing recognition that the pathophysiology of                   To answer this question, in this study we examined individuals
Alzheimer’s disease is a highly complex and dynamic process, be-       with baseline plasma Ab42/40, P-tau181, P-tau217 and NfL, in add-
ginning with the early accumulation of amyloid-b, followed by tau      ition to longitudinal amyloid-PET, tau, structural MRI and cognitive
deposition and neurodegeneration.1 These pathological changes          measures. Our main goal was to determine which of these plasma
can be detected in vivo using CSF analyses, PET and MRI. However,      biomarkers was the best independent predictor of future imaging
despite being clinically useful, these techniques are invasive, ex-    and cognitive changes in non-demented individuals. Moreover, we
pensive or time-consuming, which limits their use in clinical prac-    compared the predictive ability of continuous plasma biomarker
tice or their availability across the same individuals.2 Thus, there   values with binary plasma biomarker values, which can be more
is an urgent need for blood-based biomarkers that overcome these       easily implemented in the clinic and for decision-making in clinic-
limitations, which can be widely used in primary care settings as      al trials. To examine the specificity of our findings we also studied
well as clinical trials to detect Alzheimer’s disease pathology.       these biomarkers in patients with a non-Alzheimer’s neurodege-
    In line with this, plasma biomarkers have recently emerged as      nerative disease. Finally, we compared the predictive value of the
non-invasive, cost-effective and accessible tools to assess the        plasma biomarkers to those obtained from the same biomarkers
pathological changes that occur over the disease course.3 For in-      measured in the CSF.
stance, plasma amyloid-b 42/40 (Ab42/40) levels are thought to re-
flect amyloid-b deposition and have been shown to correlate with
brain amyloidosis both in cognitively normal as well as cognitively    Materials and methods
impaired individuals.4–6 Plasma phosphorylated-tau 181 (P-tau181)
                                                                       Participants
and 217 (P-tau217) might reflect both amyloid and tau deposition
in the brain, correlating with increased amyloid-PET and tau-PET       This study included 317 individuals from the Swedish BioFINDER-2
signals.7–10 Finally, plasma neurofilament light chain (NfL) levels    cohort (NCT03174938), an ongoing longitudinal study designed to
are thought to reflect axonal injury and neurodegeneration, being      develop new markers for the early diagnosis of Alzheimer’s dis-
increased not only in Alzheimer’s disease11 but also other neuro-      ease and other neurodegenerative disorders. Subjects with base-
degenerative diseases12,13 and correlating with measures of brain      line plasma and CSF levels of Ab42/40, P-tau181, P-tau217 and NfL
atrophy on structural MRI.14,15 While these studies have shown an      in addition to longitudinal Mini-Mental State Examination (MMSE)
association between plasma biomarkers with some of the patho-          scores, 18F-RO948 PET, 18F-flutemetamol PET and structural MRI
logical processes associated with Alzheimer’s disease using a          were included. All subjects had two to four longitudinal PET scans,
cross-sectional study design, it is currently unclear whether base-    MRI scans and cognitive evaluations over a period of 2 years.
line plasma biomarker levels can be used to predict longitudinal       Amyloid status was established using CSF Ab42/40 levels with a
amyloid accumulation, tau deposition, brain atrophy as well as         previously established cut-off of 50.752, which was defined with
cognitive decline in the same individuals. Recent studies have         mixture modelling.20
shown that plasma P-tau181 is associated with global cognitive de-         The BioFINDER-2 study enrols participants in five subcohorts
cline and hippocampal atrophy8 as well as temporal cortical thin-      (NCT03174938). Subcohorts 1 and 2 include neurologically and cog-
ning and cortical hypometabolism in individuals with a positive        nitively healthy elderly subjects, who were required to: (i) be 45–
amyloid PET scan.16 In addition, high levels of plasma P-tau217        65 years old (subcohort 1) or 66–100 years old (subcohort 2); (ii) not
were recently found to correlate with increases in tau PET in the      have cognitive symptoms as assessed by a physician specialized in
entorhinal cortex in subjects with a normal tau PET scan at base-      cognitive disorders; (iii) have an MMSE score between 27 and 30;
line17 and longitudinal increases in this marker were associated       (iv) not fulfil the criteria for mild or major neurocognitive disorder
with worse cognition and brain atrophy.18 However, the prognostic      (mild cognitive impairment or dementia) according to DSM-51; and
value of different plasma biomarkers, including amyloid burden,        (v) be fluent in Swedish. The recruitment process of this cohort
and tau accumulation, as well as temporal brain atrophy and cog-       was designed to have 50% APOE e4 carriers.
nitive decline, and whether they have an independent ability to            Cohort 2 comprises participants with subjective cognitive de-
anticipate future pathological and clinical changes associated with    cline or mild cognitive impairment, who were required to: (i) be 40–
Alzheimer’s disease remains unclear. This would be important,          100 years old; (ii) have been referred to the memory clinics because of
particularly in non-demented individuals, who are most likely to       cognitive symptoms; (iii) have an MMSE score of 24–30 points; (iv) not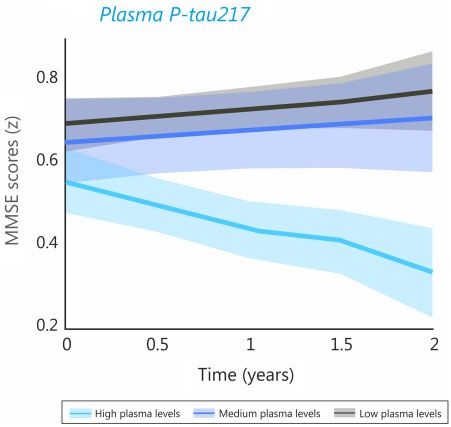
2828    | BRAIN 2021: 144; 2826–2836                                                                                        J. B. Pereira et al.

fulfil the criteria for any dementia (major neurocognitive disorder)      Imaging acquisition
according to DSM-51; and (v) be fluent in Swedish. In accordance with
                                                                          All subjects underwent longitudinal 18F-RO948 PET on a GE
the research framework by the National Institute on Aging-
                                                                          Discovery scanner and structural MRI on a Siemens Prisma 3 T
Alzheimer’s Association (NIA-AA),21 study participants with subject-
                                                                          scanner. In addition, 85 non-demented individuals also had longi-
ive cognitive decline were considered to be cognitively unimpaired.
                                                                          tudinal 18F-flutemetamol PET scans on a Philips Gemini TF 16
Participants were classified as having mild cognitive impairment if
                                                                          scanner.
they performed worse than –1.5 standard deviations (SD) in any cogni-         18
                                                                                F-RO948 PET images were acquired 70–90 min after injection
tive domain according to age and education stratified test norms.
                                                                          of 370 MBq 18F-RO948, reconstructed using VPFX-S (ordered subset
     Cohort 3 consists of participants with dementia due to
                                                                          expectation maximization combined with corrections for time-of-
Alzheimer’s disease, who were required to: (i) be 40–100 years old;
                                                                          flight and point spread function) with six iterations and 17 subsets
(ii) have been referred to the memory clinics because of cognitive
                                                                          with 3 mm smoothing, a standard Z filter and 25.6-cm field of view
symptoms; (iii) have an MMSE score of 512 points; (iv) fulfil the
                                                                          (256  256 matrix).
DSM-5 criteria for dementia (major neurocognitive disorder) due to
                                                                              Structural T1-weighted images were acquired using a magnet-
Alzheimer disease; and (v) be fluent in Swedish. Clinical
                                                                          ization-prepared rapid gradient echo (MPRAGE) sequence using
Alzheimer’s disease dementia was diagnosed according to the

                                                                                                                                                    Downloaded from https://academic.oup.com/brain/article/144/9/2826/6291241 by guest on 24 October 2021
                                                                          the following parameters: 178 slices, repetition time: 1950 ms, echo
DSM-5 criteria for major neurocognitive disorder. All patients with
                                                                          time: 3.4 ms, inversion time: 900 ms, flip angle: 9 , 1 mm isotropic
Alzheimer’s disease were amyloid-b-positive in agreement with
                                                                          voxels. In addition, fluid-attenuated inversion recovery (FLAIR)
the updated NIA-AA criteria for Alzheimer’s disease.21
     Cohort 4 covers other non-Alzheimer’s disease dementias and          images were also acquired at baseline with the following parame-
neurodegenerative disorders. Inclusion criteria were: (i) aged 40–        ters: 176 slices, repetition time: 5000 ms, echo time: 393 ms, inver-
100 years; (ii) fulfilment of criteria for dementia (major neurocogni-    sion time: 1800 ms, 1 mm isotropic voxels.
tive disorder) due to frontotemporal dementia, Parkinson’s disease            Finally, 18F-flutemetamol PET images were acquired 90 to
with dementia,22 subcortical vascular dementia,22 Parkinson’s dis-        110 min after injection of 185 MBq 18F-flutemetamol and recon-
ease,23 progressive supranuclear palsy,24 multiple system atro-           structed into 4  5 frames using the line-of-response row-action
phy,25 corticobasal syndrome26 or semantic variant primary                maximum-likelihood algorithm.
progressive aphasia27; and (iii) fluent in Swedish. Patients with
amyloid pathology were excluded from this group to ensure there           Longitudinal imaging preprocessing
was no underlying concomitant Alzheimer’s disease pathology.
                                                                          All 18F-RO948 and 18F-flutemetamol PET images were motion-cor-
     Exclusion criteria for all subcohorts were: (i) having significant
                                                                          rected, time-averaged and coregistered to their corresponding
unstable systemic illness that makes it difficult to participate in
                                                                          skull stripped, longitudinally preprocessed T1-weighted images.
the study; (ii) current significant alcohol or substance misuse; and      18
                                                                             F-RO948 images were further normalized by a reference region
(iii) refusing lumbar puncture, MRI or PET.
                                                                          consisting of the inferior cerebellar grey matter,31 whereas 18F-flu-
     The Regional Ethical Review Board of Lund University, the
                                                                          temetamol scans were normalized using a reference region that
Swedish Medicines and Products Agency, and the Radiation Safety
                                                                          included the whole cerebellum, brainstem and eroded subcortical
Committee of Skåne University Hospital in Sweden approved the
                                                                          white matter.32 Structural MRI images were preprocessed using
study and written, informed consent was obtained from all partici-
                                                                          the longitudinal analysis pipeline of FreeSurfer (version 6.0,
pants according to the Declaration of Helsinki.
                                                                          https://surfer.nmr.mgh.harvard.edu/). Briefly, after running the
                                                                          cross-sectional pipeline on each time point, an unbiased within-
Measurement of plasma and CSF biomarkers                                  subject template was created. Several preprocessing steps such as
Blood was collected from all participants using EDTA-plasma tubes         skull stripping, Talairach transforms, atlas registration as well as
            R
(VacutainerV K2EDTA tube, BD Diagnostics), which were centri-             spherical surface maps and parcellations were then performed
fuged (2000g, + 4 C) for 10 min, transferred into 50 ml polypropyl-      with common information from the within-subject template.33–35
ene tubes and mixed. Then, 1 ml was aliquoted into 1.5 ml                      FLAIR images were preprocessed using the Lesion Segmentation
polypropylene tubes and stored at –80 C within 30–60 min of col-         Toolbox36 implemented in SPM8 (https://www.fil.ion.ucl.ac.uk/spm/)
lection. All plasma samples underwent one freeze-thaw cycle               to generate total white matter lesion volumes for each individual,
when 200 ll were further aliquoted into 0.5 ml Eppendorf tubes            which were included in secondary analyses.
(Eppendorf Nordic A/S) and stored at –80 C.9 The CSF from the
same individuals was collected through lumbar puncture using              Longitudinal imaging analyses
standardized procedures, as described elsewhere.28 To establish
                                                                          To determine longitudinal changes in amyloid deposition on 18F-
the concentrations of the plasma and CSF markers of interest to
                                                                          flutemetamol PET, tau accumulation on 18F-RO948 PET and brain
this study, we used: (i) EUROIMMUN immunoassays (EUROIMMUN
                                                                          atrophy on structural MRI, we used two different approaches: one
AG)29 for plasma Ab42 and Ab40; (ii) Meso Scale Discovery (MSD)
                                                                          based on regions of interest and the other based on whole brain
immunoassays for CSF Ab426 and Ab409 (MSD); (iii) CSF and plasma
                                                                          voxel-wise analyses.
P-tau18130 and CSF and plasma P-tau 2719 immunoassays devel-
                                                                              For the first approach, we calculated: (i) the amyloid-b PET stand-
oped at Lilly Research Laboratories; and (iv) a single molecule array
                                                                          ardized uptake value ratio (SUVR) for a global composite region that
(Simoa) assay for CSF and plasma NfL (Quanterix).12
                                                                          included the caudal anterior cingulate, frontal, lateral parietal and
                                                                          lateral temporal gyri32; (ii) the tau SUVR of a composite region con-
APOE genotyping                                                           sisting of the entorhinal, fusiform, parahippocampus and inferior
APOE genotypes were determined in DNA extracted from a 5 ml               temporal gyri, corresponding to Cho stages I–IV37; (iii) the mean cor-
aliquot of EDTA blood using PCR amplification complemented by             tical thickness of a meta-temporal region of interest that included
hybridization using TaqManTM probes.                                      the entorhinal, fusiform, inferior and middle temporal gyri on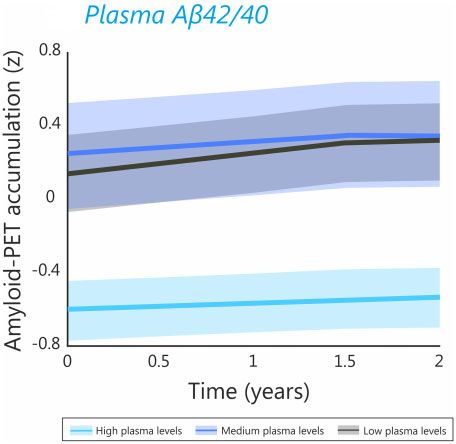
Plasma markers predict AD changes                                                              BRAIN 2021: 144; 2826–2836          | 2829

structural MRI38; and (iv) the average hippocampal volumes and cor-    demented subjects of our cohort to divide them into normal and
responding intracranial volumes on structural MRI.                     abnormal biomarker groups. We then repeated the linear mixed
     For the second approach, we created slope images for 18F-flute-   models with the binary biomarkers as predictors to assess whether
metamol PET and 18F-RO948 PET images by subtracting the last           they could predict changes in brain imaging and cognition, simi-
longitudinal image to the first image of each individual. These dif-   larly to the continuous biomarkers.
ference maps were subsequently smoothed using a Gaussian ker-              All the analyses conducted in R and SPSS were adjusted for
nel of 8 mm and voxel-wise analyses were carried out using the         multiple comparisons using false discovery rate (FDR) corrections
smoothed maps. To conduct voxel-wise analyses with the struc-          (q 5 0.05, two-tailed).39 Similarly, the voxel-wise analyses using
tural MRI scans, we used the longitudinal registration pipeline of     PET and MRI images were adjusted for multiple comparisons with
the statistical parametric mapping software SPM12 (https://www.        topological FDR corrections in SPM12 (P 5 0.05, two-tailed).40
fil.ion.ucl.ac.uk/spm/). For each participant, the T1-weighted scans
were registered and bias-corrected using the longitudinal registra-
                                                                       Data availability
tion tool. An average T1-weighted image was created for each
individual and subsequently segmented into grey matter. The seg-       Anonymized data will be shared by request from a qualified aca-
mented grey matter maps were then multiplied by the Jacobian           demic investigator for the sole purpose of replicating procedures

                                                                                                                                               Downloaded from https://academic.oup.com/brain/article/144/9/2826/6291241 by guest on 24 October 2021
difference maps. Finally, using the forward deformation fields         and results presented in the article and providing that the data
calculated in the previous steps, the resulting images were            transfer is in agreement with EU legislation on the general data
normalized to MNI space and smoothed using a Gaussian kernel           protection regulation and decisions by the Ethical Review Board of
of 12 mm.                                                              Sweden and Region Skåne, which should be regulated in a material
                                                                       transfer agreement.
Statistical analyses
Statistical analyses were carried out using SPSS 25.0 (IBM Corp.)      Results
and R (version 3.5.1). To test whether baseline biomarker levels
                                                                       Study participants
were associated with longitudinal changes in brain imaging and
cognition we used univariate and multivariate linear mixed effect      In total, 317 participants were included in this longitudinal study,
models. These models used global amyloid SUVR, temporal tau            of which 159 were non-demented (52 cognitively normal, 44 with
SUVR, temporal thickness, hippocampal volumes or global cogni-         subjective cognitive decline and 63 with mild cognitive impair-
tion (MMSE) as dependent variables and the plasma biomarkers,          ment), 123 had dementia due to Alzheimer’s disease and 35 had
time, age, sex, amyloid status, APOE e4 carriership, presence of       non-Alzheimer’s neurodegenerative diseases (Table 1). Among
cognitive impairment, years of education (for cognitive variables)     individuals with mild cognitive impairment, 30 had a single do-
and intracranial volume (for volumetric variables) as fixed effects.   main amnestic cognitive profile, 19 had a single domain non-
We also included the interaction between biomarker levels and          amnestic profile, 13 had a multidomain amnestic profile and 1 had
time (together with the main effects), and random effects for inter-   a multidomain non-amnestic cognitive profile.
cepts. Separate models were built for each plasma variable. The            In this study, the main analyses were conducted in all non-
univariate models included only one plasma biomarker each.             demented individuals, whereas the Alzheimer’s disease demen-
Model fits were compared (for the same outcomes) using an
                                                                       tia and non-Alzheimer’s groups were only included in sensitivity
ANOVA and the Akaike information criterion (AIC) was reported
                                                                       analyses. In the non-demented group, the majority of subjects
for each model. In addition, the effect sizes of each predictor were
                                                                       had longitudinal 18F-RO948 tau PET and structural MRI (120 par-
also calculated using Cohen’s d.
                                                                       ticipants: 45 cognitively normal, 32 with subjective cognitive de-
    The multivariate models included all plasma biomarkers sim-
                                                                       cline, 43 with mild cognitive impairment) and a subsample also
ultaneously as predictors. The aim of these models was to deter-
                                                                       had longitudinal 18F-flutemetamol PET (84 participants: 37 cogni-
mine which plasma biomarker had a superior ability in predicting
                                                                       tively normal, 23 with subjective cognitive decline, 24 with mild
longitudinal changes, independently of the other biomarkers,
                                                                       cognitive impairment). In the non-Alzheimer’s group, a sub-
which was the main aim of our study. In all multivariate models,
                                                                       sample of 14 patients also had longitudinal 18F-RO948 tau PET
the variance inflation factor (45) was calculated to ensure there
                                                                       and structural MRI.
was no multicollinearity amongst the included variables. To ex-
                                                                           As expected, non-demented individuals had higher cognitive
plore the results obtained in the multivariate linear mixed models
                                                                       scores, plasma Ab42/40 levels, hippocampal volumes and temporal
with imaging variables, we also performed voxel-wise multiple re-
                                                                       thickness in addition to lower NfL levels compared to the other
gression analyses using the longitudinal PET and MRI images in
SPM12, including the significant plasma biomarkers as the varia-       two groups. Further, they also had higher P-tau181, P-tau217 and
bles of interest and age, sex, presence of cognitive impairment,       tau-PET signals compared to the non-Alzheimer’s group. The
amyloid status, APOE e4 carriership and intracranial volume (MRI       number of visits and longitudinal follow-up time for each assess-
analyses) as covariates.                                               ment are described below as median followed by interquartile
    Finally, since binary biomarker values are easier to implement     range (IQR). Additional information about the time to each follow-
in clinical practice compared to continuous values, we dichotom-       up can be found in Table 1. For the imaging and clinical variables
ized the plasma biomarkers into normal and abnormal. To do             that were significantly associated with baseline plasma bio-
this, we used the Youden index to define optimal cut-offs in Ab42/     markers in the multivariate linear mixed effects models, we
40, P-tau181, P-tau217 and NfL plasma levels that could discrimin-     included the plots with the mean longitudinal trajectories (Figs 1–4)
ate a sample of 121 amyloid-b-negative cognitively normal individ-     in addition to the spaghetti plots with the individual longitudinal
uals of BioFINDER-2 from the 123 amyloid-b-positive demented           trajectories (Supplementary Fig. 1). Finally, we also included the
patients with Alzheimer’s disease described in Table 1, which          results of analyses performed in amyloid-positive non-demented
were the following: 0.16 pg/ml for plasma Ab42/40, 7.48 pg/ml for      individuals in Supplementary material and compare the results
plasma P-tau181, 3.04 pg/ml for plasma P-tau217 and 17.58 pg/ml        obtained in this group with the ones observed in the whole non-de-
for plasma NfL. These cut-offs were then applied to the non-           mented sample in the ‘Discussion’ section.
2830 | BRAIN 2021: 144; 2826–2836 J. B. Pereira et al.
Table 1 Baseline cohort characteristics
Non-demented (n = 159) Non-AD dementia AD dementia P-value
(52 CN, 40 SCD, 67 MCI) (n = 35) (n = 123)
Age 69.2 (42.4–87.5) 73.0 (57.6–87.3) 73.9 (52.8–87.6) 50.001
Sex, male/female 87/72 24/11 56/67 0.927
Education 13.1 (7–33) 11.3 (7–22) 12.3 (4–25) 0.162
MMSE 28.0 (23–30) 23.5 (17–30) 20.1 (8–28) 50.001
Amyloid-b positivity, % 8.2 CN, 22.6 SCD, 33.3 MCI 0 100 50.001
APOE e4 carriership, % 54.7 25.7 72.4 50.001
Plasma Ab42/40, pg/ml 0.18 (0.09–1.9) 0.17 (0.12–0.21) 0.16 (0.09–0.63) 0.395
Plasma P-tau181, pg/ml 7.9 (1.1–24.8) 8.7 (2.9–26.8) 13.1 (3.7–57.4) 50.001
Plasma P-tau217, pg/ml 2.81 (0.5–36.0) 3.49 (0.5–40.6) 7.36 (0.7–21.4) 50.001
Plasma NfL, pg/ml 17.5 (4.0–70.1) 24.2 (9.2–62.7) 26.9 (9.7–254.4) 50.001
CSF Ab42/40, pg/ml 0.73 (0.30–1.46) 1.08 (0.8–1.3) 0.48 (0.21–0.79) 50.001
Downloaded from https://academic.oup.com/brain/article/144/9/2826/6291241 by guest on 24 October 2021
CSF P-tau181, pg/ml 81.3 (12.4–289.3) 41.29 (17.0–81.0) 87.8 (18–193) 50.001
CSF P-tau217, pg/ml 167.3 (8.6–785.8) 84.5 (19.7–499.5) 608.1 (65.3–2015.2) 50.001
CSF NfL, pg/ml 1208.2 (250–10600) 1743.1 (390.0–4600.0) 2071.1 (330–9330) 50.001
Amyloid-PET global composite 0.79 (0.53–1.31) – – –
SUVRa
Tau temporal composite SUVRb 1.27 (0.96–2.52) 1.09 (0.94–1.25) 2.26 (1.19–4.51) 50.001
Temporal cortical thicknessb 2.66 (2.17–3.11) 2.56 (1.84–2.95) 2.38 (1.58–2.74) 50.001
Hippocampal volumesb 3583.4 (2199.5–4818.7) 3328.9 (1779.8–4289.3) 2791.6 (2023.7–3907.8) 50.001
Time to longitudinal amyloid-PET 1.56 (0.92–1.96) – – –
Time to longitudinal tau
Second scan 1.26 (0.03–2.06) 1.17 (0.01–2.02) – 0.003
Third scan 1.59 (0.85–1.87) 1.20 (1.10–1.39) – 0.012
Fourth scan 1.60 (1.52–1.68) – – –
Time to longitudinal MRI
Second scan 1.26 (0.03–2.06) 1.17 (0.01–2.02) – 0.002
Third scan 1.59 (0.85–1.87) 1.20 (1.10–1.39) – 0.012
Fourth scan 1.60 (1.52–1.68) – – –
Time to longitudinal cognitive assessment
Second evaluation 1.21 (0.45–1.75) 1.05 (0.76–1.41) – 0.217
Third evaluation 1.99 (1.65–2.68) 1.93 (1.21–2.48) – 0.409
Data are presented as median (range) unless otherwise described. P-values were derived from Kruskal-Wallis tests for continuous non-normally distributed measures and chi-
squared tests for categorical measures. Amyloid-b positivity was determined using a cut-off 50.8 using CSF Ab42/40. AD = Alzheimer’s disease; CN = cognitively normal;
MCI = mild cognitive impairment; SCD = subjective cognitive decline.
a
Amyloid-PET was only available for a subsample of subjects in the non-demented group (n = 86).
b
Tau-PET and MRI data were only available for a subsample of subjects of the non-demented group (n = 120) and of the non-Alzheimer’s disease group (n = 14).
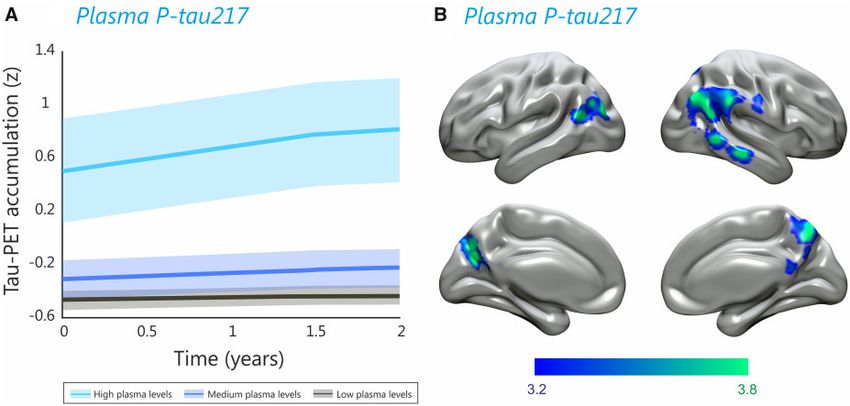
Figure 1 Plasma P-tau217 levels independently predict longitudinal tau accumulation in non-demented individuals. Predicted trajectories for temporal tau
accumulation (z-scores) in relation to baseline plasma P-tau217. (A) The models were fit using continuous P-tau217 values but for illustration purposes the
plots show the trajectories for individuals with high, medium and low plasma P-tau217 tertiles. (B) The voxel-wise analyses using longitudinal tau images
showed a positive correlation between plasma P-tau217 and increased tau accumulation in temporal and parietal areas, after FDR corrections.Plasma markers predict AD changes BRAIN 2021: 144; 2826–2836 | 2831
Relationship between plasma biomarkers and
longitudinal tau in non-demented participants
To test whether baseline plasma biomarkers correlate with
changes in tau burden over time (number of visits: median = 2,
IQR = 1; follow-up time: median = 1.6, IQR = 0.7), for each biomark-
er we tested linear mixed-models with temporal tau SUVR as the
outcome and the interaction between the plasma biomarker and
time as a predictor, adjusting for age, sex and presence of cognitive
impairment. These analyses showed that all baseline plasma bio-
markers predicted greater longitudinal temporal tau accumulation
(Supplementary Table 1). The model with plasma P-tau217 had a
significantly better fit to the data compared to the other models, as
reflected by the lowest AIC value (P-tau217: 270.6, P-tau181: 291.8,
Ab42/40: 305.3, NfL: 306.0) (Supplementary Table 1). In addition, it
Downloaded from https://academic.oup.com/brain/article/144/9/2826/6291241 by guest on 24 October 2021
also displayed the largest effect size (P-tau217 Cohen’s d: 0.87)
compared to the other biomarkers (P-tau181: 0.60, Ab42/40: –0.45,
NfL: 0.44) (Supplementary Table 1).
When the interactions between time and each plasma bio-
marker were included in the same multivariate model, only P-
tau217 remained as a significant independent predictor of longi-
tudinal temporal tau accumulation (t = 3.947, P 5 0.001) (Fig. 1A Figure 2 Plasma Ab42/40 levels independently predict longitudinal
and Supplementary Fig. 1A), after verifying there were no multi- amyloid-PET deposition in non-demented individuals. Predicted trajec-
tories for global amyloid-PET accumulation (z-scores) in relation to
collinearity issues in this model (Supplementary Table 2). These
baseline plasma Ab42/40 in a subsample (n = 86) with available amyl-
results were also confirmed by the voxel-wise analyses, which oid-PET data. The models were fit using continuous Ab42/40 values but
showed that P-tau217 correlated with greater tau accumulation for illustration purposes the plots show the trajectories for individuals
in temporal regions in addition to lateral parietal and medial par- with high, medium and low individuals with high, medium and low
ietal areas (Fig. 1B), which overlapped with several brain areas plasma Ab42/40 tertiles. Plasma Ab42/40 did not show significant
results in the voxel-wise analyses, after adjusting for multiple
showing increased longitudinal tau-PET deposition in our cohort
comparisons.
(Supplementary Fig. 2). This could potentially be due to the lim-
ited variability in plasma P-tau217 values in our sample with tau-
PET data, which consisted of 120 individuals. With larger sample
significant results between plasma Ab42/40 levels and amyloid ac-
sizes, most likely the overlap between the areas showing a cor-
cumulation, after adjusting for multiple comparisons.
relation of P-tau217 and tau-PET with the areas showing longitu-
dinal tau-PET changes would be greater due to higher variability
in plasma P-tau217 values.
Relationship between plasma biomarkers with brain
The results of significant interactions between all the predic- atrophy in non-demented participants
tors in the multivariate models can be found in the Supplementary To assess whether plasma biomarkers could also predict longitu-
material. dinal structural changes in brain areas that are known to be vul-
nerable to Alzheimer’s disease such as temporal cortical areas and
Relationship between plasma biomarkers and the hippocampus,41 we conducted the linear mixed model analy-
longitudinal amyloid-PET in non-demented ses using the cortical thickness of a composite temporal region38
or the average hippocampal volumes as the outcome (number of
participants
visits: median = 2, IQR = 1; follow-up time: median = 1.6, IQR = 0.7).
For individuals who underwent longitudinal amyloid-PET, we used These analyses showed that baseline plasma P-tau217 and NfL lev-
linear mixed models to evaluate whether the plasma markers els predicted more severe temporal cortical thinning over time,
were also associated with amyloid changes over time in a neocor- whereas all plasma biomarkers predicted greater hippocampal vol-
tical composite region (number of visits: median = 1.5, IQR = 1; fol- ume loss. The comparisons between the models showed that
low-up time: median = 0.5, IQR = 1.7). These analyses showed that plasma P-tau217 was the best predictor of both temporal thinning
plasma Ab42/40, P-tau217 and NfL, but not P-tau181, predicted lon- (AIC P-tau217: 352.7, P-tau181: 372.6, Ab42/40: 372.5, NfL: 365.1) and
gitudinal amyloid deposition, with the model including P-tau217 hippocampal atrophy (AIC P-tau217: 96.7, P-tau181: 116.3, Ab42/40:
as a predictor having the lowest AIC values (P-tau217: 74.5, P- 121.4, NfL: 102.0) (Supplementary Table 1). In line with this, P-tau217
tau181: 97.6, Ab42/40: 90.1, NfL: 90.7) (Supplementary Table 1). The had the largest effect size (Cohen’s d: –0.63) in the predictions of tem-
analysis of the effect sizes showed that Ab42/40 was the strongest poral thinning compared to NfL (Cohen’s d: –0.48), P-tau181 (Cohen’s
predictor (Cohen’s d: –0.81), followed by P-tau217 (Cohen’s d: 0.73), d: –0.21) and Ab42/40 (Cohen’s d: 0.11), whereas P-tau217 and NfL had
NfL (Cohen’s d: 0.65) and P-tau181 (Cohen’s d: 0.42) (Supplementary the largest effects sizes (both with Cohen’s d: –0.79) in the predictions
Table 1). of hippocampal atrophy compared to P-tau181 (Cohen’s d: –0.53) and
However, when all biomarkers were included in the same Ab42/40 (Cohen’s d: 0.39) (Supplementary Table 1).
model, only plasma Ab42/40 was a significant predictor of amyloid When all plasma biomarkers were included in the same model,
accumulation (t = –2.578, P = 0.012), suggesting that this marker is P-tau217 was the only significant independent predictor of temporal
the only one that is associated with amyloid pathology independ- cortical thinning (t = –3.048, P = 0.003) (Fig. 3A and Supplementary
ently of the other biomarkers (Fig. 2 and Supplementary Fig. 1B). Fig. 1C), whereas both P-tau217 and NfL were significant
There was no multicollinearity between all the predictors predictors of hippocampal volume loss (P-tau217: t = –2.958,
(Supplementary Table 2). The voxel-wise analyses did not show P = 0.004; NfL: t = –2.794, P = 0.006) (Fig. 3B, C and Supplementary Fig.2832 | BRAIN 2021: 144; 2826–2836 J. B. Pereira et al.
Figure 3 Plasma P-tau217 and NfL levels independently predict longitudinal brain atrophy in non-demented individuals. Predicted trajectories for
temporal cortical thickness and hippocampal volumes (z-scores) in relation to baseline plasma P-tau217 and plasma NfL. (A–C) The models were fit
using continuous P-tau217 and NfL values but for illustration purposes the plots show the trajectories for individuals with high, medium and low
plasma P-tau217 tertiles for (A) temporal cortical thinning and (B) hippocampal volume loss as well as (C) individuals with high, medium and low
Downloaded from https://academic.oup.com/brain/article/144/9/2826/6291241 by guest on 24 October 2021
plasma NfL tertiles. (D) The voxel-wise analyses showed a positive correlation between plasma P-tau217 and longitudinal brain atrophy in parietal
and occipital areas, after FDR corrections. Plasma NfL did not show significant results in the voxel-wise analyses, after adjusting for multiple
comparisons.
1D and E). There was no multicollinearity between all the predictors Binary plasma biomarkers are associated with
(Supplementary Table 2). These results were further confirmed by longitudinal imaging changes and cognitive decline
the voxel-wise analyses, which show that P-tau217 was associated
We dichotomized the plasma biomarkers into normal and abnor-
with greater parietal, cingulum and occipital atrophy (Fig. 3D), in
mal using the Youden index (see ‘Materials and methods’ section).
line with this biomarker being highly sensitive to both cortical and
Similar to the analyses using the continuous biomarkers as predic-
subcortical atrophy. The results of significant interactions between
tors, we found that binarized Ab42/40 (normal versus abnormal
all the predictors in the multivariate models can be found in the
levels) was the only independent predictor of amyloid PET
Supplementary material.
accumulation (t = 2.560, P = 0.012). Moreover, binarized P-tau217
was the only independent predictor of temporal cortical thinning
(t = –3.072, P = 0.003), and together with binarized P-tau181 levels,
Relationship between plasma biomarkers and also independently predicted tau accumulation (P-tau217:
cognitive decline in non-demented participants t = 4.289, P 5 0.001; P-tau181: t = 2.795, P = 0.006), hippocampal atro-
phy (P-tau217: t = –2.978, P = 0.003; P-tau181: t = –2.325, P = 0.021)
To determine the clinical value of plasma biomarkers to predict
and cognitive decline (P-tau217: t = –3.208, P = 0.002; P-tau181: t = –3.088,
decline in global cognition, we conducted linear mixed model
P = 0.002).
analyses using the MMSE scores as the outcome (number of vis-
its: median = 2, IQR = 2; follow-up time: median = 1.0, IQR = 1.8).
The results of these analyses showed that plasma P-tau181 and
Elevated plasma Ab42/40 and P-tau217 are not
P-tau217 levels were associated with longitudinal decline in cogni- associated with changes in non-Alzheimer’s
tion, in contrast to Ab42/40 and NfL. The comparisons between the disorders
previous significant models showed that the one with P-tau217 had To test whether our results are specific for Alzheimer’s disease, we
again the best fit to the data (AIC P-tau217: 166.4, P-tau181: 170.6, also conducted the linear mixed model analyses in a group of
Ab42/40: 178.0, NfL: 176.3) (Supplementary Table 1), even after amyloid-negative patients with a non-Alzheimer’s neurodegener-
adjusting for the different cognitive profiles (amnestic, non-amnes- ative disorder (frontotemporal dementia, Parkinson’s disease with
tic, single domain, multidomain) in individuals with mild cognitive dementia, subcortical vascular dementia, progressive supra-
impairment (AIC P-tau217: 154.6, P-tau181: 158.4, Ab42/40: 165.7, nuclear palsy, multiple system atrophy, corticobasal syndrome or
NfL: 157.1). In line with this, P-tau217 showed the largest effect semantic variant primary progressive aphasia). These analyses
sizes (Cohen’s d: –0.49) in the predictions of MMSE scores compared showed that NfL levels were associated with more severe cognitive
to P-tau181 (Cohen’s d: –0.46), NfL (Cohen’s d: –0.32) and Ab42/40 decline (t = –2.784, P = 0.008). The other plasma markers did not
(Cohen’s d: 0.21) (Supplementary Table 1). predict longitudinal changes in brain imaging or cognitive meas-
When all biomarkers were included in the same multivariate ures in this non-Alzheimer’s group (Supplementary Table 3).
model, only P-tau217 was a significant independent predictor of
cognitive decline (t = –2.275, P = 0.024) (Fig. 4 and Supplementary Comparison with CSF biomarkers
Fig. 1F). There was no multicollinearity between all the predictors
To assess whether CSF Ab42/40, CSF P-tau181, CSF P-tau217 and
(Supplementary Table 2). The results of significant interactions be-
CSF NfL have a similar predictive ability compared to their plasma
tween all the predictors in the multivariate models can be found in counterparts, we compared the models with CSF and plasma pre-
the Supplementary material. dictors for each longitudinal outcome using ANOVA. These analy-
We also conducted additional analyses to assess whether base- ses revealed there were no significant differences between the
line white matter lesion volumes influenced cognitive decline. The models with CSF Ab42/40 and plasma Ab42/40 (Supplementary
results showed that they were not significant predictors of cogni- Table 4). On the other hand, CSF P-tau181 was a worse predictor
tive decline in the individuals of our cohort (t = –0.071, P = 0.944), (higher AIC values) of cognitive decline than plasma P-tau181 but
even when added as interaction terms in the models with the performed equally well in the prediction of all other outcomes
plasma markers (P-tau217 model: t = 1.432, P = 0.156; P-tau181 (Supplementary Table 5). Moreover, CSF P-tau217 was a worse pre-
model: 1.354, P = 0.179; Ab42/40 model: t = 1.476, P = 0.143; NfL dictor (higher AIC values) of tau accumulation, temporal cortical
model: t = 1.382, P = 0.170). thinning and hippocampal atrophy compared to plasma P-tau217Plasma markers predict AD changes BRAIN 2021: 144; 2826–2836 | 2833
and discriminating Alzheimer’s from non-Alzheimer’s disor-
ders.7,9,17 Our study extends these cross-sectional findings by
showing that baseline plasma biomarkers can furthermore predict
longitudinal amyloid and tau accumulation in non-demented indi-
viduals. Specifically, we observed that although several plasma
biomarkers were associated with amyloid accumulation in the
univariate models, plasma Ab42/40 was the only biomarker that
independently predicted increased global amyloid deposition over
time in the multivariate models. These results are in line with
amyloid-PET deposition being closely related with amyloid levels
in the blood.4 In addition, we also found that blood P-tau217 levels
at baseline was an independent predictor of increased tau accu-
mulation over time and furthermore correlated with voxel-wise
tau accumulation in temporal and parietal regions. We have re-
Downloaded from https://academic.oup.com/brain/article/144/9/2826/6291241 by guest on 24 October 2021
cently shown that plasma P-tau217 has a significantly higher diag-
nostic accuracy for Alzheimer’s disease than other plasma
biomarkers, being associated with the density of tau tangles
and becoming elevated as early as 20 years before disease
onset in familial mutation carriers.9 Thus, it is plausible that
plasma P-tau217 is also a better indicator of longitudinal tau accu-
Figure 4 Plasma P-tau217 levels independently predict cognitive mulation, even when compared to plasma P-tau181. This would be
decline in non-demented individuals. Predicted trajectories for in line with recent studies showing that CSF P-tau217 is more
global cognitive decline measured with the MMSE (z-scores) in
strongly associated with tau deposition than CSF P-tau18130,42 and
relation to baseline plasma P-tau217. The models were fit using con-
might reflect better the pathological state of tau associated with
tinuous P-tau217 values but for illustration purposes the plots
show the trajectories for individuals with high, medium and low the formation of paired helical tau filaments.43
plasma P-tau217 tertiles. In addition to being a reliable marker for longitudinal tau accu-
mulation, our multivariate models show that plasma P-tau217 also
but performed equally well in predicting amyloid accumulation or independently predicted temporal cortical thinning and hippo-
cognitive decline (Supplementary Table 6). Finally, CSF NfL was a campal atrophy in non-demented individuals, in contrast to NfL,
worse predictor of temporal cortical thinning, amyloid accumula- which only independently predicted hippocampal atrophy. These
tion and hippocampal volume (higher AIC values) but performed results were further confirmed by the voxel-wise analyses, which
equally well in predicting tau or cognitive decline compared to showed that plasma P-tau217 levels correlated with longitudinal
plasma NfL (Supplementary Table 7). Altogether, these results sug- voxel-wise atrophy in parietal, cingulum and occipital regions,
gest that CSF biomarkers performed equally well or worse in the being therefore sensitive to both cortical and subcortical brain at-
predictions of longitudinal imaging and cognitive changes com- rophy. It is well established that brain atrophy in Alzheimer’s dis-
pared to the plasma biomarkers. ease begins in the hippocampus and temporal areas, which then
spreads to medial parietal regions and surrounding areas due to
the connections between the hippocampus and the posterior cin-
Discussion gulate.43 The associations between P-tau217 levels with longitu-
With the potential development of new disease-modifying thera- dinal atrophy in the hippocampus, other temporal areas and
pies for Alzheimer’s disease, a uniform, simple and widely access- parietal regions seem to reflect this atrophy pattern. This higher
ible test is urgently needed to identify high-risk individuals who sensitivity of P-tau217 to brain atrophy in areas that are typical of
should be further evaluated for treatment.10 Blood-based bio- Alzheimer’s disease could be related to the vulnerability of these
markers are non-invasive and cost-effective tools that could be areas to tau accumulation. Previous studies have shown that tau
used to identify such individuals. However, it is currently unclear burden in temporal brain areas correlates with volume loss within
whether these biomarkers are able to predict longitudinal patho- the same areas in early stages of the disease,44–46 which could be
logical changes associated with Alzheimer’s disease. In this study, due to the toxic effects of tau on neuronal volume and dendritic
we show that plasma Ab42/40 is an independent predictor of fu- complexity.47,48 These anatomical changes in temporal areas
ture amyloid accumulation, whereas plasma P-tau217 is an inde- eventually lead to global cognitive decline,1,49,50 which in our study
pendent predictor of tau accumulation, temporal cortical thinning, was also independently predicted by baseline plasma P-tau217 lev-
hippocampal atrophy and global cognitive impairment in non-de- els. Thus, altogether, these findings suggest that plasma P-tau217
mented individuals. Moreover, the plasma biomarkers performed is a sensitive marker of multiple changes associated with
equally well or better than the corresponding biomarkers in CSF. Alzheimer’s disease, including tau burden, brain atrophy and clin-
These findings suggest that plasma Ab42/40 and P-tau217 could be ical decline. This was further strengthened by the comparison be-
candidate prognostic markers to predict future brain abnormalities tween the univariate models with single biomarkers, which
and clinical deficits associated with Alzheimer’s disease. showed that the models with P-tau217 had the best fit to the data.
Several studies have begun to assess the utility of blood-based Finally, the lack of ability of plasma P-tau217 or plasma Ab42/40 to
markers to detect the underlying amyloid and tau pathological predict cognitive decline in non-Alzheimer’s patients, in contrast
processes that characterize Alzheimer’s disease. For instance, to NfL, suggest that P-tau217 and Ab42/40 are not only sensitive
plasma Ab42/40 concentrations have been shown to identify base- but also quite specific to Alzheimer’s disease. Moreover, we also
line amyloid status defined on amyloid-PET scans.4–6 In addition, found that P-tau217 and Ab42/40 did not predict changes in tau ac-
recent cross-sectional studies have shown that the novel plasma cumulation or brain atrophy in the non-Alzheimer’s group.
P-tau181 and P-tau217 markers are increased since early stages of However, this finding must be interpreted with caution as only
Alzheimer’s disease, correlating with tau deposition on tau scans 14 of 35 patients with a non-Alzheimer’s disorder underwent2834 | BRAIN 2021: 144; 2826–2836 J. B. Pereira et al.
longitudinal tau-PET and MRI, which most likely limited the statis- and P-tau217 could be used as important prognostic tools to esti-
tical power of these analyses. mate the progression of the disease in clinical practice, allowing
Of note, in the current study, we performed the main analyses for a more accurate patient management and better disease moni-
in the whole non-demented group independently of amyloid-sta- toring in future clinical trials.
tus since plasma biomarkers are most useful in clinical practice
and trials where PET imaging or CSF lumbar puncture have not al-
ready been done due to the low accessibility, high cost or invasive- Funding
ness of these procedures.52 In other words, plasma biomarkers are Work at the authors’ research centre was supported by the
probably most useful in contexts where the amyloid status of a pa- Swedish Research Council, the Knut and Alice Wallenberg founda-
tient is unknown and not in deeply phenotyped populations where tion, the Marianne and Marcus Wallenberg foundation, the
amyloid (and maybe tau) CSF or PET examinations have already Strategic Research Area MultiPark (Multidisciplinary Research in
been performed. Parkinson’s disease) at Lund University, the Swedish Alzheimer
In fact, it has been recently proposed that plasma biomarkers Foundation, the Swedish Brain Foundation, Strategic Research
should be utilized in clinical trials of Alzheimer’s disease as a pre- Area Neuroscience (StratNeuro), Center for Medical Innovation
screening tool to identify individuals who have not yet undergone
Downloaded from https://academic.oup.com/brain/article/144/9/2826/6291241 by guest on 24 October 2021
(CIMED), The Parkinson foundation of Sweden, the Skåne
CSF or PET in order to identify cases with a higher risk of develop- University Hospital Foundation, the Konung Gustaf V: S och
ing this disorder.52 For instance, in an anti-tau trial with tau PET Drottning Victorias Frimurarestiftelse, the Medical Faculty at Lund
and cognition as outcomes, based on our results, one could use University, Region Skåne, The Bundy Academy and the Swedish
plasma P-tau217 to identify those with high risk of accumulating federal government under the ALF agreement. Doses of 18F-flute-
tau and exhibiting cognitive decline over time. However, before metamol injection were sponsored by GE Healthcare. The precur-
entering the trial, a tau PET scan would need to be done and prob- sor of 18F-RO948 was provided by Roche. J.B.P. is supported by
ably also an amyloid PET scan, but both PET acquisitions would grants from the Swedish Research Council (#2018-02201), a Senior
only be performed in individuals with high P-tau217 levels. Hence, Researcher Faculty Position at Karolinska Institutet, the Strategic
by excluding subjects with low plasma P-tau217 levels from PET Research Programme in Neuroscience at Karolinska Institutet
scanning, the costs associated with these clinical trials would be
(Stratneuro Startup Grant), The Center for Medical Innovation
significantly reduced.
(#20200695), Gamla Tjänarinnor and Stohnes. K.B. is supported by
From a clinical point of view, we think that both plasma Ab42/
the Swedish Research Council (#2017-00915), the Alzheimer Drug
40 and P-tau217 might be used in the future as initial tests in pri-
Discovery Foundation (ADDF), USA (#RDAPB-201809-2016615), the
mary healthcare settings where CSF and PET are not available to
Swedish Alzheimer Foundation (#AF-742881), Hjärnfonden,
identify individuals with a higher risk of subsequent amyloid accu-
Sweden (#FO2017-0243), the Swedish state under the agreement
mulation, tau accumulation, brain atrophy and cognitive decline.
between the Swedish government and the County Councils, the
These high-risk individuals could then be referred to specialized
ALF-agreement (#ALFGBG-715986), and European Union Joint
memory clinics to undergo a more thorough diagnostic work-up
Program for Neurodegenerative Disorders (JPND2019-466-236). H.Z.
before starting relevant treatments.
is a Wallenberg Scholar supported by grants from the Swedish
Our study has several strengths, including the large number of
Research Council (#2018-02532), the European Research Council
participants with several plasma biomarkers and longitudinal
(#681712), Swedish State Support for Clinical Research (#ALFGBG-
amyloid-PET, tau, structural MRI as well as cognitive measures. In
720931) and the UK Dementia Research Institute at UCL.
addition, all subjects had CSF Ab42/40, P-tau181, P-tau217 and NfL
levels, which showed either similar or worse predictive ability
compared to the plasma biomarkers. Finally, we also performed Competing interests
our analyses using binary plasma biomarker levels, which showed
a similar ability to predict longitudinal imaging and clinical O.H. has acquired research support (for the institution) from AVID
changes compared to the continuous plasma levels, indicating Radiopharmaceuticals, Biogen, Eli Lilly, Eisai, GE Healthcare, Pfizer,
they could be easily implemented in clinical practice. However, a and Roche. In the past 2 years, he has received consultancy/speak-
few limitations should also be recognized such as the fact that er fees from AC Immune, Alzpath, Biogen, Cerveau and Roche.
many subjects had not yet undergone longitudinal amyloid-PET J.L.D. is an employee and stockholder of Eli Lilly and Company.
scanning at the time of the study, which could explain why no sig- The remaining authors do not report any disclosures.
nificant results were found in the associations between plasma
Ab42/40 levels and voxel-wise amyloid accumulation after adjust- Supplementary material
ing for multiple comparisons. In addition, we did not have an inde-
pendent cohort that we could use to confirm our findings, but we Supplementary material is available at Brain online.
are planning to do this in the future when the plasma markers and
longitudinal imaging techniques we used become available in
other relevant longitudinal cohorts. Finally, the small number of
References
subjects included in the non-Alzheimer’s group, which included 1. Jack CR, Jr, Knopman DS, Jagust WJ, et al. Tracking pathophysio-
diverse diagnoses with more homogenous amyloid levels is also a logical processes in Alzheimer’s disease: An updated hypothetical
limitation. Future studies assessing our panel of plasma bio- model of dynamic biomarkers. Lancet Neurol. 2013;12(2):207–216.
markers in separate and larger groups with different non- 2. Molinuevo JL, Ayton S, Batrla R, et al. Current state of Alzheimer’s
Alzheimer’s disorders are needed in order to establish the specifi- fluid biomarkers. Acta Neuropathol. 2018;136(6):821–853.
city of plasma Ab42/40 and P-tau217 for Alzheimer’s disease. 3. Hampel H, O’Bryant SE, Molinuevo JL, et al. Blood-based bio-
In summary, here we show that baseline plasma Ab42/40 and markers for Alzheimer disease: Mapping the road to the clinic.
P-tau217 levels are independent predictors of pathological changes Nat Rev Neurol. 2018;14(11):639–652.
that occur over the course of Alzheimer’s disease. These bio- 4. Nakamura A, Kaneko N, Villemagne VL, et al. High performance
markers performed equally well or better than the corresponding plasma amyloid-b biomarkers for Alzheimer’s disease. Nature.
biomarkers in CSF. These findings indicate that plasma Ab42/40 2018;554(7691):249–254.Plasma markers predict AD changes BRAIN 2021: 144; 2826–2836 | 2835
5. Schindler SE, Bollinger JG, Ovod V, et al. High-precision plasma 23. Gelb DJ, Oliver E, Gilman S. Diagnostic criteria for Parkinson dis-
b-amyloid 42/40 predicts current and future brain amyloidosis. ease. Arch Neurol. 1999;56(1):33–39.
Neurology. 2019;93:e1647-59. 24. Hoglinger GU, Höglinger GU, Respondek G, et al.; Movement
6. Palmqvist S, Janelidze S, Stomrud E, et al. Performance of fully Disorder Society-endorsed PSP Study Group. Clinical diagnosis
automated plasma assays as screening tests for alzheimer dis- of progressive supranuclear palsy: The movement disorder so-
ease–related b-amyloid status. JAMA Neurol. 2019;76(9): ciety criteria. Mov Disord. 2017;32(6):853–864.
1060–1069. 25. Gilman S, Wenning GK, Low PA, et al. Second consensus state-
7. Janelidze S, Mattsson N, Palmqvist S, et al. Plasma P-tau181 in ment on the diagnosis of multiple system atrophy. Neurology.
Alzheimer’s disease: Relationship to other biomarkers, differ- 2008;71(9):670–676.
ential diagnosis, neuropathology and longitudinal progression 26. Armstrong MJ, Litvan I, Lang AE, et al. Criteria for the diagnosis
to Alzheimer’s dementia. Nat Med. 2020;26(3):379–386. of corticobasal degeneration. Neurology. 2013;80(5):496–503.
8. Karikari TK, Pascoal TA, Ashton NJ, et al. Blood phosphorylated 27. Gorno-Tempini ML, Hillis AE, Weintraub S, et al. Classification
tau 181 as a biomarker for Alzheimer’s disease: A diagnostic of primary progressive aphasia and its variants. Neurology. 2011;
performance and prediction modeling study using data from 76(11):1006–1014.
four prospective cohorts. Lancet Neurol. 2020;19(5):422–433. 28. Palmqvist S, Zetterberg H, Blennow K, et al. Accuracy of brain
Downloaded from https://academic.oup.com/brain/article/144/9/2826/6291241 by guest on 24 October 2021
9. Palmqvist S, Janelidze S, Quiroz YT, et al. Discriminative accur- amyloid detection in clinical practice using cerebrospinal fluid
acy of plasma phospho-tau217 for Alzheimer disease vs other beta-amyloid42: A cross-validation study against amyloid
neurodegenerative disorders. JAMA. 2020;324(8):772–781. positron emission tomography. JAMA Neurol. 2014;71(10):
10. Thijssen EH, La Joie R, Wolf A, et al.; Advancing Research and 1282–1289.
Treatment for Frontotemporal Lobar Degeneration (ARTFL) 29. Palmqvist S, Zetterberg H, Mattsson N, et al.; for the Alzheimer’s
investigators. Diagnostic value of plasma phosphorylated Disease Neuroimaging Initiative. Detailed comparison of amyl-
tau181 in Alzheimer’s disease and frontotemporal lobar degen- oid-PET and CSF biomarkers for identifying early Alzheimer dis-
eration. Nat Med. 2020;26(3):387–397. ease. Neurology. 2015;85(14):1240–1249.
11. Mattsson N, Cullen NC, Andreasson U, Zetterberg H, Blennow K. 30. Janelidze S, Stomrud E, Smith R, et al. Cerebrospinal fluid P-
Association between longitudinal plasma neurofilament light tau217 performs better than P-tau181 as a biomarker of
and neurodegeneration in patients with Alzheimer disease. Alzheimer’s disease. Nat Comm. 2020;11:1–12.
JAMA Neurol. 2019;76(7):791–799. 31. Ossenkoppele R, Rabinovici GD, Smith R, et al. Discriminative
12. Hansson O, Janelidze S, Hall S, et al.; For the Swedish BioFINDER accuracy of [18F] flortaucipir positron emission tomography for
study. Blood-based NfL: A biomarker for differential diagnosis Alzheimer disease vs other neurodegenerative disorders. JAMA.
of parkinsonian disorder. Neurology. 2017;88(10):930–937. 2018;320(11):1151–1162.
13. Meeter LH, Steketee RM, Salkovic D, et al. Clinical value of cere- 32. Landau SM, Fero A, Baker SL, et al. Measurement of longitudinal
brospinal fluid neurofilament light chain in semantic dementia. b-amyloid change with 18F-florbetapir PET and standardized
J Neurol Neurosurg Psychiatry. 2019;90(9):997–1004. uptake value ratios. J Nucl Med. 2015;56(4):567–574.
14. Mattsson N, Insel PS, Palmqvist S, et al.; the Alzheimer’s 33. Reuter M, Rosas HD, Fischl B. Highly accurate inverse consistent
Disease Neuroimaging Initiative. Cerebrospinal fluid tau, neu- registration: A robust approach. Neuroimage. 2010;53(4):1181–1196.
rogranin, and neurofilament light in Alzheimer’s disease. EMBO 34. Reuter M, Fischl B. Avoiding asymmetry-induced bias in longi-
Mol Med. 2016;8(10):1184–1196. tudinal image processing. Neuroimage. 2011;57(1):19–21.
15. Pereira JB, Westman E, Hansson O; Alzheimer’s Disease 35. Reuter M, Schmansky NJ, Rosas HD, Fischl B. Within-subject
Neuroimaging Initiative. Association between cerebrospinal template estimation for unbiased longitudinal image analysis.
fluid and plasma neurodegeneration biomarkers with brain at- Neuroimage. 2012;61(4):1402–1418.
rophy in Alzheimer’s disease. Neurobiol Aging. 2017;58:14–29. 36. Schmidt P, Gaser C, Arsic M, et al. An automated tool for detec-
16. Hansson O, Cullen N, Zetterberg H, Blennow K, Mattsson- tion of FLAIR-hyperintense white-matter lesions in multiple
Carlgren N; Alzheimer’s Disease Neuroimaging Initiative. sclerosis. Neuroimage. 2012;59(4):3774–3783.
Plasma phosphorylated tau181 and neurodegeneration in 37. Cho H, Choi JY, Hwang MS, et al. In vivo cortical spreading pat-
Alzheimer’s disease. Ann Clin Trans Neurol. 2021;8(1):259- tern of tau and amyloid in the Alzheimer disease spectrum. Ann
17. Janelidze S, Berron D, Smith R, et al. Associations of plasma Neurol. 2016;80(2):247–258.
phospho-Tau217 levels with tau positron emission tomography 38. Jack CR, Jr, Wiste HJ, Schwarz CG, et al. Longitudinal tau in age-
in early Alzheimer disease. JAMA Neurol. 2021;78(2):149–156. ing and Alzheimer’s disease. Brain. 2018;141(5):1517–1528.
18. Mattsson-Carlgren N, Janelidze S, Palmqvist S, et al. 39. Benjamini Y, Hochberg Y. Controlling the false discovery rate: A
Longitudinal plasma p-tau217 is increased in early stages of practical and powerful approach to multiple testing. J Royal Stat
Alzheimer’s disease. Brain. 2020;143(11):3234–3241. Soc Series B. 1995;57(1):289–300.
19. Cummings JL, Doody R, Clark C. Disease-modifying therapies 40. Chumbley J, Worsley K, Flandin G, Friston K. Topological FDR
for Alzheimer disease: Challenges to early intervention. for neuroimaging. Neuroimage. 2010;49(4):3057–3964.
Neurology. 2007;69(16):1622–1634. 41. Frisoni GB, Fox NC, Jack CR, Scheltens P, Thompson PM. The
20. Bertens D, Tijms BM, Scheltens P, Teunissen CE, Visser PJ. clinical use of structural MRI in Alzheimer disease. Nat Rev
Unbiased estimates of cerebrospinal fluid beta-amyloid 1-42 Neurol. 2010;6(2):67–77.
cutoffs in a large memory clinic population. Alzheimers Res 42. Sato C, Barthélemy NR, Mawuenyega KG, et al. Tau kinetics in
Ther. 2017;9(1):1–8. neurons and the human central nervous system. Neuron. 2018;
21. Jack CR, Jr, Bennett DA, Blennow K, et al.; Contributors. NIA-AA 97(6):1284–1298.
Research Framework: Toward a biological definition of 43. Mattsson-Carlgren N, Andersson E, Janelidze S, et al. Ab depos-
Alzheimer’s disease. Alzheimers Dement. 2018;14(4):535–562., ition is associated with increases in soluble and phosphorylated
22. American Psychiatric Association. Diagnostic and statistical tau that precede a positive Tau in Alzheimer’s disease. Sci Adv.
manual of mental disorders: Diagnostic and statistical manual of 2020;6(16):eaaz2387.
mental disorders, 5th edn. Arlington, VA: American Psychiatric 44. Pini L, Pievani M, Bocchetta M, et al. Brain atrophy in
Association; 2013. Alzheimer’s disease and aging. Age Res Rev. 2016;30:25–48.You can also read