Political Partisanship and Antiscience Attitudes in Online Discussions About COVID-19: Twitter Content Analysis
←
→
Page content transcription
If your browser does not render page correctly, please read the page content below
JOURNAL OF MEDICAL INTERNET RESEARCH                                                                                                               Rao et al

     Original Paper

     Political Partisanship and Antiscience Attitudes in Online
     Discussions About COVID-19: Twitter Content Analysis

     Ashwin Rao, BS; Fred Morstatter, PhD; Minda Hu, MS; Emily Chen, BS; Keith Burghardt, PhD; Emilio Ferrara,
     PhD; Kristina Lerman, PhD
     Information Sciences Institute, University of Southern California, Marina del Rey, CA, United States

     Corresponding Author:
     Ashwin Rao, BS
     Information Sciences Institute
     University of Southern California
     4676 Admiralty Way
     STE 1001
     Marina del Rey, CA, 90292
     United States
     Phone: 1 213 505 0363
     Email: mohanrao@usc.edu

     Abstract
     Background: The novel coronavirus pandemic continues to ravage communities across the United States. Opinion surveys
     identified the importance of political ideology in shaping perceptions of the pandemic and compliance with preventive measures.
     Objective: The aim of this study was to measure political partisanship and antiscience attitudes in the discussions about the
     pandemic on social media, as well as their geographic and temporal distributions.
     Methods: We analyzed a large set of tweets from Twitter related to the pandemic, collected between January and May 2020,
     and developed methods to classify the ideological alignment of users along the moderacy (hardline vs moderate), political (liberal
     vs conservative), and science (antiscience vs proscience) dimensions.
     Results: We found a significant correlation in polarized views along the science and political dimensions. Moreover, politically
     moderate users were more aligned with proscience views, while hardline users were more aligned with antiscience views. Contrary
     to expectations, we did not find that polarization grew over time; instead, we saw increasing activity by moderate proscience
     users. We also show that antiscience conservatives in the United States tended to tweet from the southern and northwestern states,
     while antiscience moderates tended to tweet from the western states. The proportion of antiscience conservatives was found to
     correlate with COVID-19 cases.
     Conclusions: Our findings shed light on the multidimensional nature of polarization and the feasibility of tracking polarized
     opinions about the pandemic across time and space through social media data.

     (J Med Internet Res 2021;23(6):e26692) doi: 10.2196/26692

     KEYWORDS
     COVID-19; Twitter; infodemiology; infodemic; infoveillance; multidimensional polarization; social media; social network

                                                                                 at all these levels. Instead of orderly consensus-building, we
     Introduction                                                                have seen disagreement and controversy that exacerbated the
     Effective response to a health crisis requires society to forge a           toll of the disease. Research papers are rushed through the
     consensus on many levels: scientists and doctors have to learn              review process, with results sometimes being disputed or
     about the disease and quickly and accurately communicate their              retracted [1], policy makers giving conflicting advice [2], and
     research findings to others, public health professionals and                scientists and many in the public disagreeing on many issues,
     policy experts have to translate the research into policies and             from the benefits of therapeutics [3] to the need for lockdowns
     regulations for the public to follow, and the public has to follow          and face-covering [4]. The conflicting viewpoints create
     guidelines to reduce infection spread. However, the fast-moving             conditions for polarization to color perceptions of the pandemic
     COVID-19 pandemic has exposed our critical vulnerabilities                  [5-8] and attitudes toward mitigation measures.

     https://www.jmir.org/2021/6/e26692                                                                     J Med Internet Res 2021 | vol. 23 | iss. 6 | e26692 | p. 1
                                                                                                                          (page number not for citation purposes)
XSL• FO
RenderX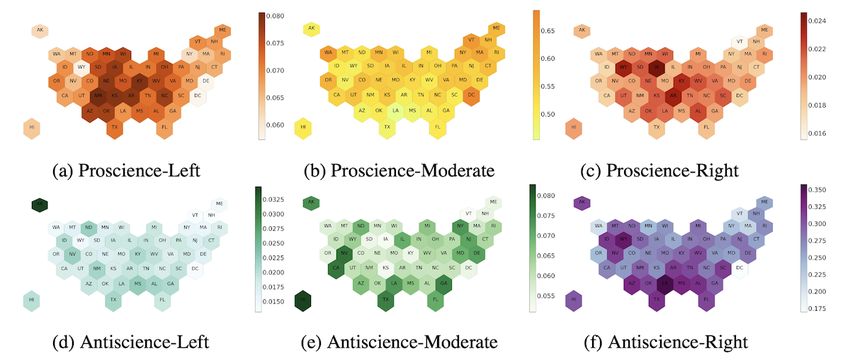
JOURNAL OF MEDICAL INTERNET RESEARCH                                                                                                         Rao et al

     Surveys have identified a partisan gulf in the attitudes about         algorithms to classify remaining users along the multiple
     COVID-19 and the costs and benefits of mitigation strategies,          dimensions of polarization based on the content of their posts.
     with the public’s opinion polarized into sharply contrasting           Inferring the polarization of users discussing COVID-19 allowed
     positions. According to a Pew Research Center report [9],              us to study the relationships between polarized ideologies and
     political partisanship significantly affects perceptions of public     their temporal and geographic distributions. We showed that
     health measures and might explain regional differences in the          political and science dimensions were highly correlated and
     pandemic’s toll in the United States [10]. Polarization has            that politically hardline users were more likely to be antiscience,
     colored the messages of US political leaders about the pandemic        while politically moderate users were more often proscience.
     [7] as well as discussions of ordinary social media users [8].         We also identified regions of the United States and time points
     Coupled with a distrust of science and institutions, polarization      where the different ideological subgroups were comparably
     can have a real human cost if it leads the public to minimize          more active and we identified their topics of conversation. We
     the benefits of face coverings or reject the COVID-19 vaccine          found that areas of heightened antiscience activity corresponded
     when it becomes available. Dr Anthony Fauci, the nation’s top          to US states with large COVID-19 outbreaks. Our work,
     infectious diseases expert, attributed many of the disease’s           therefore, provides insights into potential reasons for geographic
     500,000 deaths (and counting) to political divisions in the            heterogeneity of outbreak intensity.
     country [11]. This further affirms the need to investigate the
                                                                            The contributions of this work are as follows:
     presence, and unravel the ill effects, of polarization in scientific
     and political discourse.                                               •   We described a framework to infer the multidimensional
                                                                                polarization of social media users, allowing us to track
     Current research measures polarization as divergence of opinions
                                                                                political partisanship and attitudes toward science at scale.
     along the political dimension and its effect on other opinions,
                                                                            •   We showed that political and science dimensions were
     for example, discussion of scientific topics [12]. However,
                                                                                highly correlated, with hardline right and antiscience
     opinions on controversial issues are often correlated [13]; for
                                                                                attitudes closely aligned.
     example, those who support transgender rights also believe in
                                                                            •   We studied the geographical distribution of polarized
     marriage equality, and those who oppose lockdowns also resist
                                                                                opinions and found that regional differences can correlate
     universal face-covering. Inspired by this idea, we capture some
                                                                                with the pandemic’s toll.
     of the complexity of polarization by projecting opinions in a
     multidimensional space, with different axes corresponding to           As the amount of COVID-19 information explodes, we need
     different semantic dimensions. Once we identify the dimensions         the ability to proactively identify emerging areas of polarization
     of polarization and define how to measure them, we can study           and controversy. Early identification could lead to more effective
     the dynamics of polarized opinions, their interactions, and            interventions to reduce polarization and also improve the
     regional differences.                                                  efficacy of disease mitigation strategies. Vaccine hesitancy was
                                                                            shown in past research to be associated with antiscience attitudes
     Our work analyzed tweets posted on Twitter related to the
                                                                            [16]; therefore, our approach may help identify regions of the
     COVID-19 pandemic collected between January 21 and May
                                                                            country that will be more resistant to COVID-19 vaccination.
     1, 2020 [5]. We studied polarization along three dimensions:
                                                                            This may better prepare public health workers to target their
     political (liberal vs conservative), science (proscience vs
                                                                            messages.
     antiscience), and moderacy (hardline vs moderate). User
     polarization along the science axis identifies whether users align
     with scientific and factual sources of information or whether
                                                                            Methods
     they are characterized by mistrust of science and preference for       Here, we describe the data and methods we used for measuring
     pseudoscientific and conspiracy sources. A user’s political            polarization and also inferred it from text and online interactions.
     ideology is defined in a 2D space. Working in tandem with the
     political axis, the moderacy dimension recognizes the intensity        Data Set
     of partisanship from hardline to moderate. For the hardliners          In this study, we used a public data set of COVID-19 tweets
     identified along the moderacy dimension, we leveraged the              from Twitter [5]. This data set comprises 115 million tweets
     political axis to identify their partisanship as liberal or            from users across the globe, collected over a period of 101 days
     conservative.                                                          from January 21 to May 1, 2020. These tweets contain at least
     Cinelli et al [14] and Weld et al [15] showed that sharing of          one keyword from a predetermined set of COVID-19–related
     URLs annotated by Media Bias/Fact Check is a reliable proxy            keywords (eg, coronavirus, pandemic, and Wuhan).
     of one’s political polarity. Inspired by the findings and              Fewer than 1% of the tweets in the original corpus have
     conclusions made in these works, we used media sources that            geographic coordinates associated with them. We specifically
     have been classified by nonpartisan sites along these dimensions       focused on tweets from users located in the United States, at
     to define the poles of each dimension of polarization. These           state-level granularity, based on geolocated tweets and fuzzy
     media sources include both mainstream news and a large variety         matching of user profile text [8]. Specifically, we used a fuzzy
     of other sources, such as government agencies, nongovernmental         text matching algorithm to detect state names and abbreviations,
     organizations, crowdsourced content, and alternative medicine          as well as names of populous cities. The user profile text
     news and health sites. Users were given a score reflecting how         extracted from the description attribute of the user object was
     often they shared information from each set of polarized sources.      passed on to the loc_to_state function of the georeferencing
     These users served as training data to train machine learning
     https://www.jmir.org/2021/6/e26692                                                               J Med Internet Res 2021 | vol. 23 | iss. 6 | e26692 | p. 2
                                                                                                                    (page number not for citation purposes)
XSL• FO
RenderX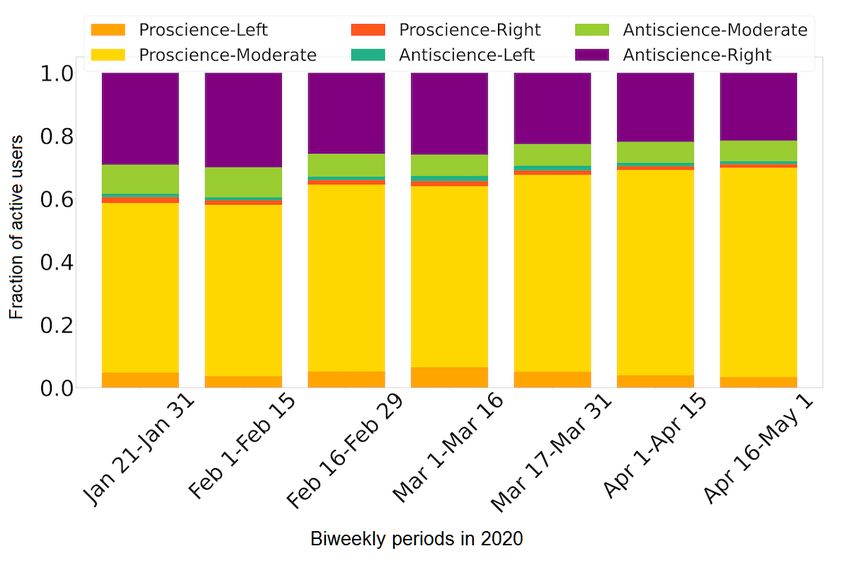
JOURNAL OF MEDICAL INTERNET RESEARCH                                                                                                                 Rao et al

     code [17] to extract the user’s location at the state level. A                AllSides, and NewsGuard, which tracks coronavirus
     manual review of this approach found it to be effective in                    misinformation (see data folder at GitHub [23]). Table 1 lists
     identifying the user’s home state. This methodology provided                  exemplar domains, hereinafter referred to as pay-level domains
     location information for 65% of users in the data set. The                    (PLDs), in each category. PLDs listed under conspiracy and
     georeferenced data set consisted of 27 million tweets posted by               questionable sources were mapped to our antiscience category.
     2.4 million users over the entire time period.                                For the moderacy axis, we considered the union of left and right
                                                                                   PLDs as a proxy for the hardline category, while the union of
     Measuring Polarization Using Domain Scores                                    least-biased, left-moderate, and right-moderate PLDs formed
     We characterized individual attitudes along three dimensions                  the proxy moderate category.
     of polarization. The political dimension, the standard dimension
     for characterizing partisanship, captured the difference between              We quantified a user’s position along the dimensions of
     left (liberal) and right (conservative) stances for users with                polarization by tracking the number of links to curated PLDs
     strong hardline political opinions. The science dimension                     the user shared. Specifically, we extracted PLDs that were
     captured an individual’s acceptance of evidence-based                         shared by users in the data set and filtered for relevant PLDs
     proscience views or the propensity to hold antiscience views.                 that were present in our curated lists (Table 1). This gave us a
     People believing and promoting conspiracies, especially                       set of 136,000 users who shared science PLDs, 169,000 users
     health-related and pseudoscientific conspiracies, were often                  who shared political PLDs, and 234,000 users who shared PLDs
     grouped in the antiscience camp. Finally, the moderacy                        along the moderacy dimension. There was a wide distribution
     dimension described the intensity of partisanship, from moderate              in the number of tweets, and therefore PLDs, shared between
     or nonpartisan opinions to politically hardline opinions.                     users (Figure S1 in Multimedia Appendix 1), with some users
                                                                                   tweeting many PLDs and many users tweeting one or none. We,
     We inferred polarized attitudes of users from the content of their            therefore, filtered out users who shared fewer than three relevant
     posts. While previous work [18] inferred polarization from user               PLDs in each dimension (ie, fewer than three in the science
     hashtags, we instead relied on user-tweeted URLs. The key idea                dimension, fewer than three in the partisan dimension, and fewer
     that motivated our approach is that online social networks tend               than three in the moderacy dimension), which resulted in 18,700
     to be ideologically similar, with users more closely linked (eg,              users. For each user, we computed a domain score δ along each
     through follower relationships) to others who share their beliefs             of the three dimensions, as the average of mapped domain values
     [19,20]. While we did not have follow links in our data, we used              of a dimension:
     URLs as evidence [21] of a homophilic link. We extended this
     approach beyond political ideology [22] to label other
     dimensions of polarization. Specifically, we used a curated list
     of information sources, whose partisan leanings were classified
     by neutral websites, to infer the polarization of Twitter users at            where δi is the domain score of useri and Di,d represents the set
     scale. We used lists compiled by Media Bias/Fact Check,
                                                                                   of PLDs shared by useri relevant to dimension d.

     Table 1. Curated information and news pay-level domains (PLDs) with their polarization.
         Dimension and polarization       PLDs, n       Examples of PLDs
         dimension

         Sciencea
             Proscience (+1)              150+          cdc.gov, who.int, thelancet.com, mayoclinic.org, nature.com, and newscientist.com
             Antiscience (−1)             450+          911truth.org, althealth-works.com, naturalcures.com, shoebat.com, and prison-planet.com

         Politicalb
             Liberal (−1)                 300+          democracynow.org, huffingtonpost.com, newyorker.com, occupy.com, and rawstory.com
             Conservative (+1)            250+          nationalreview.com, newsmax.com, oann.com, theepochtimes.com, and bluelivesmatter.blue

         Moderacyc
             Moderate (+1)                400+          ballotpedia.org, c-span.org, hbr.org, wikipedia.org, weforum.org, snopes.com, and reuters.com
             Hardline (−1)                500+          gopusa.com, cnn.com, democracynow.org, huffingtonpost.com, oann.com, and theepochtimes.com

     a
         Proscience PLDs are mapped to +1 along the science axis, while antiscience PLDs are mapped to −1.
     b
         Along the political axis, liberal PLDs are mapped to −1, while conservative PLDs are mapped to +1.
     c
         Along the moderacy axis, hardline PLDs are mapped to −1, while moderate PLDs are mapped to +1.

     Figure 1 shows the distribution of domain scores for users who                users sharing information from antiscience than proscience
     shared links to information sources across all dimensions. The                PLDs and more conservative than liberal PLDs. In Figure S2
     distributions were peaked at their extreme values, showing more               in Multimedia Appendix 1, we show that these extremes were

     https://www.jmir.org/2021/6/e26692                                                                       J Med Internet Res 2021 | vol. 23 | iss. 6 | e26692 | p. 3
                                                                                                                            (page number not for citation purposes)
XSL• FO
RenderX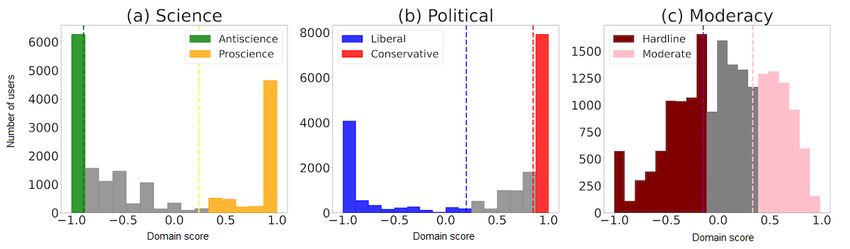
JOURNAL OF MEDICAL INTERNET RESEARCH                                                                                                                   Rao et al

     robust to how we filtered users and were, therefore, not a product             of, for example, sharing a single link.
     Figure 1. The distribution of domain scores along science, political, and moderacy dimensions. (a) The vertical lines at 0.42 and −1 mark the top and
     bottom 30% cutoffs of distribution along the science dimension, which are binned as proscience (+1) and antiscience (−1), respectively. (b) The vertical
     lines at 1 and −0.33 mark the top and bottom 30% cutoffs of distribution along the political dimension, which are binned as conservative (+1) and liberal
     (−1), respectively. (c) The vertical lines at 0.38 and −0.18 mark the top and bottom 30% cutoffs of distribution along the moderacy dimension, which
     are binned as moderate (+1) and hardline (−1), respectively.

     For network-level analysis, we then built a web scraper that                   Table 2 illustrates the number of seeds along each polarization
     mapped PLDs to their respective Twitter handles. The scraper                   axis.
     initiated a simple Google query of the form “Domain Name
                                                                                    To investigate the presence of bias stemming from an uneven
     Twitter Handle.” This tool relied on the search engine to rank
                                                                                    distribution of PLDs along each ideological dimension’s
     results based on relevance and picked out the title of the first
                                                                                    polarized ends, we sampled an equal number of PLDs along
     result containing the substring “|Twitter.” This substring was
                                                                                    each of the dimension’s two polarities. More specifically, we
     of the form “Account Name (@handle) | Twitter,” which was
                                                                                    performed random downsampling of the majority ideological
     parsed to retrieve the domain’s corresponding handle. We
                                                                                    polarity along each dimension. Upon ensuring that each
     manually verified the mapped PLDs. The mapped
                                                                                    dimension’s polarized ends were now represented by an equal
     dimension-wise PLDs are available on our GitHub repository
                                                                                    number of PLDs, we calculated domain scores for each user
     under the data folder.
                                                                                    along the ideological dimensions (Figure S3 in Multimedia
     Recall that along each of the three dimensions, we mapped the                  Appendix 1). Leveraging these domain scores, we then rebuilt
     dimension’s constituent domain names to their respective                       prediction models. We found that the performance of this
     Twitter handles. The mapped Twitter handles formed our seed                    modified procedure did not differ significantly from our results
     sets for semisupervised learning at the network level. Each                    (see Table S1 in Multimedia Appendix 1 for more details). This
     dimension’s seed set comprised key-value pairs of Twitter                      robustness check demonstrated the versatility of our approach
     handles and their corresponding orientation along the dimension.               to differences in the sampling of PLDs along each dimension.

     Table 2. Description of the retweet network.

         Dimension and polarization                                                Seedsa, n (%)
         Science (n=158)
             Proscience                                                            81 (51.3)
             Antiscience                                                           77 (48.7)
         Political (n=195)
             Liberal                                                               96 (49.2)
             Conservative                                                          99 (50.8)
         Moderacy (n=558)
             Hardline                                                              195 (34.9)
             Moderate                                                              363 (65.1)

     a
         Number of seed handles along each polarization axis for initial node assignment in the label propagation algorithm.

     https://www.jmir.org/2021/6/e26692                                                                         J Med Internet Res 2021 | vol. 23 | iss. 6 | e26692 | p. 4
                                                                                                                              (page number not for citation purposes)
XSL• FO
RenderX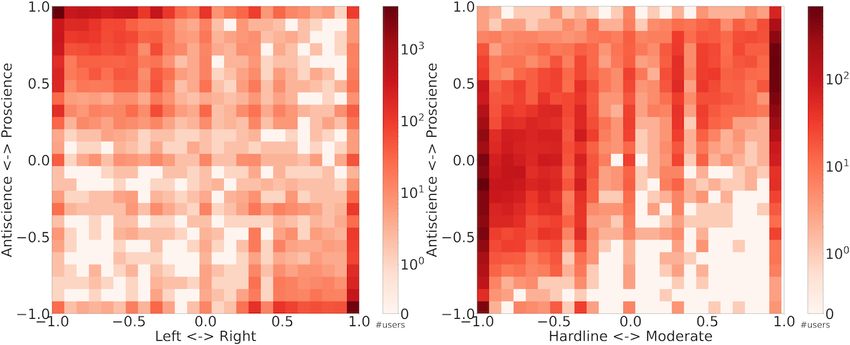
JOURNAL OF MEDICAL INTERNET RESEARCH                                                                                                      Rao et al

     Inferring Polarization                                               [22]). The idea behind label propagation is that people prefer
                                                                          to connect to, and retweet content posted by, others who share
     Overview                                                             their opinions [24,25]. This gives us an opportunity to leverage
     Using domain scores, we were able to quantify the polarization       topological information from the retweet network to infer users’
     of just a small fraction (18,700/2,400,000, 0.78%) of users who      propensity to orient themselves along ideological dimensions.
     generated PLDs in the data set. In this section, we describe how
                                                                          The geocoded Twitter data set provides fields named
     we leveraged this data to infer the polarization of the remaining
                                                                          screen_name and rt_user, which allowed us to identify the user
     users in our data set. In the Results section, we compare the
                                                                          being retweeted and the user retweeting, respectively. To this
     performance of these inference methods. Two methods, label
                                                                          end, we built a network from 9.8 million retweet interactions
     propagation algorithm (LPA) and latent Dirichlet allocation
                                                                          between 1.9 million users sourced from the data set. In the
     (LDA), act as baselines against our state-of-the-art text
                                                                          retweet network, an edge runs from A to B if user A retweets
     embedding method. Our study focused on investigating content
                                                                          user B. Descriptive statistics of the retweet network are shown
     generated by users over the entire period rather than at the
                                                                          in Table 3. We then used the semisupervised greedy learning
     noisier tweet level. Investigating a user’s content, tweet by
                                                                          algorithm (ie, the LPA) to identify clusters in the retweet
     tweet, may or may not provide sufficient information to gauge
                                                                          network.
     their ideological polarity, whereas analyzing all tweets generated
     by a user over time would facilitate this.                           LPA, as proposed by Raghavan et al [26], is a widely used
                                                                          near-linear time node classification algorithm. This greedy
     We classified users according to the binned domain scores along
                                                                          learning method started off with a small set of labeled nodes
     each dimension. We found that classification worked better than
                                                                          also known as seeds, with the remaining nodes assigned labels
     regression in this data set. We binned domain scores by
                                                                          at random. The number of seeds for each polarization dimension
     thresholding the distribution into two classes along each
                                                                          is shown in Table 2. The algorithm then iteratively updated the
     dimension, as shown in Figure 1. Using other threshold values
                                                                          labels of nonseed nodes to the majority label of their neighbors,
     to bin the domain score distribution into two classes did not
                                                                          with ties broken at random, until converging to an equilibrium
     qualitatively change results (Multimedia Appendix 1).
                                                                          where the labels no longer changed. However, owing to
     Additionally, we released a GitHub repository [23] for readers
                                                                          stochasticity of tie-breaking, a certain amount of randomness
     to reproduce this work upon careful rehydration of tweet data,
                                                                          crept into the results produced by this algorithm. As the result,
     instructions for which have also been provided in the repository.
                                                                          LPA tended to generate slightly differing classifications of user
     Label Propagation Algorithm                                          polarization for the same network each time it was run. To
     LPA was used in the past to label user ideology based on the         address the stochasticity, we ran the LPA in 5-fold
     ideology of accounts the user retweets (eg, see Badawy et al         cross-validation and averaged the results.

     Table 3. Statistics of the network.
      Statistic                                                           Value, n
      Nodes                                                               1,857,028
      Maximum in-degree                                                   39,149
      Maximum out-degree                                                  1450
      Retweets                                                            9,788,251
      Unique retweets                                                     7,745,533
      Size of the strongly connected component                            1,818,657

                                                                          would have achieved significantly better results than the one
     Latent Dirichlet Allocation                                          seen in this study.
     We used LDA [27] to identify topics, or groups of hashtags,
     and represented users as vectors in this topic space. We             We used the document-topic affinity matrix generated by LDA
     considered the set of all hashtags in the COVID-19 data set          to represent users. An affinity vector was composed of 20
     generated by a user over time as a document representing that        likelihood scores corresponding to 20 topics, adding up to 1,
     user—after ignoring hashtags used by fewer than 10 users or          with each score indicating the probability of the corresponding
     more than 75% of the users—leaving 25,200 hashtags. The              topic being a suitable representation for the set of hashtags
     choice of 75% was arbitrary, but a hashtag that appeared at a        generated by the user. Using these affinity vectors, we generated
     lower threshold (eg, within roughly 50% of the users) could be       feature vector matrices for each of the three dimensions of
     highly prevalent in one domain and not another. We used a            interest. In doing so, we were able to represent over 900,000
     more lenient threshold to avoid this issue. We also used 20          users who used some hashtag in their tweets with a dense vector
     topics, as that gave a higher coherence score. Given the enormity    of length 20.
     of the geocoded Twitter data set we leveraged in this study,
     conducting LDA experiments to validate these thresholds proved
     to be computationally prohibitive and it was unlikely that tuning
     https://www.jmir.org/2021/6/e26692                                                            J Med Internet Res 2021 | vol. 23 | iss. 6 | e26692 | p. 5
                                                                                                                 (page number not for citation purposes)
XSL• FO
RenderX
JOURNAL OF MEDICAL INTERNET RESEARCH Rao et al
Text Embedding Using fastText political dimensions. Then we compared the performance of
Previous methods—see Conover et al [28]—classified a user’s algorithms for classifying users along the three dimensions of
political polarization based on the text of their tweets by polarization, using domain scores as ground truth data. We used
generating term frequency–inverse document the inferred scores to study the dynamics and spatial distribution
frequency–weighted unigram vectors for each user. However, of polarized opinions of users engaged in online discussions
the advent of more powerful text-embedding techniques [29-31] about COVID-19.
allowed us to generate sentence-embedding vectors to better Visualizing Polarization
represent content.
Figure 2 shows the relationship between dimensions of
We grouped the tweets generated by each of the 2.4 million polarization, leveraging domain scores of 18,700 users who
users from January to May 2020. More specifically, we collected shared information from curated PLDs. The heat map shows
all COVID-19–related tweets generated by a user in this time the density of users with specific domain scores. Large numbers
period and concatenated them to form a text document for each of users are aligned with proscience-left extreme (top-left
user. After preprocessing the 2.4 million documents to lowercase corner) or antiscience-right extreme (bottom-right corner), with
and removing hashtags, URLs, mentions, handles, and stop lower densities along the diagonal between these extremes
words, we used the fastText sentence-embedding model (Figure 2, left-hand side). This illustrates the strong correlation
pretrained on Twitter data to generate tweet embeddings for between political partisanship and scientific polarization, thereby
each user. Preprocessing of tweets was performed by leveraging highlighting the influence of pernicious political divisions on
the regular expression (re) package in Python, version 3.7 evidence-based discourse during the pandemic, with
(Python Software Foundation); the Natural Language Toolkit; conservatives being more likely to share antiscience information
and the Gensim natural language processing library. The than proscience sources. The heat map on the right-hand side
Sent2vec Python package [32] provided us with a Python in Figure 2 highlights the interplay between the science and
interface to quickly leverage the pretrained model and generate moderacy axes. The white region in the bottom-right corner
700-dimension feature vectors representing each user’s shows there are few antiscience users who are politically
discourse. moderate, thus demonstrating an asymmetry in these ideologies.
The shading also highlights a higher density of proscience users
Results identifying as politically moderate. These results are robust to
how data are filtered, as shown in Figure S4 in Multimedia
Overview Appendix 1.
First, we visualized the domain scores of the 18,700 users,
showing the relationship between the science, moderacy, and
Figure 2. Polarization of COVID-19 tweets. On the left is the heat map of polarization (domain scores) along the science-partisanship dimensions. On
the right is the heat map of polarization (domain scores) along the science-moderacy dimensions. Each bin within the heat map represents the number
of users with domain scores falling within that bin.
For content-based approaches, we used binned domain scores
Classifying Polarization of 18,700 users as ground truth data to train logistic regression
To run the LPA, we started from a set of labeled seeds: Twitter models to classify user polarization along the three dimensions.
handles corresponding to PLDs categorized along the We represented each user as a vector of features generated by
dimensions of interest (Tables 1 and 2). We reserved some of different content-based approaches: topic vectors for LDA and
the seeds along each dimension for testing LPA predictions and sentence embeddings for the fastText approach. We reserved a
reported accuracy of 5-fold cross-validation. subset of users for testing performance.
https://www.jmir.org/2021/6/e26692 J Med Internet Res 2021 | vol. 23 | iss. 6 | e26692 | p. 6
(page number not for citation purposes)
XSL• FO
RenderXJOURNAL OF MEDICAL INTERNET RESEARCH Rao et al
Table 4 compares the performance of polarization classification who used hashtags in their tweets. This representation allowed
methods. LPA worked well when it tried to identify user us to design better learning models that significantly
alignment along the political and science dimensions. However, outperformed the LPA model.
it failed to capture the subtler distinctions along the moderacy
A logistic regression model trained on fastText outperformed
axis. Training was further hampered by the low number of
all other models described in this study. Coupled with fastText’s
retweet interactions with moderate PLDs in comparison to
ability to better handle out-of-vocabulary terms, the model’s
hardline ones. Of the 1.8 million retweet interactions, only
access to finer levels of detail at the tweet-text level, culminated
250,000 involved some moderate seed nodes, whereas over 1
in it being able to better predict dimensions of polarization.
million interactions involved some hardline seed nodes.
Given the model’s superior performance across all three
Moreover, poor classification performance with LPA revealed
dimensions, we leveraged its predictions in subsequent analyses.
an important pattern: that moderates surrounded themselves
We classified users along the three polarization dimensions.
with diverse opinions and, thus, a clear distinction could not be
However, since the definition of the hardline extreme of the
made by observing who they retweeted.
moderacy dimension overlapped with the political dimension,
LDA modeling on hashtags allowed us to generate we needed to report only six ideological groups, rather than all
reduced-dimension, dense feature vectors for over 900,000 users eight combinations.
Table 4. Performance of polarization classification.a
Method and dimension Data set size, n Accuracy, % Precision, % Recall, % F1 score, %
Label propagation algorithm
Science 158 92.6 100 b 80 88.9
Political 195 92.3 86.9 100 93.0
Moderacy 1205 20.1 72 1.4 2.74
Latent Dirichlet allocation
Science 9983 92.2 91.6 92.4 91.9
Political 11,020 93.5 95.1 93.3 94.2
Moderacy 9565 86.4 85.6 85.0 85.4
fastText
Science 11,202 93.8 93.9 93.7 93.8
Political 12,425 95.1 96.5 94.6 95.5
Moderacy 11,197 90.2 90.1 90.5 90.2
a
Results compare classification performance of the label propagation algorithm and content-based methods, including topic modeling (latent Dirichlet
allocation) and full-text embedding (fastText). Results are averages of 5-fold cross-validation. Data set sizes are the number of users in model validation
data sets and are composed of users with strong polarization scores (top or bottom 30% as defined previously) in the filtered 18,700-user data set.
b
Values in italics indicate the best-performing models.
dimensions for all time intervals t and computed the average
Discussion
absolute change in domain score from biweekly period
Dynamics of Polarization t−1 along each dimension given by the following:
Research shows that opinions of Twitter users about
controversial topics do not change over time [33]. To investigate
whether user alignments along the three polarization dimensions
changed over time, we grouped tweets by time into seven
biweekly intervals: January 21 to 31, 2020; February 1 to 15,
2020; February 16 to 29, 2020; March 1 to 16, 2020; March 17
to 31, 2020; April 1 to 15, 2020; and April 16 to May 1, 2020. where δi,t represents the domain score for a user i in biweekly
There were 3000 users who tweeted consistently in all seven
biweekly intervals. For each of the N users, we computed period t. The small values of in Table 5 confirm that user
cumulative domain scores along science, political, and moderacy alignments do not change significantly over time.
https://www.jmir.org/2021/6/e26692 J Med Internet Res 2021 | vol. 23 | iss. 6 | e26692 | p. 7
(page number not for citation purposes)
XSL• FO
RenderXJOURNAL OF MEDICAL INTERNET RESEARCH Rao et al
Table 5. Average absolute change in domain score along consecutive biweekly intervals.
Dimension Average absolute change ( ) per biweekly interval numbers
2,1 3,2 4,3 5,4 6,5 7,6
Political 0.09 0.05 0.03 0.02 0.03 0.02
Science 0.13 0.07 0.04 0.02 0.02 0.02
Moderacy 0.21 0.11 0.07 0.04 0.04 0.03
Although each individual’s alignments did not change, the we could clearly see the growth in the proscience-moderate
number of users within each ideological group did change over category accompanied by a corresponding decline in
time. User alignments did not change; therefore, we leveraged antiscience-right users. This was consistently found over a
polarization classification results to show biweekly fractions of variety of data filters, as seen in Figure S5 in Multimedia
active users per ideological category. Figure 3 shows the Appendix 1.
composition of active users in all categories. As time progressed,
Figure 3. Fraction of active users per ideological group in biweekly periods. For completeness, this plot shows all users in the data set and not the
filtered 18,700 users.
#chinavirus. This group also used hashtags related to former
Topics of Polarization US President Donald Trump’s re-election campaign, showing
To better understand what each of the six groups tweeted about, the hyper-partisan nature of COVID-19 discussions. Another
we collected the 50 most frequent hashtags used by each group, partisan issue appeared to be #hydroxychloroquine, a drug
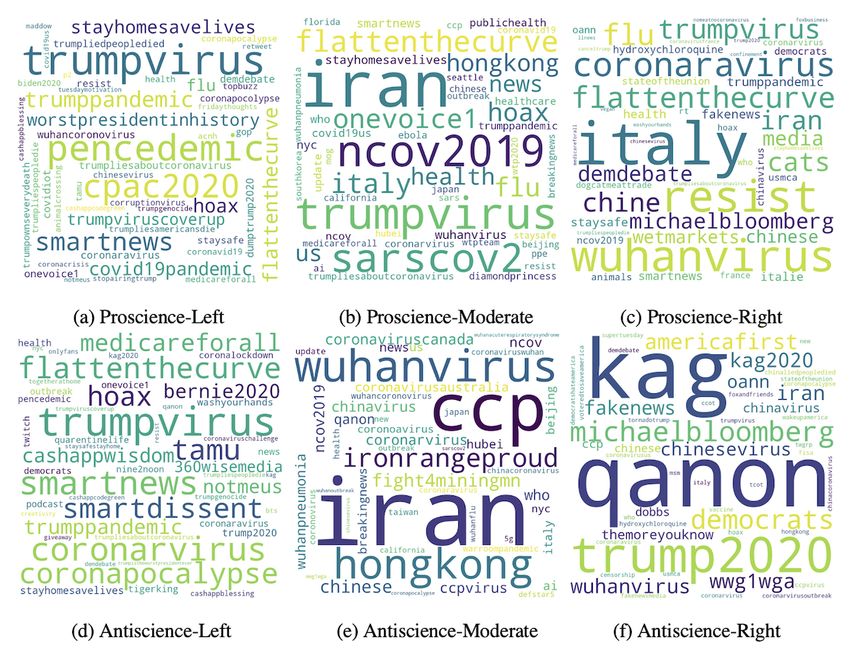
after removing hashtags common to all six groups. Figure 4 promoted by Donald Trump. It showed up in both
shows the word clouds of the most common hashtags within proscience-right and antiscience-right groups but was not
each group, sized by the frequency of their occurrence. Most discussed by other groups. Overall, these intuitive results
striking was the use of topics related to conspiracy theories, highlight the overall accuracy of our polarization inference
such as #qanon and #wwg1wga by the antiscience-right group, model.
along with politically charged references to the #ccpvirus and
https://www.jmir.org/2021/6/e26692 J Med Internet Res 2021 | vol. 23 | iss. 6 | e26692 | p. 8
(page number not for citation purposes)
XSL• FO
RenderXJOURNAL OF MEDICAL INTERNET RESEARCH Rao et al
Figure 4. Topics of discussion within the six ideological groups. The top row (from left to right) illustrates topics for proscience-left, proscience-moderate,
and proscience-right groups. The bottom row (from left to right) illustrates topics for antiscience-left, antiscience-moderate, and antiscience-right groups.
The polarized nature of the discussions could be seen in the California, Ohio, and Washington reacted early by ordering
users of the hashtags #trumppandemic and #trumpvirus by the lockdowns, the governors of Florida and Mississippi have
left and proscience groups. However, in contrast to antiscience downplayed the gravity of the situation for a longer time. To
groups, proscience groups talked about COVID-19 mitigation explore the geographical variation in ideological alignments,
strategies, using hashtags such as #stayhomesavelives, #staysafe, we grouped users by the state from which they tweeted and
and #flattenthecurve. computed the fraction of their respective state’s Twitter users
belonging to an ideological group. We then generated geo-plots,
Geography of Polarization shown in Figure 5, to highlight the ideological composition of
Responses to the coronavirus pandemic in the United States each state.
have varied greatly by state. While the governors of New York,
https://www.jmir.org/2021/6/e26692 J Med Internet Res 2021 | vol. 23 | iss. 6 | e26692 | p. 9
(page number not for citation purposes)
XSL• FO
RenderXJOURNAL OF MEDICAL INTERNET RESEARCH Rao et al
Figure 5. Fraction of US states' Twitter users per ideological category. Plots (a) to (c) (top row, left to right) show the fraction of states' Twitter users
who were classified as proscience-left, proscience-moderate, and proscience-right, respectively. Plots (d) to (f) (bottom row, left to right) show the
fraction of states’ Twitter users who were classified as antiscience-left, antiscience-moderate, and antiscience-right, respectively. The vertical bars next
to the maps indicate the fraction of Twitter users in the state belonging to the ideological group. Two-letter abbreviations are used for each state.
We saw a higher composition of proscience-moderates, as seen the behaviors of the subset of users being considered in our data
in Figure 5 (b), in Washington, Oregon, DC, and Vermont. As set may not be representative of population behavior. The use
expected, these states had a lower fraction of antiscience users, of geolocation techniques and subsequent consideration of users
as can be seen from Figure 5 (d), (e), and (f). Governors of these with a geolocation could introduce certain biases, which
states were quick to enforce lockdowns and spread pandemic necessitate further investigation.
awareness among the general public.
Thresholds that were used in our LDA analysis of user hashtags
Over the course of the pandemic, we have seen the strong have been set intuitively due to LDA’s prohibitive computation
opposition to masking mandates and closing down of businesses needs when dealing with over 900,000 hashtags. It is unlikely
in California, Nevada, Hawaii, Georgia, and Texas. These that we would have observed significant improvements in
antiscience sentiments are reflected in Figure 5 (e), which shows classification results with different thresholds. However, we
that these states had a comparatively higher proportion of their encourage readers to investigate this further.
Twitter users in the antiscience-moderate ideology group.
Additionally, the seed sets (Table 2) employed for our label
Southern states—South Carolina, Mississippi, Louisiana, Texas, propagation experiments may have had room for bias, as not
and Arizona—and northwestern states—Wyoming, North all PLDs collected had a corresponding Twitter account. The
Dakota, South Dakota, and Montana—have experienced cross-section of PLDs that have a Twitter account could be
COVID-19 surges, with southern states becoming overwhelmed biased by political orientation, age group that the PLD caters
during the summer of 2020 and northwestern states becoming to, etc. Investigation of bias stemming from this is a promising
overwhelmed in the fall of 2020 (Figure S6 in Multimedia prospect for future work. Furthermore, our analyses worked
Appendix 1 shows the cumulative COVID-19 cases per state). under the assumption that media bias ratings provided by Media
The political and religious leaders in these states have also Bias/Fact Check accurately exhibited ideological biases of media
consistently downplayed the pandemic and resisted mitigation sources. Leveraging these ratings, we assumed that generating
strategies. Our results are consistent with this, showing that tweets consisting of PLDs was an expression or reflection of
these states also had more conservative Twitter users who one’s ideological polarity. Future studies can build on these
mistrust science, as manifested by sharing information from assumptions, and interesting avenues can be explored by
antiscience sources. The antiscience attitudes in these states incorporating other indicators of user polarity.
may also spell trouble for vaccination plans. The statistically
Verification of agreement or disagreement of user viewpoint
significant positive correlation (Figure S7 in Multimedia
and content in PLDs being shared was not in the purview of
Appendix 1) between state-wise cumulative COVID-19 case
this study, and we encourage our readers to explore these
counts and antiscience-right users, as well as the negative
avenues in future research. Furthermore, although we showed
correlation between the former and proscience-moderate users,
good performance on classifying polarized opinions, additional
affirms the significance of scientific beliefs in mitigating the
work is required to infer finer-grained opinions. Namely, by
spread of virus.
predicting fine-grained polarization among users, we could
Limitations and Future Directions better infer, for example, network effects, such as whether users
Our novel approach to identify ideological alignments of users prefer to interact with more polarized neighbors, which may
on Twitter comes with certain limitations. Akin to other studies adversely impact provaccine mitigation strategies. Moreover,
involving Twitter data, our study worked under the caveat that longer-term trends need to be explored in order to better
https://www.jmir.org/2021/6/e26692 J Med Internet Res 2021 | vol. 23 | iss. 6 | e26692 | p. 10
(page number not for citation purposes)
XSL• FO
RenderXJOURNAL OF MEDICAL INTERNET RESEARCH Rao et al
understand how opinions change dynamically. This will better information from proscience sources. On the positive side, we
test whether social influence or selective formations of ties are found that the number of proscience, politically moderate users
the drivers of echo chambers and polarization. Finally, there is dwarfed other ideological groups, especially antiscience groups.
a need to explore polarization across countries to understand This is reassuring from the public health point of view,
how different societies and governments are able to address suggesting that a plurality of people are ready to accept scientific
polarization and how these polarized dimensions relate to one evidence and trust scientists to lead the way out of the pandemic.
another across the world. The geographical analysis of polarization identified regions of
the country, particularly in the south and the west where
Conclusions antiscience attitudes are more common, that correlate to areas
Our analysis of a large corpus of online discussions about with particularly high COVID-19 cases, as seen in Figure S6
COVID-19 confirms and extends the findings of opinion polls in Multimedia Appendix 1. Messaging strategies should be
and surveys [9]: opinions about COVID-19 are strongly tailored in these regions to communicate with science skeptics.
polarized along partisan lines. Political polarization strongly Overall, we found that analysis of tweets, while less
interacts with attitudes toward science: conservatives are more representative than surveys, offers inexpensive, fine-grained,
likely to share antiscience information related to COVID-19, and real-time analysis of polarization and partisanship.
while liberal and more moderate users are more likely to share
Acknowledgments
This research was sponsored, in part, by the Air Force Office for Scientific Research under contract FA9550-17-1-0327 and by
DARPA (Defense Advanced Research Projects Agency) under contract W911NF-18-C-0011.
Conflicts of Interest
None declared.
Multimedia Appendix 1
Supplementary materials.
[DOCX File , 706 KB-Multimedia Appendix 1]
References
1. Retracted coronavirus (COVID-19) papers. Retraction Watch. URL: https://retractionwatch.com/
retracted-coronavirus-covid-19-papers/ [accessed 2021-05-28]
2. Schünemann HJ, Akl EA, Chou R, Chu DK, Loeb M, Lotfi T, et al. Use of facemasks during the COVID-19 pandemic.
Lancet Respir Med 2020 Oct;8(10):954-955. [doi: 10.1016/s2213-2600(20)30352-0]
3. Zou L, Dai L, Zhang X, Zhang Z, Zhang Z. Hydroxychloroquine and chloroquine: A potential and controversial treatment
for COVID-19. Arch Pharm Res 2020 Aug;43(8):765-772 [FREE Full text] [doi: 10.1007/s12272-020-01258-7] [Medline:
32740801]
4. Pleyers G. The pandemic is a battlefield. Social movements in the COVID-19 lockdown. J Civ Soc 2020 Aug
06;16(4):295-312 [FREE Full text] [doi: 10.1080/17448689.2020.1794398]
5. Chen E, Lerman K, Ferrara E. Tracking social media discourse about the COVID-19 pandemic: Development of a public
coronavirus Twitter data set. JMIR Public Health Surveill 2020 May 29;6(2):e19273 [FREE Full text] [doi: 10.2196/19273]
[Medline: 32427106]
6. Druckman JN, Klar S, Krupnikov Y, Levendusky M, Ryan JB. Affective polarization, local contexts and public opinion
in America. Nat Hum Behav 2021 Jan;5(1):28-38. [doi: 10.1038/s41562-020-01012-5] [Medline: 33230283]
7. Green J, Edgerton J, Naftel D, Shoub K, Cranmer SJ. Elusive consensus: Polarization in elite communication on the
COVID-19 pandemic. Sci Adv 2020 Jun 24;6(28):eabc2717. [doi: 10.1126/sciadv.abc2717]
8. Jiang J, Chen E, Lerman K, Ferrara E. Political polarization drives online conversations about COVID-19 in the United
States. Hum Behav Emerg Technol 2020 Jun 18:1 [FREE Full text] [doi: 10.1002/hbe2.202] [Medline: 32838229]
9. Funk C, Tyson A. Partisan differences over the pandemic response are growing. Pew Research Center. Washington, DC:
Pew Research Center; 2020 Jun 03. URL: https://www.pewresearch.org/science/2020/06/03/
partisan-differences-over-the-pandemic-response-are-growing/ [accessed 2021-06-07]
10. Gollwitzer A, Martel C, Brady WJ, Pärnamets P, Freedman IG, Knowles ED, et al. Partisan differences in physical distancing
are linked to health outcomes during the COVID-19 pandemic. Nat Hum Behav 2020 Nov;4(11):1186-1197. [doi:
10.1038/s41562-020-00977-7] [Medline: 33139897]
11. Steenhuysen J. Fauci says US political divisions contributed to 500,000 dead from COVID-19. Reuters. 2021 Feb 22. URL:
https://www.reuters.com/article/us-health-coronavirus-fauci/
fauci-says-u-s-political-divisions-contributed-to-500000-dead-from-covid-19-idUSKBN2AM2O9 [accessed 2021-06-07]
https://www.jmir.org/2021/6/e26692 J Med Internet Res 2021 | vol. 23 | iss. 6 | e26692 | p. 11
(page number not for citation purposes)
XSL• FO
RenderXJOURNAL OF MEDICAL INTERNET RESEARCH Rao et al
12. Bessi A, Zollo F, Del Vicario M, Puliga M, Scala A, Caldarelli G, et al. Users polarization on Facebook and Youtube. PLoS
One 2016;11(8):e0159641 [FREE Full text] [doi: 10.1371/journal.pone.0159641] [Medline: 27551783]
13. Baumann F, Lorenz-Spreen P, Sokolov IM, Starnini M. Modeling echo chambers and polarization dynamics in social
networks. Phys Rev Lett 2020 Jan 27;124(4):048301-1-048301-6. [doi: 10.1103/physrevlett.124.048301]
14. Cinelli M, De Francisci Morales G, Galeazzi A, Quattrociocchi W, Starnini M. The echo chamber effect on social media.
Proc Natl Acad Sci U S A 2021 Mar 02;118(9):1-8 [FREE Full text] [doi: 10.1073/pnas.2023301118] [Medline: 33622786]
15. Galen W, Maria G, Tim A. Political bias and factualness in news sharing across more than 100,000 online communities.
ArXiv. Preprint posted online on February 17, 2021. [FREE Full text]
16. Carrieri V, Madio L, Principe F. Vaccine hesitancy and (fake) news: Quasi‐experimental evidence from Italy. Health
Econ 2019 Aug 20;28(11):1377-1382. [doi: 10.1002/hec.3937]
17. twitter-locations-us-state. GitHub. 2020. URL: https://github.com/julie-jiang/twitter-locations-us-state [accessed 2021-05-28]
18. Conover MD, Gonçalves B, Flammini A, Menczer F. Partisan asymmetries in online political activity. EPJ Data Sci 2012
Jun 18;1(1):1-19. [doi: 10.1140/epjds6]
19. Bakshy E, Messing S, Adamic LA. Political science. Exposure to ideologically diverse news and opinion on Facebook.
Science 2015 Jun 05;348(6239):1130-1132. [doi: 10.1126/science.aaa1160] [Medline: 25953820]
20. Barberá P, Jost JT, Nagler J, Tucker JA, Bonneau R. Tweeting from left to right: Is online political communication more
than an echo chamber? Psychol Sci 2015 Oct;26(10):1531-1542. [doi: 10.1177/0956797615594620] [Medline: 26297377]
21. Adamic LA, Glance N. The political blogosphere and the 2004 US election: Divided they blog. In: Proceedings of the 3rd
International Workshop on Link Discovery. 2005 Presented at: 3rd International Workshop on Link Discovery; August 21,
2005; Chicago, IL p. 36-43. [doi: 10.1145/1134271.1134277]
22. Badawy A, Ferrara E, Lerman K. Analyzing the digital traces of political manipulation: The 2016 Russian interference
Twitter campaign. In: Proceedings of the 2018 IEEE/ACM International Conference on Advances in Social Networks
Analysis and Mining. 2018 Presented at: 2018 IEEE/ACM International Conference on Advances in Social Networks
Analysis and Mining; August 28-31, 2018; Barcelona, Spain p. 258-265. [doi: 10.1109/asonam.2018.8508646]
23. Multidimensional-Ideological-Polarization. GitHub. 2020. URL: https://github.com/ashwinshreyas96/
Multidimensional-Ideological-Polarization [accessed 2021-05-28]
24. Boyd D, Golder S, Lotan G. Tweet, tweet, retweet: Conversational aspects of retweeting on Twitter. In: Proceedings of the
43rd Hawaii International Conference on System Sciences. 2010 Jan 05 Presented at: 43rd Hawaii International Conference
on System Sciences; January 5-8, 2010; Koloa, Kauai, HI p. 1-10. [doi: 10.1109/hicss.2010.412]
25. Metaxas P, Mustafaraj E, Wong K, Zeng L, O’Keefe M, Finn S. What do retweets indicate? Results from user survey and
meta-review of research. In: Proceedings of the 9th International AAAI Conference on Web and Social Media. 2015
Presented at: 9th International AAAI Conference on Web and Social Media; May 26-29, 2015; Oxford, UK p. 658-661
URL: https://aaai.org/ocs/index.php/ICWSM/ICWSM15/paper/download/10555/10467
26. Raghavan UN, Albert R, Kumara S. Near linear time algorithm to detect community structures in large-scale networks.
Phys Rev E 2007 Sep 11;76(3):036106-1-036106-11 [FREE Full text] [doi: 10.1103/physreve.76.036106]
27. Blei D, Ng A, Jordan M. Latent Dirichlet allocation. J Mach Learn Res 2003 Jan;3:993-1022 [FREE Full text]
28. Conover MD, Ratkiewicz J, Francisco M, Goncalves B, Flammini A, Menczer F. Political polarization on Twitter. In:
Proceedings of the 5th International AAAI Conference on Weblogs and Social Media. 2011 Jul Presented at: 5th International
AAAI Conference on Weblogs and Social Media; July 17–21, 2011; Barcelona, Spain p. 89-96 URL: https://www.aaai.org/
ocs/index.php/ICWSM/ICWSM11/paper/viewFile/2847/3275
29. Joulin A, Grave E, Bojanowski P, Mikolov T. Bag of tricks for efficient text classification. In: Proceedings of the 15th
Conference of the European Chapter of the Association for Computational Linguistics. 2017 Presented at: 15th Conference
of the European Chapter of the Association for Computational Linguistics; April 3-7, 2017; Valencia, Spain p. 427-431
URL: https://www.aclweb.org/anthology/E17-2068.pdf
30. Mikolov T, Chen K, Corrado G, Dean J. Efficient estimation of word representations in vector space. In: Proceedings of
the 1st International Conference on Learning Representations. 2013 Presented at: 1st International Conference on Learning
Representations; May 2-4, 2013; Scottsdale, AZ p. 1-12 URL: https://arxiv.org/pdf/1301.3781
31. Pennington J, Socher R, Manning C. Glove: Global vectors for word representation. In: Proceedings of the 2014 Conference
on Empirical Methods in Natural Language Processing. 2014 Presented at: 2014 Conference on Empirical Methods in
Natural Language Processing; October 25-29, 2014; Doha, Qatar p. 1532-1543 URL: https://www.aclweb.org/anthology/
D14-1162.pdf [doi: 10.3115/v1/d14-1162]
32. Gupta P, Pagliardini M, Jaggi M. Better word embeddings by disentangling contextual n-gram information. In: Proceedings
of the 2019 Conference of the North American Chapter of the Association for Computational Linguistics: Human Language
Technologies. 2019 Jun Presented at: 2019 Conference of the North American Chapter of the Association for Computational
Linguistics: Human Language Technologies; June 2-7, 2019; Minneapolis, MN p. 933-939 URL: https://www.aclweb.org/
anthology/N19-1098.pdf [doi: 10.18653/v1/n19-1098]
33. Smith L, Zhu L, Lerman K, Kozareva Z. The role of social media in the discussion of controversial topics. In: Proceedings
of the 2013 International Conference on Social Computing. 2013 Presented at: 2013 International Conference on Social
Computing; September 8-14, 2013; Washington, DC p. 236-243. [doi: 10.1109/socialcom.2013.41]
https://www.jmir.org/2021/6/e26692 J Med Internet Res 2021 | vol. 23 | iss. 6 | e26692 | p. 12
(page number not for citation purposes)
XSL• FO
RenderXJOURNAL OF MEDICAL INTERNET RESEARCH Rao et al
Abbreviations
DARPA: Defense Advanced Research Projects Agency
LDA: latent Dirichlet allocation
LPA: label propagation algorithm
PLD: pay-level domain
Edited by C Basch; submitted 22.12.20; peer-reviewed by S Dietze, C García; comments to author 08.02.21; revised version received
01.03.21; accepted 14.04.21; published 14.06.21
Please cite as:
Rao A, Morstatter F, Hu M, Chen E, Burghardt K, Ferrara E, Lerman K
Political Partisanship and Antiscience Attitudes in Online Discussions About COVID-19: Twitter Content Analysis
J Med Internet Res 2021;23(6):e26692
URL: https://www.jmir.org/2021/6/e26692
doi: 10.2196/26692
PMID: 34014831
©Ashwin Rao, Fred Morstatter, Minda Hu, Emily Chen, Keith Burghardt, Emilio Ferrara, Kristina Lerman. Originally published
in the Journal of Medical Internet Research (https://www.jmir.org), 14.06.2021. This is an open-access article distributed under
the terms of the Creative Commons Attribution License (https://creativecommons.org/licenses/by/4.0/), which permits unrestricted
use, distribution, and reproduction in any medium, provided the original work, first published in the Journal of Medical Internet
Research, is properly cited. The complete bibliographic information, a link to the original publication on https://www.jmir.org/,
as well as this copyright and license information must be included.
https://www.jmir.org/2021/6/e26692 J Med Internet Res 2021 | vol. 23 | iss. 6 | e26692 | p. 13
(page number not for citation purposes)
XSL• FO
RenderXYou can also read


