Population Genetic Structure of Wild Boar And Dispersal Performance Based On Kinship Analysis In The Northern Region of South Korea
←
→
Page content transcription
If your browser does not render page correctly, please read the page content below
Population Genetic Structure of Wild Boar And
Dispersal Performance Based On Kinship Analysis
In The Northern Region of South Korea
Seung Woo Han ( hsw5034@naver.com )
Seoul National University College of Veterinary Medicine https://orcid.org/0000-0002-7148-4087
Han Chan Park
Yeongnam Daehakgyo: Yeungnam University
Jee Hyun Kim
Seoul National University College of Veterinary Medicine
Jae Hwa Suh
NIBR: National Institute of Biological Resources
Hang Lee
Seoul National University College of Veterinary Medicine
Mi Sook Min
Seoul National University College of Veterinary Medicine
Research Article
Keywords: Wild boar, Microsatellites, Population Genetics, Dispersal, Kinship Analysis, Conservation
Genetics
Posted Date: May 7th, 2021
DOI: https://doi.org/10.21203/rs.3.rs-368091/v1
License: This work is licensed under a Creative Commons Attribution 4.0 International License.
Read Full License
Page 1/16
Abstract
Wild boar (Sus scrofa) is one of the most challenging mammalian species to manage in the wild because
of its high reproductive rate, population density, and lack of predators in much of its range. A recent
outbreak of African swine fever (ASF) and the transmission into domestic pigs in commercial farms
empower the necessity of establishing management strategies of the wild boar population in the northern
region of South Korea. A population genetic study, including the dispersal distance estimation of wild
boars, is required to prepare fine-scale population management strategies in the region. In this study, both
population structure analysis and dispersal distance estimation based on kinship were conducted using
13 microsatellite markers. The results revealed a high level of genetic diversity compared to a previous
study. The population was not structured obviously, but there was a slight level of genetic differentiation
between groups mainly formed by isolation by distance rather than mountain ridges. The dispersal
distance estimation of Korean wild boars based on kinship analysis showed a philopatric pattern in
females. However, extensive dispersal ability in both sexes was observed with a considerable proportion.
The population genetic status and dispersal traits of wild boars may provide valuable data for planning
detailed ASF and wild boar population management strategies in South Korea.

Introduction
Wild boar (Sus scrofa Linnaeus, 1758) is one of the most extensively distributed, large-sized mammalian
species worldwide. Being highly viable and having a high reproductive rate, wild boar spreads its range
across most European and Asian regions and the northern part of Africa as native species. Besides, there
are introduced populations thriving in the Americas and Australia (Massei and Genov 2004). African
swine fever (ASF) is a highly fatal disease for species within the genus Sus, including wild boars and
domestic pigs. After the initial outbreak in Georgia in 2007 (Jo and Gortázar 2020), the ASF virus (ASFV)
spread quickly all over Eurasia. The virus spread in western European countries in 2014, followed by
eastward spread to China in 2018. The first detection of ASFV was near the Demilitarized Zone (DMZ) in
the northern part of South Korea in 2019, spreading toward South Korea’s southern region. As wild boars
can share ASFV with domestic pigs, the spread of disease in wild boars may cause massive economic
damage in the swine industry (Cadenas-Fernández et al. 2019).

Therefore, basic information on the species and population biology of wild boars is required to develop a
control strategy against ASF in South Korea. A previous study demonstrated that the South Korean wild
boar population showed discrete clustering from China, Russia, Indonesia, and Japan, asserting Taebaek
Mountain ridges as a gene flow barrier within the South Korean populations (Choi et al. 2014). However,
the relatively small number of South Korean samples used in the study is a limiting factor in interpreting
the results.

Studies that have described the ecological traits of wild boars in South Korea using ecological methods
have been published (Park and Lee 2003; Choi et al. 2006; Lee 2013; Kim et al. 2019). Although several
studies about the dispersal ability of wild boars have been conducted in other countries, no such

                                                  Page 2/16
information is available in South Korea. A study on the home range size of wild boars in South Korea
reported four individuals inhabiting 5.13 km2 on average (Choi et al. 2006). However, this research was
conducted with a small sample size using the radio-tracking technique within a limited study area and
time frame. Although a recent study about habitat preference demonstrated that wild boars prefer ridge
mountain environments with substantial food resources (Kim et al. 2019), further studies must establish
detailed control strategies for diseases mediated by wild boars in South Korea. Because the spread of
infectious diseases in wild animals is closely linked to the dispersal ability of the animals and the gene
flow pattern within the frame of the population structure, information on the dispersal distance and
pattern and the genetic structure of wild boars has the potential to contribute to the effective disease
control strategy.
Microsatellite marker is a convenient tool for population and ecological genetic studies. These
polymorphic markers, which can estimate the recent history of genetic differentiation at the population
level, are widely used in numerous studies to demonstrate the population structure of wild animals in
South Korea (Lee et al. 2011; Jo et al. 2017; Hong et al. 2018; Lee et al. 2019). Moreover, a set of
microsatellite markers was developed for swine biodiversity applications (Committee 2004). The
usefulness of these microsatellite markers has been verified by numerous population genetic studies of
wild boars (Costa et al. 2012; Choi et al. 2014; Delgado-Acevedo et al. 2021). Dispersal distance
estimation with kinship analysis using polymorphic markers has been reported previously for several
species (Cayuela et al. 2018). With a sufficient number of samples, this genetic method enables
estimating dispersal distance.
This study investigated the genetic diversity and population structure of the wild boar population in the
northern part of South Korea (Gyeonggi and Gangwon provinces) and estimated the dispersal distance
based on kinship analysis of 474 wild boar carcass tissue samples using 13 microsatellite markers.
Materials And Methods
Sample collection
Muscle tissue samples from 474 wild boar carcasses, hunted in Gyeonggi and Gangwon provinces by
licensed local hunters from November 2019 until May 2020, were collected by NIBR (National Institute of
Biological Resources) for DNA extraction. All the hunting activities were done with a permit from local
governments and no specific approval was required for the wild boar carcass sampling in this study. For
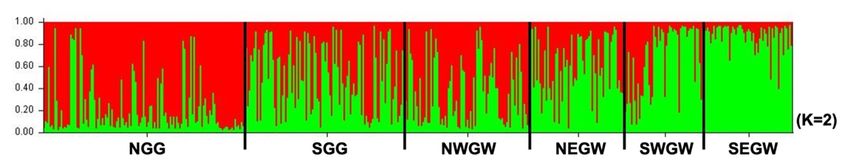
both genetic structure and distance distribution analyses, samples were divided into 6 geographical
groups with similar area sizes (Fig. 1). For the Isolation by Distance (IBD) analysis, 474 samples were
reassigned into 24 geographical groups, each group with a minimum of 15 samples in a city size area
(Table S1, Fig. S1).
PCR amplification and genotyping
Page 3/16DNA was extracted using a QuickGene DNA tissue kit (Fujifilm, Tokyo, Japan). Total 13 microsatellite
markers developed for swine biodiversity research (Committee 2004) were used. The fluorescent-dye-
labeled markers were amplified using a multiplex PCR kit (QIAGEN). PCR was conducted with touchdown
method under the following conditions: initial denaturation for 15 min at 95°C, followed by 7 touchdown
cycles starting from 94°C for 30 s, 67°C for 90 s, and 72°C for 60 s, with annealing temperature
decreasing by 2°C per cycle to 53°C. The additional 25 cycles were performed at 94°C for 30 s, 53°C for
90 s, 72°C for 60 s, and a final extension step at 60°C for 30 min. PCR products were loaded onto a DNA
Sequencer (ABI Prism 3730 XL DNA Analyzer, Applied Biosystems) for genotyping. Allele size was
determined using GeneMapper v.3.7 (Chatterji and Pachter 2006).
For sexing, newly developed primers for wild boars that amplify intron 7 flanking regions of ZFX and ZFY
genes (Han et al. 2007) were used. The PCR condition for sexing was the same as in the referenced
paper. The PCR products were loaded onto EtBr agarose gel to distinguish double bands for males from a
single band for females by agarose gel electrophoresis.
Data analysis
Genetic structure analysis
Genotype data from 474 wild boars were integrated with GenAlex v.6.503 (Peakall and Smouse 2006) for
obtaining the population genetics parameters such as allele frequencies, expected heterozygosity, and
observed heterozygosity under Hardy–Weinberg assumptions. Hardy–Weinberg Equilibrium (HWE) test
and null allele test were conducted via GENEPOP v.4.7 (Raymond 1995). The sequential Bonferroni
correction was applied to take account of statistical errors for multiple tests (Rice 1989). Genetic
structure was estimated with STRUCTURE v.2.3.4 (Pritchard et al. 2000), and an optimal K value was
estimated with STRUCTURE HARVESTER using the Evanno method (Evanno et al. 2005; Earl 2012). We
used the initial burn-in period of 100,000, followed by 200,000 MCMC (Markov Chain Monte Carlo)
iterations with 10 iterations per K. We calculated pairwise FST values between each of the 6 preliminary
estimated groups with FSTAT v.2.9.4 (Goudet 1995) based on 5,000 permutations. Based on the pairwise
FST values, Nm values were calculated with the equation of Nm=1/4{(1 - FST)/FST}, as an indirect index of
a gene flow. Additionally, Slatkin’s linearized pairwise FST values were calculated with 10,000
permutations between 24 groups assigned for IBD analysis using Arlequin v.3.5.2.2 (Excoffier et al. 2005).
We conducted a Mantel test with 999 permutations using GenAlex v.6.503 to estimate IBD to establish
the relationship between genetic and geographic distance matrices.
Dispersal distance analysis
The kinship relationship between individuals was estimated with ML-RELATE software (Kalinowski et al.
2006). This program calculates the maximum likelihood estimates of relatedness among 4 putative
relationships: parent–offspring (PO), full-siblings (FS), half-siblings (HS), and unrelated (U). The
relationship that is found to be most likely true is selected based on a pair’s occupation in “k-space,”
where k represents the possible relationship between two individuals. We selected PO pairs based on the
Page 4/16confidence set option (0.05 level of significance). Based on GPS data, we calculated the linear distance
between PO-paired individuals, and the proportion by distance was indicated with deflected line graphs
according to sex.
Results
Genetic diversity
Using the genotype data of 474 wild boar samples obtained by 13 microsatellite markers, population
genetics statistics were calculated as shown in Table 1. The number of alleles ranged from 5 at the locus
Sw72 to 12 at the locus S0068 with an average 7.7 alleles/locus. Out of 100 alleles in total, 14 were
private ones observed only in a single out of 6 groups. A low proportion of private alleles was observed
for all groups, with the highest frequency of 5% in SGG (Southern Gyeonggi).
Table 1 Descriptive statistics for 13 microsatellite loci of the wild boar population in northern region of
South Korea
Locus N NA NE HO HE FIS HWE P-value
S0026 474 8 5.630 0.778 0.822 0.020 0.0289
S0068 474 12 4.129 0.732 0.758 0.021 0.2027
S0155 474 7 3.277 0.705 0.695 0.028 0.6603
IGF1 474 6 2.285 0.544 0.562 0.015 0.0779
Sw240 474 7 4.932 0.751 0.797 0.059 0.0085*
Sw857 474 6 3.096 0.599 0.677 0.063 0.0042*
Sw24 474 11 5.250 0.749 0.810 0.044 0.0000*
Sw632 474 9 3.077 0.656 0.675 0.011 0.0521
Swr1941 474 6 2.698 0.597 0.629 0.017 0.0328
S0143 474 7 4.322 0.698 0.769 0.066 0.0000*
S0226 474 10 3.420 0.684 0.708 0.023 0.0604
Sw72 474 5 3.246 0.643 0.692 0.044 0.0119
S0090 474 6 4.118 0.736 0.757 0.007 0.0077*
Total 474 7.7 3.806 0.682 0.719 0.032
N: Number of samples, NA: number of alleles, NE: number of effective alleles, HO: observed heterozygosity,
HE: expected heterozygosity, FIS: inbreeding coefficient, HWE P-value: the probability of Hardy-Weinberg
Page 5/16equilibrium, *Significant after Bonferroni correction (P
Pie charts shown in Fig. 1 represent the distribution of genetic clusters throughout the studied sample
groups using the STRUCTURE analysis. The structure pattern and the optimal number of genetic clusters
were determined within six groups using a Bayesian clustering method. According to the Evanno method,
the highest ΔK was observed when K was set to 2 (Fig. S2). Recruiting from the two genetic clusters
gradually changed from NGG to SEGW group (Fig. 2). Although there was no obvious clustering within
the groups, the difference in the two genetic clusters’ contribution in their genotypes is obvious.

In IBD analysis, 24 groups modified according to city-sized scale were used for the Mantel test between
geographic and Slatkin’s linearized pairwise FST. Significant correlation between genetic and geographic
distances was observed (P-value = 0.001, R2 = 0.2098, Fig. 3). This pattern corresponded with the
STRUCTURE analysis result, in which the genetic clustering pattern showed gradual diagonal line
according to the geographic distances between groups.

Distance distribution through kinship analysis

In total, 139 pairs of PO were selected using kinship analysis across six groups. When gender data were
applied, 41 pairs of female-female (FF), 34 pairs of male-male (MM), and 64 pairs of female-male (FM)
were found. Under the presumption of the PO relationship, an FF pair was presumed to be mother-
daughter, an MM pair was assumed to be father-son, and an FM pair was considered either father-
daughter or mother-son. As FM pair data contain two possible mixed relationships of father-daughter and
mother-son, this study mainly focused on FF and MM data to infer sex-specific dispersal distance. The
proportion of the linear distance between PO individuals according to sex is shown in Fig. 4a and b.
About 70% of all kinds of PO pairs were observed within a 30 km linear distance (Fig. 4c and d). In the FF
pair, about 60% were observed in less than 20 km distance and about 70% were observed in 30 km
distance (Fig. 4b). In contrast, approximately 40% of the MM pair distance was less than 20 km and 60%
was within 30 km, which showed a philopatric aspect of female wild boars. A considerable proportion of
long dispersal was also observed. Both 20% of FF and MM were dispersed more than 30 km, further
dispersing more than 50 km (5%).

Discussion
The genetic diversity, population structure, and dispersal distances at the individual level of the wild boar
population in the northern part of South Korea were estimated through genetic analysis. Because ASF is
spreading mainly in the study area, the information is expected to give meaningful insight in formulating
the disease management strategy. The 13 microsatellite loci analysis results showed that the wild boar
population in the study area was not obviously structured, and relatively high dispersal distances were
observed.

The genetic statistics of 13 microsatellite markers across the whole population pointed out a slightly
higher level of diversity compared to the previous report (current study: NA = 7.7, HO = 0.682, HE = 0.719;
Choi et al.’s 2014 study with the same set of 13 microsatellite markers: NA = 5.5, HO = 0.639, HE = 0.666).

                                                  Page 7/16
The difference might be explained partially by different sample sizes, different sampling times, or
different sampling sites covered. Especially, much more samples were covered in the current study (474
in this study vs. 70 in the 2014 study). Five of 13 loci (Sw240, Sw857, Sw24, S0143, and S0090) showed
a deviation of HWE due to heterozygosity deficiency. This generally implicates the possibility of
inbreeding, population structure subdivisions within the population (Wahlund effect), or sampling error
(Waples 2015).
When the inbreeding coefficient was examined, all markers showed low FISvalues. The extant wild boar
population in most Gyeonggi and Gangwon provinces has recently experienced rapid population density
growth (Choe et al. 2020). The population might also have experienced high hunting pressure expediting
the dispersal and migration of individuals (Scillitani et al. 2010). Considering these factors, we surmised
that the influence of inbreeding was low. Instead, we focused on the possibility of the recent admixture of
population substructure being the main reason for Hardy-Weinberg deviation.
There was a slight level of population subdivision by structure analysis. Although a clear differentiation
between groups was not observed, a considerable level of genetic distance was seen between the most
distant groups (pairwise FST values between NGG and SEGW = 0.0405). Also, the bar plot of K = 2 from
the structure analysis showed a gradual diagonal line between these two groups whose cluster was quite
different. These data support our IBD analysis results that the physical distance has the most significant
correlation with genetic distance. A previous study suggested that mountain ridges could act as a genetic
flow barrier to wild boar populations (Choi et al. 2014), but this assumption appears to be rebutted by our
results because the groups divided by the Taebaek Mountains (NWGW and SWGW vs. NEGW and SEGW)
showed no differentiation (mean pairwise FST = 0.0152).
These results correspond with a previous study conducted in Bulgaria (Nikolov et al. 2009), where the
Balkan mountain range was not a physical barrier for the genetic flow of the wild boar population in
Bulgaria. Still, the main factors contributing to the population structure were both IBD and Thracian
Valley. Also, in Croatia, Dinaric Mountains had a weak effect than IBD on the wild boar population
differentiation (Šprem et al. 2016). Likewise, the result supports the physical distance rather than
mountain ridges contributed to genetic distance. However, it cannot be excluded that the observed low
population differentiation level might be caused by a high level of dispersal and migration of individuals
promoted by the recent population growth and hunting pressure mentioned earlier.
Dispersal of subadult animals from their native places is an essential contributing factor to transmitting
infectious diseases among wild animal populations. Therefore, estimating the dispersal pattern and
distance of wild animals can provide an important insight required to control the infectious diseases in
wild animals. However, it requires considerable resources to acquire information on the dispersal of large-
sized wild mammalian species through ecological methods, and there has been little such information for
wild boars in South Korea, where ASF is spreading from the DMZ area to the south. Thus, we attempted
to infer the dispersal distances of the wild boar population in the northern part of South Korea by
estimating the linear distance between PO pairs with the highest relationship based on kinship analysis.
Page 8/16About 70% of all PO pairs showed less than 30 km linear distances. The result implies that wild boars in
the northern part of South Korea generally disperse less than 30 km. The results are in accordance with
the previous ecological study in Sweden reporting that wild boars disperse 16.6 km for adult males and
4.5 km for adult females (Truvé and Lemel 2003).
The distances between F-F pairs most likely reflect the dispersal distances of daughters from their
mothers; about 60% of the F-F pairs were observed in less than 20 km distance and approximately 70% of
the F-F pairs were observed within 30 km. The distances between M-M pairs most likely reflect the
dispersal distances of sons from their fathers; about 40% of the M-M pair distance was less than 20 km,
and about 60% of the M-M pair distance was less than 30 km. The result implies that the proportion of
short distance dispersal (30 km) in males and females was quite similar (~20%), and approximately 5% of both males
and females dispersed longer than 50 km. The results suggest that a considerable proportion of the wild
boar population in the northern part of South Korea disperse long distances regardless of sex. However,
we should keep in mind that all wild boar samples used in this study were obtained through hunting
activities by local hunters. Consequently, intense hunting pressure over the sample area can increase the
animal dispersal rate (Scillitani et al. 2010). More detailed results of PO individuals may be drawn if
sufficient information is included in a potential parent-offspring analysis and a sufficient number of
markers (15–20 polymorphic microsatellite loci) are used (Kalinowski et al. 2006; Cayuela et al. 2018).
Nevertheless, when a sufficient number of samples are obtained, the dispersal of wild boar males may
reach more than 100 km (Truvé and Lemel 2003). In rare cases, though, even further dispersal of female
wild boars was observed. A sounder composed of a 2-year-old sow, a female yearling, and eight piglets
was found foraging 100 km from a predispersal home range for 5 months (Jerina et al. 2014). A sow
eventually moved at least 500 km cumulative distance until death from culling. Yet, in another research
performed in Spain, the average dispersal distance of female wild boars (57.7 km) exceeded males’
dispersion (Casas-Díaz et al. 2013). Therefore, the potential existence of very long-dispersing individuals
should be considered in formulating a wild boar disease control strategy.
Conclusions
To collect basic information toward understanding the wild boar population in the northern region of
South Korea, this study was conducted to estimate the dispersal distance with kinship analysis, and the
genetic diversity and population structure were also investigated with 13 microsatellite markers. The wild
boar population showed no apparent signs of genetic subdivision, although a low level of population
differentiation was detected. The major factor of genetic differentiation within the study sites was
Page 9/16physical distance rather than mountain ridges. Most PO pairs showed a short dispersal distance, with a
higher tendency of short dispersal in females than in males. However, a considerable proportion of long
dispersal cases was observed regardless of sex, suggesting an extensive dispersal ability of wild boars in
the northern part of South Korea. Information needs to be considered in planning control strategies
against ASF.
Declarations
Acknowledgments
We thank Dr. Puneet Pandey for his valuable comments on this manuscript. This work was supported by
the grant from the National Institute of Biological Resources (NIBR), funded by the Ministry of
Environment (MOE) of the Republic of Korea (NIBR202002111).
Funding
This work was supported by the grant from the National Institute of Biological Resources (NIBR), funded
by the Ministry of Environment (MOE) of the Republic of Korea (NIBR202002111).
Conflict of interest
The authors declare that they have no conflict of interests.
Data availability
All datasets generated during the current study are available from the corresponding author on
reasonable request.
Code availability
Not applicable
Author contributions
All authors substantially contributed to this research. MSM and JHS designed the project. Samples were
collected by JHS. SWH and JHK conducted experiments. SWH, HCP, JHK analyzed experiment data. SWH
wrote the first draft of the manuscript. All authors (SWH, HCP, JHK, JHS, HL, and MSM) fully participated
in the editing process of the manuscript and approved the final manuscript.
Ethics approval
Not applicable
Consent to participate
Page 10/16All authors provided informed consent to participate to the present work.
Consent for publication
All authors provided informed consent to publish the present work.
References
1. Cadenas-Fernández E, Sánchez-Vizcaíno JM, Pintore A, Denurra D, Cherchi M, Jurado C, Vicente J,
Barasona JA (2019) Free-ranging pig and wild boar interactions in an endemic area of African swine
fever. Front Vet Sci 6:376. https://doi.org/10.3389/fvets.2019.00376
2. Casas-Díaz E, Closa-Sebastià F, Peris A, Miño A, Torrentó J, Casanovas R, Marco I, Lavín S,
Fernández-Llario P, Serrano E (2013) Recorded dispersal of wild boar (Sus scrofa) in Northeast
Spain: implications for disease-monitoring programs. Wildl Biol Pract 9:19–26
3. Cayuela H, Rougemont Q, Prunier JG, Moore JS, Clobert J, Besnard A, Bernatchez L (2018)
Demographic and genetic approaches to study dispersal in wild animal populations: A
methodological review. Mol Ecol 27:3976–4010. https://doi.org/10.1111/mec.14848
4. Chatterji S, Pachter L (2006) Reference based annotation with GeneMapper. Genome Biol 7:1–10
5. Choe S, Cha RM, Yu DS, Kim KS, Song S, Choi SH, Jung BI, Lim SI, Hyun BH, Park BK, An DJ (2020)
Rapid spread of classical swine fever virus among South Korean wild boars in areas near the border
with North Korea. Pathogens 9:244. https://doi.org/10.3390/pathogens9040244
6. Choi SK, Lee JE, Kim YJ, Min MS, Voloshina I, Myslenkov A, Oh JG, Kim TH, Markov N, Seryodkin I,
Ishiguro N, Yu L, Zhang YP, Lee H, Kim KS (2014) Genetic structure of wild boar (Sus scrofa)
populations from East Asia based on microsatellite loci analyses. BMC Genet 15:85.
https://doi.org/10.1186/1471-2156-15-85
7. Choi TY, Lee YS, Park CH (2006) Home-range of wild boar, Sus scrofa living in the Jirisan National
Park, Korea. J Ecol Environ 29:253–257
8. Committee IFS (2004) Secondary guidelines for development of national farm animal genetic
resources management plans. Measurement of domestic animal diversity (MoDAD): recommended
microsatellite markers. FAO, Rome
9. Costa V, Pérez-González J, Santos P, Fernández-Llario P, Carranza J, Zsolnai A, Anton I, Buzgó J,
Varga G, Monteiro N, Beja-Pereira A (2012) Microsatellite markers for identification and parentage
analysis in the European wild boar (Sus scrofa). BMC Res Notes 5:479.
https://doi.org/10.1186/1756-0500-5-479
10. Delgado-Acevedo J, Zamorano A, DeYoung RW, Campbell TA (2021) Genetic population structure of
wild pigs in Southern Texas. Animals 11:168. https://doi.org/10.3390/ani11010168
11. Earl DA, vonHoldt BM (2012) STRUCTURE HARVESTER: a website and program for visualizing
STRUCTURE output and implementing the Evanno method. Conserv Genet Resour 4:359–361.
https://doi.org/10.1007/s12686-011-9548-7
Page 11/1612. Evanno G, Regnaut S, Goudet J (2005) Detecting the number of clusters of individuals using the
software STRUCTURE: a simulation study. Mol Ecol 14:2611–2620. https://doi.org/10.1111/j.1365-
294X.2005.02553.x
13. Excoffier L, Laval G, Schneider S (2005) Arlequin. 3.0 version: an integrated software package for
population genetics data analysis. Evolutionary bioinformatics. p. 1
14. Goudet J (1995) FSTAT. 1.2 version: a computer program to calculate F-statistics. J Hered 86:485–
486
15. Greenwood PJ (1980) Mating systems, philopatry and dispersal in birds and mammals. Anim behav
28:1140–1162
16. Han S-H, Lee S-S, Cho I-C (2007) SINE-like sequence insertion on zinc finger-Y gene and sexual
dimorphism in wild boars. J Appl Anim Res 32:165–168.
https://doi.org/10.1080/09712119.2007.9706869
17. Hong YJ, Kim KS, Min MS, Lee H (2018) Population structure of the raccoon dog (Nyctereutes
procyonoides) using microsatellite loci analysis in South Korea: implications for disease
management. J Vet Med Sci 80:1631–1638. https://doi.org/10.1292/jvms.17-0456
18. Jerina K, Pokorny B, Stergar M (2014) First evidence of long-distance dispersal of adult female wild
boar (Sus scrofa) with piglets. Eur J Wildl Res 60:367–370. https://doi.org/10.1007/s10344-014-
0796-1
19. Jo YS, Gortázar C (2020) African swine fever in wild boar, South Korea, 2019. Transbound Emerg Dis
67:1776–1780. https://doi.org/10.1111/tbed.13532
20. Jo Y-S, Kim H-N, Baccus JT, Jung J (2017) Genetic differentiation of the Korean striped field mouse,
Apodemus agrarius (Muridae, Rodentia), based on microsatellite polymorphism. Mammalia 81:297–
307. https://doi.org/10.1515/mammalia-2015-0152
21. Kalinowski ST, Wagner AP, Taper ML (2006) ML-Relate: a computer program for maximum likelihood
estimation of relatedness and relationship. Mol Ecol Notes 6:576–579.
https://doi.org/10.1111/j.1471-8286.2006.01256.x
22. Kim Y, Cho S, Choung Y (2019) Habitat preference of wild boar (Sus scrofa) for feeding in cool-
temperate forests. J Ecol Environ 43:1–8
23. Lee SM (2013) Home range, diet, and crop damage of wild boar (Sus scrofa) in Geochang county,
Gyeongnam, Korea. Dissertation, Seoul National University
24. Lee SM, Moon HC, Jeon HS, Song EG, Woo D, An J, Lee MY (2019) A core set of microsatellite loci for
yellow-throated marten, Martes flavigula: a case of inferences of family relationships. Genes
Genomics 41:1457–1465. https://doi.org/10.1007/s13258-019-00869-9
25. Lee Y-S, Choi S-K, An J, Park H-C, Kim S-I, Min M-S, Kim K-S, Lee H (2011) Isolation and
characterization of 12 microsatellite loci from Korean water deer (Hydropotes inermis argyropus) for
population structure analysis in South Korea. Genes Genomics 33:535–540.
https://doi.org/10.1007/s13258-010-0166-7
26. Massei G, Genov PV (2004) The environmental impact of wild boar. Galemys 16:135–145
Page 12/1627. Nikolov IS, Gum B, Markov G, Kuehn R (2009) Population genetic structure of wild boar Sus scrofa in
Bulgaria as revealed by microsatellite analysis. Acta Theriol 54:193–205.
https://doi.org/10.4098/j.at.0001-7051.049.2008
28. Park C-R, Lee W-S (2003) Development of a GIS-based habitat suitability model for wild boar Sus
scrofa in the Mt. Baekwoonsan region, Korea. Mamm Study 28:17–21.
https://doi.org/10.3106/mammalstudy.28.17
29. Peakall R, Smouse PE (2006) GenAlEx 6: genetic analysis in Excel. Population genetic software for
teaching and research. Mol Ecol Notes 6:288–295. https://doi.org/10.1111/j.1471-
8286.2005.01155.x
30. Pritchard JK, Stephens M, Donnelly P (2000) Inference of population structure using multilocus
genotype data. Genetics 155:945–959
31. Raymond M (1995) GENEPOP. 1.2 version: population genetics software for exact tests and
ecumenicism. J Hered 86:248–249
32. Rice WR (1989) Analyzing tables of statistical tests. Evolution 43:223–225
33. Scillitani L, Monaco A, Toso S (2010) Do intensive drive hunts affect wild boar (Sus scrofa) spatial
behaviour in Italy? Some evidences and management implications. Eur J Wildl Res 56:307–318.
https://doi.org/10.1007/s10344-009-0314-z
34. Šprem N, Safner T, Treer T, Florijančić T, Jurić J, Cubric-Curik V, Frantz AC, Curik I (2016) Are the
dinaric mountains a boundary between continental and mediterranean wild boar populations in
Croatia? Eur J Wildl Res 62:167–177. https://doi.org/10.1007/s10344-016-0989-x
35. Truvé J, Lemel J (2003) Timing and distance of natal dispersal for wild boar Sus scrofa in Sweden.
Wildl Biol 9:51–57. https://doi.org/10.2981/wlb.2003.056
36. Waples RS (2015) Testing for Hardy–Weinberg proportions: have we lost the plot? J Hered 106:1–
19. https://doi.org/10.1093/jhered/esu062
Figures
Page 13/16Figure 1
Study areas, including geographic features with sample size. Thick green lines represent Taebaek
Mountains, while blue lines represent the Han River with its tributaries. Each pie chart shows the
proportion of genetic clusters shown in Fig. 2. Check location abbreviations in Table 2 Note: The
designations employed and the presentation of the material on this map do not imply the expression of
any opinion whatsoever on the part of Research Square concerning the legal status of any country,
territory, city or area or of its authorities, or concerning the delimitation of its frontiers or boundaries. This
map has been provided by the authors.
Figure 2
Page 14/16Bar plots of wild boar populations recruiting from 2 genetic clusters as obtained by STRUCTURE v.2.3.4
analysis. The optimal number of K was approximately K=2. Check location abbreviations in Table 2
Figure 3
Isolation by Distance (IBD) analysis between genetic and geographic distances based on Mantel test with
999 permutations. Slatkin’s linearized FST (D=FST/(1-FST )) were used
Page 15/16Figure 4
Distribution of distance proportions per 10 km sections according to sex. The triangle refers to a female-
female pair, square refers to a male–male pair, while diamond refers to a female-male pair. b) Cumulative
proportion of distance according to sex. c) Sex-integrated distribution of distance. d) Sex-integrated
cumulative proportion of distance
Supplementary Files
This is a list of supplementary files associated with this preprint. Click to download.
Supplementarymaterial.docx
Page 16/16You can also read