Predicting the Academy Awards' result by analyzing tweets
←
→
Page content transcription
If your browser does not render page correctly, please read the page content below
Global Journal of Science, Engineering and Technology (ISSN : 2322-2441)
   Issue 8, 2013 , pp. 39-47
   © GJSET Publishing, 2013.
   http://www.gjset.org

      Predicting the Academy Awards’ result by analyzing tweets

                                    Abouzar Abbaspour Ghomi
                             Student of MSc of Software Engineering
                    University of Tehran International Kish Campus, Kish, Iran
                                    Abbaspourghomi@ut.ac.ir

                                          Ehsan Shirzadi
                             Student of MSc of Software Engineering
                    University of Tehran International Kish Campus, Kish, Iran
                        Ehsan.Shirzadi@ut.ac.ir, www.EhsanShirzadi.com

                                        Afagh Movassaghi
                             Student of MSc of Software Engineering
                    University of Tehran International Kish Campus, Kish, Iran
                                      a.movassaghi@ut.ac.ir

Abstract: - the innovation of internet cause too many important things to be possible. But one of the main
goals of internet was bringing people together. As internet provides infrastructure for different people to
connect each other their diversities come to play and brings some mentionable cases to study. Some
studies show “wonders of aggregation“ meaning that decision of a group of people can be more accurate
than individuals. In this paper we examines a theory that says crowd of people can predict an event or for
example they could votes which nominee will win and award and most of the times it could be true and
this result can come from the social interaction between friends and people.

Key-Words: - Twitter, Forecast, Wisdom of crowd, Crowdsourcing, Social network

                                                           interactions.
1. INTRODUCTION                                            Many schedule event will happen during a year.
You know someone but you don’t know him                    For example different award shows that have
exactly.                                                   multiple nominees. People will talk about their
 As a matter of fact you just know his or her              favorite nominees by sharing tweets via twitter.
name. where do you go to find out what does                As different people use twitter in different
he/she like.                                               situations, by studying these tweets we could find
Social networks, Simple answer, think about if             out what is happening in that location and we
you know what do all the people of small city              may predict the events that could happen as the
like or want it to have, what major did they study.        result of different people’s ideas that could
What could you do with it. By studying such a              translate to actions.
society you could find out the next big thing. By          Al tahrir square was an event that could be related
studying the pattern of thought and analyzing the          to strong activity of youth of Egypt in twitter.
text that they are sharing each day via different          And twitter being a major factor for protesters to
social networks. Twitter has being part of these           get the latest news an know the location and the
social networks is a preferable place for                  time of next protest.
researchers to study diverse cases of human                In this article we gathered a large amount of

                                                      39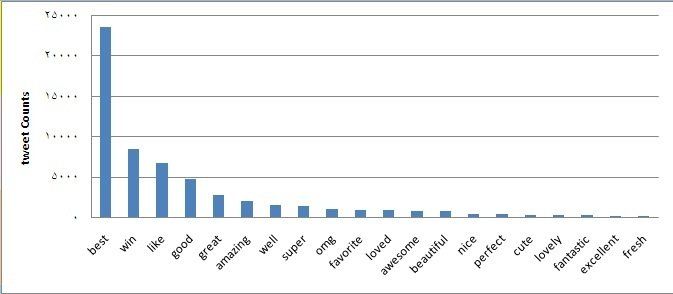
Global Journal of Science, Engineering and Technology (ISSN : 2322-2441)
   Issue 8, 2013 , pp. 39-47
   © GJSET Publishing, 2013.
   http://www.gjset.org

tweets in a week before academic awards 2013.              have boycotted the ceremonies and refused to
And we analyzed the data which is the text that            accept their Oscars. For example Marlon Brando
has been tweeted by users and we predicted that            refused his award( best actor in 1972 for the
which nominee would win the Oscars. We                     godfather ), citing the film industry's
compared it with the real results. In section 2 we         discrimination and mistreatment of native
will introduce some of typology of forecasting             Americans. Tim Dirks , editor of AMC's
election models.                                           filmsite.org has written of the academy awards,
In section 3 we will talk about how                        un fortunately the critical worth ,artistic vision
crowdsourcing and wisdom of crowd could help               ,cultural influence , and innovative qualities of
us to forecast an election. In another section we          many films are not given the same voting weight .
will showcase the analyzes that we have done on            especially since the 1980s , moneymaking
our dataset. Finally we will conclude our results.         "formula-made" blockbusters with glossy
                                                           production values have often been crowd-
 a. Academy awards                                         pleasing titans(and best picture winners), but they
                                                           haven't necessarily been great films with depth or
The academy awards , now officially known as
                                                           critical acclaim by any measure.
the Oscars , are a set of awards given annually for
excellence of cinematic achievements.
 The Oscar statuette is officially named the
Academy Award of Merit and is one of nine types
of Academy Awards. Organized and overseen by               2. A typology of election forecasting
the academy of motion picture and sciences                                 models
(AMPAS),the awards are given each year at a                There are many election forecasting models
formal ceremony.                                           [11][12]. The forecasting models mainly differ in
the awards were first given in 1929 at a ceremony          what they try to forecast, what predictors they use
created for the awards , at the hotel Roosevelt in         to forecast, and who does the forecasting.
Hollywood. Over the years that the award has               With regard to the forecasting target, some
been given , the categories presented have                 models
changed ; currently Oscars are given in more than          forecast vote intentions using monthly poll data
a dozen categories, and include films of various           [12][13] some forecast vote and seat shares
types.                                                     [14][15][16][17], whereas others forecast whether
Over 100 countries show academy award live and             incumbents will be re-elected [18] There are also
in recent years seeing academy awards discussion           variations in the predictors used, though usually
in social networks became a hot topic and there            the models include one or more of the following
are a lot of real time tweet parties and statuses          three types: lagged values of the dependent
during the broadcasting of Oscars, since 2004 ,            variable, economic variables and political
academy award nomination results have been                 variables. For example, [19] forecasts the
announced to the public in late January. prior to          Conservative vote shares with lagged values only,
that , the result were announced in early                  whereas [18] use inflation rate, government
February.                                                  popularity, and terms in office to forecast vote
the academy of motion picture arts and                     and seat shares of the incumbent party.
sciences(AMPAS), a professional honorary                   Another type of model relies on citizens’
organization , maintains a voting membership of            expectations     of     the   election     outcome
5,783 as 2012.                                             [21][22][23]. Most individual British voters
Actors constitute the largest voting bloc ,                correctly forecast the
numbering 1,311 members (22 percent).                      winner of the general election [23]. Further,
some winners critical of the academy awards

                                                      40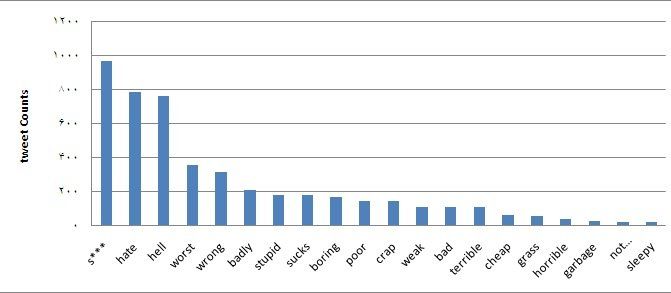
Global Journal of Science, Engineering and Technology (ISSN : 2322-2441)
   Issue 8, 2013 , pp. 39-47
   © GJSET Publishing, 2013.
   http://www.gjset.org

voters seem to be able to forecast the national           learning have sometimes identified the negative
vote share of the winning party. The present              consequences of “herd behavior” (Chamley,
research extends this line of research to the             2004). People behave as a herd if its members
constituency level. The present research                  first observe the actions of other members and
aggregates citizens’ local expectations about the         then behave in the same way dismissing any
election outcome in each constituency.
                                                          relevant personal information they might have.
This aggregation yields a very accurate forecast
                                                          Models of “herd behavior” highlight the
because of the “wisdom of crowds”-effect.
                                                          importance of sequenced if the first person makes
     3. “Wisdom of crowds” and                            the wrong decision, they lead the whole group
                                                          astray. Condorcet’s jury theorem and its
      forecasting election outcomes
                                                          extensions highlight the conditions under which
The “wisdom of crowds” refers to the                      groups outperform individuals. Condorcet’s jury
henomenon that aggregated judgments are (often)           theorem implies that if the probability that a
more precise than that of the smartest person in          group member votes for the “correct” alternative
the group (Hogarth,1978; Hastie and Kameda,
                                                          is greater than 0.5, the probability of a correct
2005; Larrick and Soll, 2006). Numerous studies
                                                          majority vote will increase rapidly towards unity
in different areas report this effect (for an             as the group size increases to infinity (Condorcet,
overview see Surowiecki 2004). Galton (1907),             1785, 1994; Miller, 1986). By the same token, if
for example, reports that on an exhibition, the           the probability that a group member votes for the
average of all estimates of an ox’s weight was
                                                          “incorrect” alternative is smaller than 0.5, the
much more precise than any individual estimate.           probability of an incorrect majority vote will
Recent research on public opinion mirrors these           decrease rapidly towards zero as the group size
findings. Page and Shapiro (1992) maintain that           increases to infinity. Condorcet derived this jury
although many individuals seem to have non-               theorem under specific assumptions same
attitudes (Converse, 1964), public opinion in             probability of being correct for each member,
aggregate responds to political events as one             independence of members, and a binary decision;
would expect. The reason for this effect is that a        however, recent efforts have generalized it. A
response is the sum of the true value and an error        jury theorem holds even if not every member has
term. By summing over several responses these             the same probability of choosing the correct
errors are likely to cancel each other out and the        outcome as long as the mean probability of being
true opinions emerge clearly. There are, however,         correct is greater than 50 percent (Grofman et al.,
those who expressed suspicion of the “miracle of          1983; Boland, 1989). The same authors also show
aggregation” (Converse,1990; Surowiecki 2004).            that a jury theorem still holds even under specific
                                                          forms of correlated votes between members (see
Critics have suggested that the group may cloud           also Ladha, 1992; Estlund, 1994). Finally, List
the judgment of individuals. Janis (1982) and ’t          and Goodin (2001) generalize Condorcet’s jury
Hart (1994) both speculate about the danger of            theorem to more than two alternatives. The
“groupthink” for those making judgments, and              theorem, accordingly, seems applicable to the
Solomon Asch’s experiments about social                   present case, where voters may talk with each
conformity show the negative consequences                 other or share the same information, have
groups may have on an individual’s judgments              different probabilities of making the correct
(Asch, 1955). Moreover, models of social                  forecast and where more than two parties

                                                     41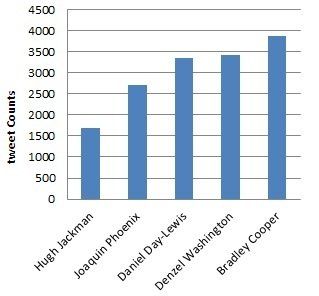
Global Journal of Science, Engineering and Technology (ISSN : 2322-2441)
   Issue 8, 2013 , pp. 39-47
   © GJSET Publishing, 2013.
   http://www.gjset.org

compete. Surowiecki (2004) claims that two other           a. Crowdsourcing
conditions increase the likelihood of “wisdom of          Innocentive was an initiative launched by a
crowds “diversity and decentralization (together          pharmaceutical firm which faced a problem in
with aggregation). Diversity refers to information        designing a product.
and not to socio-demographics (Surowiecki
2004). It is important that members of a group            Despite its large R&D department, it had no clue
have different pieces of information so that              about how to solve a specific problem for
combining their responses enriches the                    developing a new product. A new matchmaking
prediction. Decentralization highlights the value         system was devised to link outside experts to
of tacit knowledge (von Hayek, 1945): people              unsolved R&D problems. A monetary reward was
who live in a constituency have local 772 A.E.            offered to whoever could solve the problem.
Murr / Electoral Studies 30 (2011) 771–783
knowledge they can bring to the problem of                Scientists from all over the world competed for
predicting which party would win their                    the prize. The winner got the prize and the
constituency.1 Meehl (1957) makes a similar               company got the solution at a comparatively
point with his “broken leg analogy”. One may              inexpensive price [6][7]. Another example was
have a plausible statistical model to predict             seen in the case of Procter & Gamble, who were
whether professors watch a movie in the cinema            using less than 10% of internal innovation in their
based on two variables his or her degree of               new products, so the company changed its mind
extroversion and area of specialization. This             on the way they were innovating and changed
model may be on average right. But the model              their policy on intellectual property (IP). They
lacks common sense. The model may predict that            open the patent to any outsider if the idea has not
a particular professor goes to the cinema, though         been applied in the last 3 years [8]. The IP
he or she has a broken leg. The model lacks a             collaboration loop went further with the
“broken leg”-variable.                                    emergence of marketplaces such as yet2.com,
                                                          where ideas (under IP rights) are on sale [9].
Similarly, centralized election forecasting models
may miss variables that are important for                       4. The present research
forecasting particular constituencies. Statistical        In this research first we explore why groups are
models cannot incorporate all relevant                    better than individual in forecasting elections and
information because they lack the degrees of              the next section we will talk about why we think
freedom to do so. In contrast, citizens have the          groups can forecast and we will go on with how
ability to incorporate unforeseen events in their         we collected data and the ways that we
decision making.                                          aggregated specific results from this dataset and
Diversity and decentralization match the situation        we will predicted result of an award show and
in forecasting elections. Firstly, a random sample        compare it to the real results. There could be
of people within a constituency ensures a diverse         some questions about how accurate it could be?
selection of interviewed people. Secondly, letting        This could be clear in the conclusion section.
citizens collectively forecast.
                                                           a. Are groups better than individual in
                                                              forecasting?
                                                          Who is better in forecasting? Individual or
                                                          groups? This question compares the percentage of

                                                     42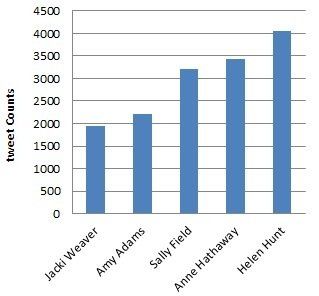
Global Journal of Science, Engineering and Technology (ISSN : 2322-2441)
   Issue 8, 2013 , pp. 39-47
   © GJSET Publishing, 2013.
   http://www.gjset.org

correct constituency forecast between individual           with task difficulty elections vary in how easy
and groups.[10] forecasts are more impressive the          they are to forecast. The easy election are the
earlier they are made. It seems relatively easy to         higher the chances of getting it right. What makes
predict the election outcome one day before                an election easy or hard to forecast? I propose
election.                                                  several objective majors of task difficulty. These
                                                           objective majors fall into 2 broad categories.
Forecasting the election before the campaign               Characteristics of electorate at the degree of party
started seems more difficult. Plurality voting is          competition.
perhaps the simplest aggregation method.
                                                           Group characteristic should be defined as the
It just looks at the person of people who thought          groups size and the variations in the response
that the party or group would win(the group                date. For getting the prediction right.[1]
forecast score)

The party or the group with the highest group
                                                            c. Oscar buzz
forecast score is predicted to win the                     In the past for different event friends gathered in
constituency. Although polarity voting is widely           frin of TV and watch their favorite show. And
use as a standard voting procedure. It discards a          would tell their opinions and predictions to each
lot of available information. For instance polarity        others. As of today the same things happn. But in
voting only looks at the first ranked party. An            a different way. They all watch their favorite
omits information about which party came second            show but they express themselves by tweetin their
or third in the respondent forecast.                       comments and sharing it with hundreds of
                                                           followers and millions of random people. This is
Similarity polarity voting discard how certain the         done not just by social networks like twitter but
respondent was in making this forecast.[] To sum           by podcasts too that has been a popular service in
up groups are on average better forecasters than           recent years. As watching an award show through
individuals. This is a robust finding independent          twitter became an enjoyable hobby the tweets that
of weather whether polarity voting or another              has been shared is a very helpful data for
way of voting is used such as(e.g. range voting)           researchers to base their researches on them.
to yield group forecasts. However this is not to
say that groups are always better than individuals.         d. Collecting data from twitter
In some constituencies groups get it wrong                 Twitter website has been a great place for both
whereas some individuals correctly predict the             developers and researchers in recent years. By
winner.                                                    introducing the new API, twitter made it easy to
                                                           search through millions of users and billions of
 b. Why can groups forecast                                tweets. The mechanism would be that twitter
The previous subsection has shown that most                assigns an oAuth credential for each specific app
groups can correctly forecasts. We can also map            that has been registered. You can use the oAuth
out that some regions are better than others in            credential to request different available services
forecasting. But there could be some questions.            from twitter server. This service could range from
What can explain correct forecast. What can                a user’s account information to tweets that he/she
explain why some regions over perform. We can              shared. However the number of requests per hour
answer these questions by exploring task                   are limited but we managed to gather about
difficulties and group characteristics. To begin

                                                      43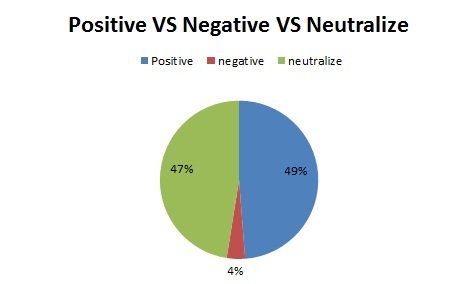
Global Journal of Science, Engineering and Technology (ISSN : 2322-2441)
Issue 8, 2013 , pp. 39-47
© GJSET Publishing, 2013.
http://www.gjset.org
200,000 of tweets in 5 days with information
about users that tweeted them.
We decided to collect our dataset from twitter.
The most important thing to make our dataset
more accurate is to collect tweet in the Oscar
buzz. When many people are talking about this
event. We have used twitter APIs to collect these
tweets based on the words related to Oscar, i.e
movie names, directors, nominations and stored
them in a database.
Fig2. Percentage of negative and positive tweets.
e. Analyzing the collected data
We analyzed the collected data and extract some As we studied this tweets we found out that we
results. First we created a dataset of important can conclude that in a large group of people most
words which their meaning is positive and a of them talk about things that get them excited
dataset for the words with negative meaning. and situations that they like and enjoy to have.
This 49% that contains positive adjectives that is
After analyzing the tweets with these datasets we
used for different nominees are separated by each
found that about 49% of tweet contained positive
positive word that is shown in Fig3. For instance
words and only 4% contained negative words and
users used the word “best” about 24000 times
other 47% didn’t contained any of them. Fig.1
about different nominees in their tweets and used
and Fig2 is showing it as a diagram.
the word “win” to express their opinions about
the winners of the academy.
Fig1. Percentage of positive and negative ratio
Fig3. Positive adjectives ordered by number of
tweets.
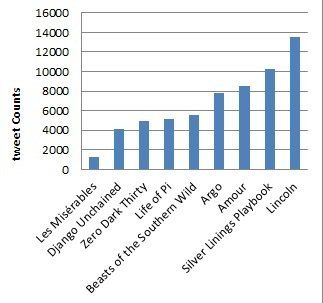
In Fig4 we can see that we analyzed the tweets
based on the negative adjectives, as we concluded
44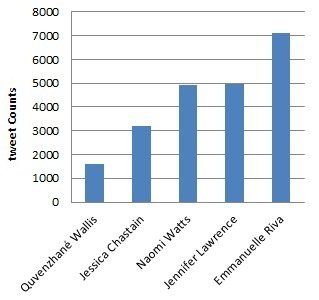
Global Journal of Science, Engineering and Technology (ISSN : 2322-2441)
   Issue 8, 2013 , pp. 39-47
   © GJSET Publishing, 2013.
   http://www.gjset.org

before we can say that people tend to say positive        academy award for best actor, in Fig5 Daniel
things about a particular subject.                        Day-Lewis came third by lacking about 700
                                                          tweets.

                                                          In Fig6 we have the best supporting actor in our
                                                          prediction tweets show that Christoph Waltz
                                                          would win the Oscars and that did came true.

                                                          In other figures shown below we can see that
                                                          most of the analyzes that we have done came
                                                          true. Those predictions that we had been wrong,
                                                          the actual winner came very close to winning in
                                                          our predictions. In some cases although our
Fig4. Negative adjectives ordered by number of            prediction wasn’t like the real result, it may be
tweets.                                                   true amongst people for example the movie Argo
                                                          that caused a huge wave of criticism toward
                                                          academy award and accusing academy to be
                                                          politicized.

                                                          The method that we used to recognize and predict
                                                          the winner is that we searched for the name of
                                                          each nominee with the positive adjectives and we
                                                          assigned each one of them a score. we also
                                                          searched for the nominees in all of the tweets and
                                                          we scored them as ¼ of each score for a nominee
                                                          that is mention by a positive adjective, Then we
                                                          summed this scores.

Fig5. Best leading actor prediction based on
tweets

We gathered our data in a database and we
analyzed this data by inquiring specific
commands to get the best results and accurate
predictions. These predictions are based on the
real tweets that has been shared by each user. In
Fig5 we have th category of best leading actor,
our prediction by analyzing the tweets shows that
bradley cooper could win the academy rewards
for best actor. In this category our prediction           Fig6. Best supporting actor prediction based on
didn’t came true and Daniel day-lewis won the             tweets

                                                     45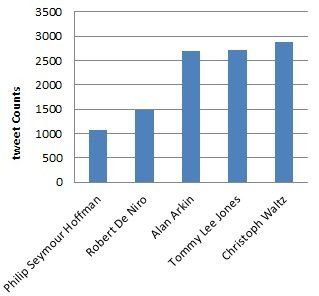
Global Journal of Science, Engineering and Technology (ISSN : 2322-2441)
   Issue 8, 2013 , pp. 39-47
   © GJSET Publishing, 2013.
   http://www.gjset.org

Fig7. Best leading actress prediction based on
                                                         Fig9. Best Picture prediction based on tweets.
tweets.

Fig8. Best supporting actress prediction based on        Fig10. Best directing prediction based on tweets.
tweets.
                                                                        5. Conclusion
                                                         This studies and researches that we have done on
                                                         tweets show that most of the times we can
                                                         forecast events if we have the right amount of the
                                                         users that can produce different opinions. The
                                                         present research applies the users forecasting
                                                         ideas to an award show that has been televised in

                                                    46
Global Journal of Science, Engineering and Technology (ISSN : 2322-2441)
   Issue 8, 2013 , pp. 39-47
   © GJSET Publishing, 2013.
   http://www.gjset.org

most of countries all over the world and that is              [8] Tapscott, D., & Williams, A. D. (2006).
not specified by locations. We could limit data                    Wikinomics: How mass collaboration changes
                                                                   everything. London: Penguin Books.
gathering and predict the local event by local                [9] Lichtenthaler, U. (2007). Trading intellectual
expectations. For instance a law that is passing in                property in the new economy. International
congress we can have the expectation of each                       Journal of Intellectual Property Management,1(3),
province by studying on their day to day tweets                    241–252.
                                                              [10] Smith, W.D., 2000. Range voting. Available at:
and we can measure how this law helps everyday                     http://math.temple.edu/
life of people. Although user forecasting was in                   wds/homepage/rangevote.pdf.
general very accurate. It sometimes got in wrong.             [11] Campbell, J.E., Garand, J.C. (Eds.), 2000. Before
                                                                   the Vote: Forecasting American National
We used twitter and based our predictions on                       Elections. Sage, Thousand Oaks.
                                                              [12] Sanders, D., 1991. Government popularity and the
tweets. We cleaned our data through the                            next general election. The Political Quarterly 62,
collecting data stages. We think that with more                    235–261.
users participating and providing more                        [13] Whiteley, P.F., 1979. Electoral forecasting from
information in more timely manner our prediction                   poll data: the British case. British Journal of
                                                                   Political Science 9, 219–236.
will improved and we can outperform other                     [14] Mughan, A., 1987. General election forecasting in
predictions. We can analyze different events and                   Britain: a comparison of three simple models.
their consequences on people’s daily life. Using                   Electoral Studies 6, 195–207.
                                                              [15] Bélanger, É, Lewis-Beck, M.S., Nadeau, R., 2005.
this kind of social network predictions, allow us
                                                                   A political economy forecast for the 2005 British
conduct feel the experiment to study social                        general election. British Journal of Politics &
interactions and to measure the social distant of                  International Relations 7, 191–198.
participants by using network data.                           [16] Whiteley, P.F., 2008. Evaluating rival forecasting
                                                                   models of the 2005 general election in Britain: an
                                                                   encompassing experiment. Electoral Studies 27,
                 REFERENCES                                        581–588.
                                                              [17] Whiteley, P.F., Sanders, D., Stewart, M., Clarke,
[1] Andreas Erwin Murr,””Wisdom of crowds”?A                       H., 2011. Aggregate level forecasting of the 2010
    decentralized election forecasting model that uses             general election in Britain: The seats-votes model.
    citizens’ local expectations”                                  Electoral Studies 30, 278–283.
[2] J.Albors, J.C.Ramos, J.L.Hervas, “New learning            [18] Borisyuk, R., Galina, B., Rallings, C., Thrasher,
    network paradigms: Communities of objectives,                  M., 2005. Forecasting the 2005 general election: a
    crowdsourcing, wikis and open source”                          neural network approach. The British Journal of
[3] Thierry Bücheler a,∗, Jan Henrik Sieg b,                       Politics & International Relations 7, 199–209.
    “Understanding Science 2.0: Crowdsourcing and             [19] Norpoth, H., 2004. Forecasting British elections: a
    Open Innovation in the Scientific Method”                      dynamic perspective.Electoral Studies 23, 297–
[4] Howe, J. 2010. Crowdsourcing. Why the Power of                 305.
    the Crowd is Driving the Future of Business.              [20] Lewis-Beck, M.S., Skalaban, A., 1989. Citizen
    http://www.crowdsourcing.com/. Accessed 20                     forecasting: can voters see into the future? British
    Feb. 2011.                                                     Journal of Political Science 19, 146–153.
[5] H.W. Chesbrough, Open innovation. The new                 [21] Lewis-Beck, M.S., Tien, C., 1999. Voters as
    imperative for creating and profiting from                     forecasters: a micromodel of election prediction.
    technology, Harvard Business School Press,                     International Journal of Forecasting 15, 175–184.
    Boston, Mass, 2003.                                       [22] Lewis-Beck, M.S., 2005. Election forecasting:
[6] Allio, R. J. (2004). CEO interview: The                        principles and practice. British Journal of Politics
    InnoCentive model of open innovation. Strategy                 & International Relations 7, 145–164.
    & Leadership, 32(4), 4–9.                                 [23] Lewis-Beck, M.S., Stegmaier, M., 2011. Citizen
[7] Steve, R. (2006).Who’s ready to crowdsource?                   forecasting: Can UK voters see the future?
    Advertising Age, 77(43) (p. 35).                               Electoral Studies 30, 264–268.

                                                         47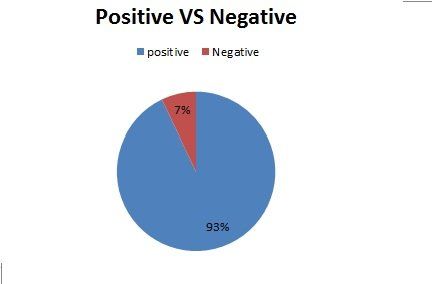
You can also read