Presentation at the Wells Fargo 2016 Industrial and Construction Conference - May 10, 2016
←
→
Page content transcription
If your browser does not render page correctly, please read the page content below

Presentation at the Wells Fargo 2016
Industrial and Construction Conference

                                   May 10, 2016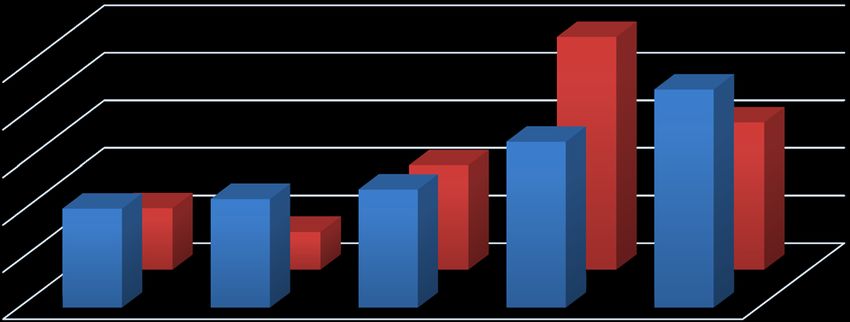
Forward-Looking Statements / Property of Aircastle
All statements included or incorporated by reference in this Presentation, other than characterizations of historical fact, are
forward-looking statements within the meaning of the federal securities laws, including the Private Securities Litigation Reform Act
of 1995. Examples of forward-looking statements include, but are not necessarily limited to, statements relating to our ability to
acquire, sell, lease or finance aircraft, raise capital, pay dividends, and increase revenues, earnings, EBITDA, Adjusted EBITDA and
Adjusted Net Income and the global aviation industry and aircraft leasing sector. Words such as “anticipates,” “expects,” “intends,”
“plans,” “projects,” “believes,” “may,” “will,” “would,” “could,” “should,” “seeks,” “estimates” and variations on these words and
similar expressions are intended to identify such forward-looking statements. These statements are based on our historical
performance and that of our subsidiaries and on our current plans, estimates and expectations and are subject to a number of
factors that could lead to actual results materially different from those described in the forward-looking statements; Aircastle can
give no assurance that its expectations will be attained. Accordingly, you should not place undue reliance on any such forward-
looking statements which are subject to certain risks and uncertainties that could cause actual results to differ materially from
those anticipated as of the date of this Presentation. These risks or uncertainties include, but are not limited to, those described
from time to time in Aircastle's filings with the SEC and previously disclosed under "Risk Factors" in Item 1A of Aircastle's 2015
Annual Report on Form 10-K, and elsewhere in this Presentation. In addition, new risks and uncertainties emerge from time to
time, and it is not possible for Aircastle to predict or assess the impact of every factor that may cause its actual results to differ
from those contained in any forward-looking statements. Such forward-looking statements speak only as of the date of this
Presentation. Aircastle expressly disclaims any obligation to revise or update publicly any forward-looking statement to reflect
future events or circumstances.

The information contained herein is the property of Aircastle Limited and shall not be disclosed, copied, distributed or transmitted,
or used for any purpose, without the express written consent of Aircastle Limited.

                                                                                                                                         2
Basic Investment Propositions

1. Air travel demand to remain strong over time
2. More travel drives healthy demand for leasing
3. Investment opportunities vary over time

                                                   3
Long-term growth in passenger travel
600
Early 1990’s Internet Bubble Burst GFC
500 Recession 9/11, Gulf War, SARS
400
300
200
100
1983 1988 1993 1998 2003 2008 2013
(1983 = 100)
GDP RPK = Revenue Passenger Kilometers
Source: ICAO, IMF
4Growth varies by region
4.0 2.0
N. America / Europe RPKs (billions)
Growth Markets RPKs (billions)
Increases during
3.0 Economic Slow-downs 1.5
2.0 1.0
1.0 0.5
0.0 0.0
1983 1988 1993 1998 2003 2008 2013
N. America / Europe Growth Markets
Source: ICAO; Growth markets include MENA, China, S. America, and India
5Investment conditions vary widely
90
VIX Index
80
70
60
50
40
30
20
10
0
1990 1992 1994 1996 1998 2000 2002 2004 2006 2008 2010 2012 2014 2016
Source: Bloomberg
6Jet fuel prices and aircraft
Neo / MAX launches
$5.00
$4.00
$3.00
$2.00
$1.00
$0.00
Source: Bloomberg
7Lessor landscape today
Aircraft
Age
New
Old
Small Large Deal Size
8We are investors
• Growth minded, but disciplined
• Counter-cyclically oriented
• Active portfolio managers
9We’ve grown > 50% in 5 years
$Billions Flight Equipment
$6.6
7.0 $6.2
$0.5
$5.4 $0.5
6.0
$0.2
5.0
4.0
$5.7 $6.1
3.0 $5.2
$4.4 $4.8
$4.1
2.0
1.0
0.0
2010 2011 2012 2013 2014 2015
Owned JV Assets
10During the past three years…
Acquired 106 aircraft
Sold 102 aircraft
162 aircraft portfolio at YE 2015
Number of Aircraft
49
31
50
40 22
30 13
8
20
35 46
10 21 23 25 Sales
Purchases
0
2011 2012 2013 2014 2015
Purchases Sales
11Where we stand
• Minimal long-term capital commitments
• Conservative capital structure
• Strong portfolio performance and cash flows
1213
You can also read