PRESENTATION ON HIGHWAY SAFETY IN PAKISTAN IN CONTEXT OF OVERLOADING - By Mr Tariq Mahmud Secretary Ministry of Communications Government of Pakistan
←
→
Page content transcription
If your browser does not render page correctly, please read the page content below
PRESENTATION
            ON
HIGHWAY SAFETY IN PAKISTAN
IN CONTEXT OF OVERLOADING

        By Mr Tariq Mahmud
              Secretary
     Ministry of Communications
                                  1
       Government of Pakistan
Highway/Road Safety
Safety is of prime importance, not only to the users but
also to engineers, planners and decision markers
associated with operation, improvement and development
of transportation system.
The traffic safety problem on our roads has registered a
very sharp increase during recent years.
There are a number of administrative, legal, technical,
socio-economic and cultural reasons for it.
There is urgent need for carrying out research in
fundamental aspects of the problem to make sure the
problem is being tackled properly.
2Traffic Safety Problem World
Wide (Revised World Bank Data)
Between 750,000 & 880,000 deaths worldwide in 1999
85% in the developing & transitional economies countries
50% in urban area
Between 25 &35 Million people were injured world wide
75 %were in urban area
More than 50% occur at Junctions
Economic Cost
Annual Cost US$80 Billion
About 2% of the GDP
3Fitalities/10,000 Vehs
0
10
20
30
40
50
60
70
80
90
100
110
120
130
140
150
160
170
180
190
200
1
Ethopia
2
Zambia
3
Nepal
4
Bangladesh
5
Cameroon
6
Kenya
7
China
8
Botswana
Zimbabwe
Niger
Pakistan
India
Ecquedor
Morocco
Tunisia
South Africa
Countries
Colombia
Serilanka
Indonesia
Hongkong
Malaysia
Singapore
USA
Australia
Japan
Finland
UK
FATALITY RATE COMPARISON
4
Norway
9 10 11 12 13 14 15 16 17 18 19 20 21 22 23 24 25 26 27 28Distribution of reported accidents
in Europe & in Pakistan
Severity Europe Pakistan
Fatal accidents 1.68% 39.02%
Serious injury accidents 3.59% 42.03%
Minor injury accidents 17.56% 10.52%
Damage only accidents 77.18% 8.43%
The table shows that most of the injury & damage
only accidents stay unreported
JICA Study March 2004
5FOUR E'S OF HIGHWAY
SAFETY
Engineering: Making roads safe and fast by incorporating
engineering improvements such as separation of grades
and carriage-ways, installation of signs, signals and road
markings to guide the road users along their travel paths
with speed and safety.
Education: Educating the road users in the rules
of the road to inform them of their rights and limitations
as road users, to prevent them from creating a situation
hazardous to themselves and to other road users.
Enforcement: Preventing violation of the rules of the
road by the road users by organizing a very effective
enforcement agency.
Environment: Minimised environmental pollution
during construction/Rehab/maintenance
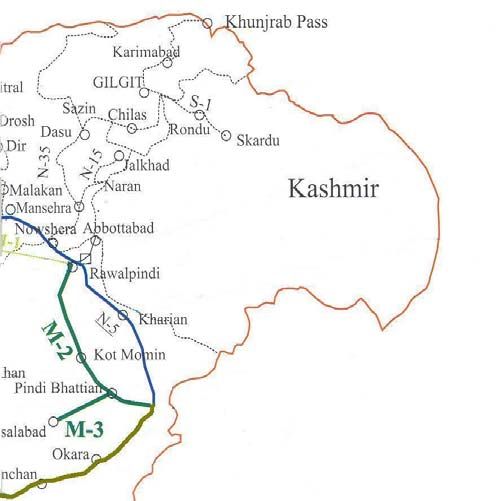
6NATIONAL HIGHWAYS & MOTORWAYS
MAP OF PAKISTAN
Peshawar Islamabad
Pindi Bhattian
Lahore
Faisalabad
Okara
Multan
Rahimyar Khan
Ubauro
Ghotki
Kot Sabzal
Sukkar
Moro
Super Highway
Katri
Karachi
Thatta
7SOME FACTS ABOUT
PAKISTAN
Probably over 7000 people die in Pakistan every year in
road accidents
Total cost is estimated to be about a billion US $ every
year
Even material costs exceed US $200 Million per year
Those who die & suffer injuries are the most active and
educated citizens
This is 40% more than in Turkey, where vehicle fleet is
much bigger
In 12 years time, the number of accidents will grow from
300,000 to 700,000, resultantly the accident costs from
US $ 1 billion to US $ 2.5 billion and the annual number
of fatalities will grow from 7000 to 14000, which is an
increase from 20 to 40 deaths per day 8ANNUAL FATALITIES GROWTH
Growthof Annual FatalitiesinPakistan
14000
12000
10000 Fatalities/Year
8000
6000
4000
Year
9MODAL SHARE – PAKISTAN TRANSPORTATION
MODE
100
95% 90%
90
Passenger Traffic
80
Freight Traffic
70
60
% 50
40
30
8%
5% 0% 2%
20
10
0
ROAD RAIL
ROAD RAIL AIR 10Role of Road transportation in
Pakistan & Present Condition
of National Highways
Of the three primary transportation modes(road,rail,air), road
transportation overwhelmingly dominates the two transport
systems.
107000 million ton kilometers of freight annually compared to
5000 ton kilometer & 25 million ton kilometer by rail &air
respectively
90% passenger traffic as compared to 8% and 2% by rail & air
respectively.
Roads are the backbone or lifelines of Pakistan economy.
Total Length of road network in the country is approximately
250000 KMs
145000 Kms of Paved roads (High type)
105000 Kms of gravel roads (Low Type)
Length of the National Highways is about 9000 Kms
Though the length of National Highways is only 3.5% of the
entire road network of the country, but they carry more
than 80% of the country’s traffic
11Condition of National Highways
With the growth in traffic volume & axle load levels, and inadequate
maintenance, the large asset investment is deteriorating at an alarming
rate.
The result of the Pavement condition surveys conducted in year 2000 by
NHA show that 50% of the existing NHA network is need of the major
rehabilitation or reconstruction. The remaining 50% will be lost in the
near future if adequate maintenance &rehabilitation actions are not
taken in a timely & effective manner
The cracking data shows that 76% of the NHA’s network has cracked
High to very high severity level cracking exists on approximately 41 % of
the network and 58% of the NHA network has rutted, severity level
rutting exists on approx. 27% of the network.
Results of the 2000 Pavement roughness survey made according to
International Road roughness (IRI) criterion show that 74% of the NHA
network has an unacceptable.
An HDM/EBM study conducted in year 2000 by a joint team o f
NHA and the World Bank suggests that spending Rs 6 Billion per
year can improve the ride quality of NHA network to an acceptable
standards in a six year period, this strategy will result in a saving of
Rs 24 Billion (NPV) in a road transportation costs alone.
12Present condition of National
Highways
Root cause of the present situation
The present situation of the road network is due to disinterest political
expediency) and neglect (unawareness of economic consequences of
deferred & /under funded maintenance). These two factors resulted in a
tendency that promoted disproportionate budgeting that resulted in a
vast imbalance in development & maintenance expenditure.
NHA annual development expenditure has seen a manifold increase
since the 1990’s,whereas its maintenance allocations have stagnated at
less than 4% of the annual development budget. Consequently the gap
between the maintenance funds demand & allocation has broadened
every passing fiscal year.
The proportion of maintenance allocations actually released has
declined sharply during the last decade, from almost 60% to just over
20% of the allocated amount.
Recognition of the Problem:
The Government of Pakistan recently realized that if it continues to
neglect maintenance & rehabilitation, the remaining road network will
also crumble prematurely and the associated avoidable costs will form a
formidable obstacle to the socioeconomic development of Pakistan.
13PERCENTAGE OF FREIGHT VEHICLES
BY COMPOSITION
Different Trucks carrying different Axle
4–axle, 7%
Loads
5 & 6–axle, 6%
3–axle trailer, 4%
2–axle trucks,
61%
2–axle trucks
3–axle trucks
3–axle trailer
3–axle trucks, 4–axle
22%
5 & 6–axle
14PERCENTAGE OF FREIGHT VEHICLES
BY COMPOSITION
% Incre ase in Ov erloaded %age
Fre ight
Ve hicle s, 4%
O v e rloade d %
in case of 4, 5
& 6 axle , 40%
Overloaded % in case
O v e rloade d % of 2 & 3 axle
in case of 2 & Overloaded % in case
3 axle , 70% of 4, 5 & 6 axle
% Increase in Freight
Vehicles
15OVERLOADING PRACTICE
Overloaded heavy vehicles are destroyers of roads and are
traffic safety hazards. Around 90% commercial vehicles
carry more than the allowable standard axle load i.e.
12 ton/axle. The primary reason for overloading the
overwhelming presence of two axle trucks, which
accounts for 70% in the overall truck fleet presently
plying on the roads in Pakistan. To cater for the overload,
the truck drivers make structural changes alongwith
tyres inflation much more than the allowable tyre
pressure i.e. 120 psi.
16HISTORICAL BACKGROUND
HIORICAL BACKGROUND
TRUCK FLEET
GROWTH
1950 - 1998
4000% !
17LOAD FACTOR COMPARISON
DAMAGE CAUSED BY PASS OF
1 PAKISTAN TRUCK 22 USA TRUCKS
(2 Axle)
=
18LOAD FACTOR COMPARISON
DAMAGE CAUSED BY PASS OF
12 USA
TRUCKS
1 PAKISTAN
TRUCK
(3 Axle)
=
19ADVERSE EFFECTS
Structural:
• Premature “Fatigue Cracking” and “Shear
Deformation” in the pavement.
• 2,000 KMs of Asphalt work done on
various sections of N-5, N-55 and M-2
since 1997 have completed their design
life within a short timeframe of 5 years.
• 1,400 KMs require Rehabilitation.
• 2,000 KMs require Overlay
20ADVERSE EFFECTS
Safety:
Obstruct Sight Distance
Difficulty in Overtaking
Effect on Breaking Distance
Difficulty in Maintaining the Average
speed thus causing traffic congestion
21THE RESULT
22WHAT IS AT STAKE
ROAD ASSET WORTH OVER Rs. 2.5 TRILLION
HIGH TRAVEL COST TO ECONOMY
ROAD SECTOR INEFFICIENCY CAUSING A
LOSS OF Rs. 240 BILLION OR 6.8% OF THE
GDP
70 FATALITIES PER MILLION CAUSING
Rs. 40 BILLION
DELAYED ECONOMIC ACTIVITY & POVERTY
ALLEVIATION
OTHERS ………….
23MESAURES TAKEN Creation of National Highways & Motorway Police National Highway Safety Ordinance (2000) Tolling on Highways and Motorways for Adequate Maintenance Funds Improved Road Geometry Dualization of Main Arteries of the Country Holding of International Road Safety Seminars/workshops Revision of MVO (19965/69) under Consideration Provision of Multi Axle Trailers to the Transporters at affordable cost to minimise usage of 2-3axle trucks 24
THANK YOU

            25
You can also read