Primer designing strategy for amplication and sequencing of the complete mitochondrial genome of Semnopithecus hypoleucos
←
→
Page content transcription
If your browser does not render page correctly, please read the page content below
Primer designing strategy for amplification and
sequencing of the complete mitochondrial genome
of Semnopithecus hypoleucos
Vipin Hiremath
Paul Hebert Centre for DNA Barcoding and Biodiversity Studies, Dr. Babasaheb Ambedkar Marathwada
University, Aurangabad-431004, Maharashtra State, India
Chandrakant Jadhav
Paul Hebert Centre for DNA Barcoding and Biodiversity Studies, Dr. Babasaheb Ambedkar Marathwada
University, Aurangabad-431004, Maharashtra State, India
Gulab Khedkar ( gdkhedkar@gmail.com )
Paul Hebert Centre for DNA Barcoding and Biodiversity Studies, Dr. Babasaheb Ambedkar Marathwada
University, Aurangabad-431004, Maharashtra State, India
Research Article
Keywords: mitochondrial genome, primers, PCR amplification, closely related primate species
Posted Date: August 13th, 2021
DOI: https://doi.org/10.21203/rs.3.rs-811077/v1
License: This work is licensed under a Creative Commons Attribution 4.0 International License.
Read Full License
Page 1/17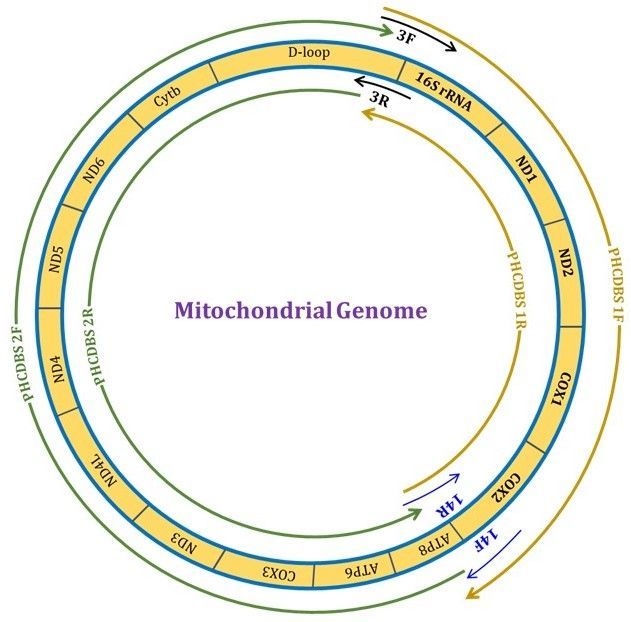
Abstract
The mitochondrial genome is highly informative for evolutionary analysis of organism lineages and
phylogenetic studies. The availability of robust primers for amplifying complete mitochondrial genomes is
a crucial step in current mitogenome studies. However, organism specific characteristics such as variable
transition to transversion substitution ratios seen in some groups pose challenges for the development of
universal, or at least broadly applicable, primer pairs for this purpose. This study reports on a strategy of
primer design and optimization (PDO) where regions of known mtDNA genescan be used for choosing
primers for amplification, sequencing and assembly of entire mitochondrial genomes of several closely-
related species. In brief, taking advantage of the circular organization of mtDNA, primers are first designed
for amplification of “long” products using the 5’ region of one conserved gene and a 3’region from another
conserved gene. Additional primers are then used to amplify “short” regions to fill in gaps to allow for
complete assembly of the genome. We show how we were able to use this approach to successfully
amplify entire mitochondrial genomes from a non-human primate species (Semnopithecus hypoleucos),
and also how this provided data useful for annotation of the assembled genome data.

Background
A thorough understanding of genetic diversity is an important step for developing appropriate
conservation plans for any group of organisms (Oakenfull et al. 2000). Mitochondrial (mt) DNA has
become popular for these studies since it provides rich sets of information relevant to evolutionary
biology, population genetics and phylogenetics through its maternal inheritance and relatively high
mutational rates (Avise and Saunders 1984; Avise 1986; Dasmahapatra et al. 2010; Nabholz et al. 2019).
Moreover, the high copy number and circular nature of mtDNA tends to make it less prone to degradation
and therefore may provide material for complete analysis compared, for example, to nuclear sequences.
These qualities have shown mtDNA to an important genetic tool in tracking large scale comparative
studies of evolutionary relationships among individuals, populations and species.

Construction of phylogenetic trees is a useful tool for analyzing evolutionary relationships of genes
between species. Many of these studies rely exclusively on a small part of the mtDNA, such as
cytochrome oxidase subunit I(COI) (Webb and Moore 2000; Kerr et al. 2009; Khedkar et al. 2016a);
cytochrome b (cyt b) (Chang et al. 2010; Khedkar et al. 2016b), or others. Such approaches are known,
however, to underestimate the influence of variation seen in the complete mitochondrial genome on
evolutionary processes (Springer et al. 2012; Pozzi et al. 2014). For example, comparative studies of
protein coding genes tend show high levels of similarity compared to non-coding regions which can be
more highly variable. It is also well known that certain parts of the mitochondrial genome, such as the D-
loop region evolve faster than the highly conserved 16S rRNA and 12S genes (Gerber et al. 2001). This
implies that phylogenetic relationships among species are better inferred from the use of the complete
mitochondrial genome sequences.

                                                  Page 2/17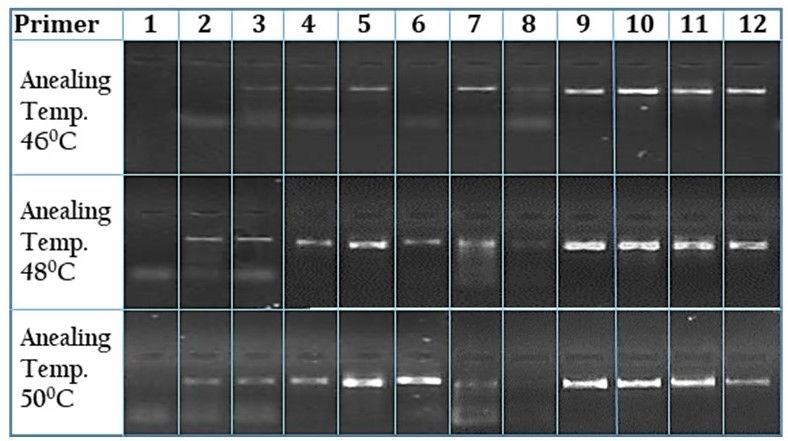
Although several complete mitochondrial genome sequences have been published (Matsui et al. 2009; Li
et al. 2009; Kim et al. 2009; Ma et al. 2010; Kurabayashi et al. 2010; Finstermeier et al. 2013; Pozzi et al.
2014; Zhang et al. 2017), data for several species and/or species groups is still incomplete due to
technical problems related to the availability of robust primers (Ramos et al. 2011; de Freitas et al. 2018).
This is especially true for closely-related species such as some of those belonging to primate clades. In
some groups such as humans, for example, high mutation rates in the mtDNA can lead to a high degree of
variability between individuals (Howell et al. 1996; Wilson et al. 1985). In other primates, the transition to
transversion substitution ratio was found to be high in mtDNA (Brown et al. 1982).

Generally three strategies (described below) are in use for obtaining complete mitochondrial genome
sequences, but each of them still include procedural challenges (Rizzi et al. 2012),

  i. Direct isolation of mitochondria from the tissue following the nucleic acid purification and direct
     sequencing through an NGS platform. This method requires large quantities of tissue, and even
     commercial kits available may not be adequate when dealing with non-invasive methods as well as
     old, museum samples.
  ii. Obtain total genomic DNA, and then sequence the whole genome and extract the mitochondrial
      genome sequences through bioinformatics procedures. A challenge here is that the bioinformatics
      analysis demands infrastructure and expertise that may be hard to come by.
 iii. Obtain genomic DNA from specific tissues followed by enrichment of mitochondrial DNA through
      PCR and primer walking. This approach requires robust primer design capable of covering the entire
      mitochondrial genome, or at least fragments of the genome, which can be combined to cover entire
      region of interest. However, for some primate species, many primers do not show applicability for
    cross amplification of mitochondrial DNA from related species. This may be a reason that very few
    primate mitochondrial genomes have been published to date as compare to other organisms (Roos et
    al. 2011).

Our study reports a method for designing primers that can be effectively applied in amplification of entire
mitochondrial genomes of S. hypoleucos an endangered primate species in India and may this strategy
can be applied to closely related primate species. Primer pairs are specifically designed for covering both
large and small segments of the mitochondrial genome which demonstrate amplification challenges.

Materials And Methods
Ethical Statement

We did not perform experimentation directly on any animals; therefore ethical permission was
nonobligatory for this study. The authors do not have conflict of interest to declare.

Experimental outline

                                                  Page 3/17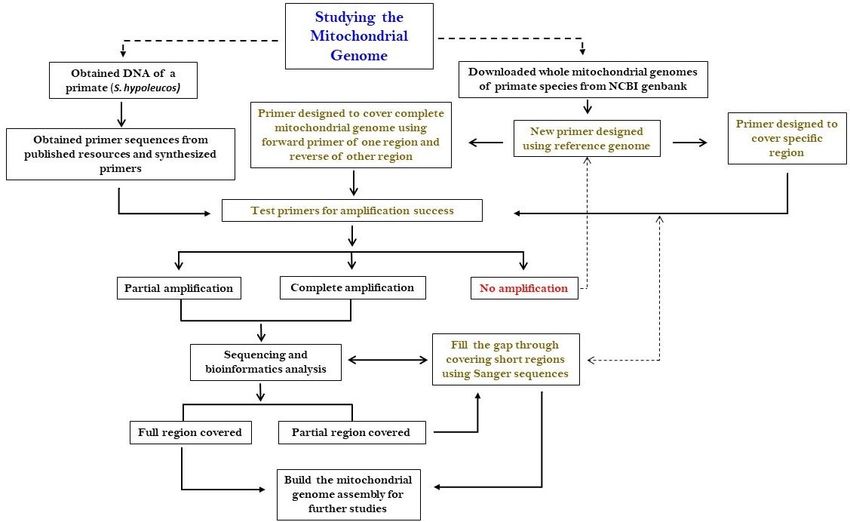
The flowchart of the primer design and optimization (PDO) protocol is provided (Fig. 1). Some of the
important steps of the PDO method are discussed in the following section.

Downloaded reference mitochondrial sequences

For the initial design of robust primer pairs, 25 whole mitochondrial genome sequences were downloaded
from NCBI Genbank and other reference sequence databases (Table 1). Among 25 species studied here,
16 belonged to Colobinae family, two are from the Ponginae, two are from the Homininae, two are from
Cercopithecinae, and one each from the Cebinae, Gorillinae and Hylobatidae.

Alignment of Sequences

The mt DNA sequences of these primate species were aligned using CodonCode aligner. Aligned regions
longer than typical primer sequences were selected to represent conserved sequences, and forward and
reverse primers were designed from them.

Primer design and testing its applicability in primate clade

Primer design is a critical part of any PCR based study. Considerations for primer design include: (i) primer
melting temperature, (ii) length and GC content of the primer, (iii) resultant PCR amplified product length,
(iv) formations of hair pin loops or other secondary structures, (v) primer specificity. In this study, twenty
four primers (12 pairs) were designed using the software program Primer3 ver. 0.4.0 (Unterssaar et al.
2012) and confirmed for their quality criteria as described above using the online tool Oligocalc (Kibbe
2007) (Table 2).

Test data

This study used pre-collected and catalogued material from S. hypoleucos from the DNA repository of
Paul Hebert Centre for DNA Barcoding and Biodiversity Studies, Aurangabad for testing the efficiency of
newly designed primers.

Results
Using the multiple sequence alignment, primers for amplifying mitochondrial DNA from the primate
species studied here were designed (Fig. 1; Table 2). As shown in Table 2, these primers have similar
length, GC content and annealing temperature requirements.

Primers designed for covering small fragments of mitochondrial region

Some primers were designed to cover shorter segments of the mitochondrial genome. Primers for the ND1,
ND2, COI, COII, 16S rRNA genes along with trnaL, trnaI, trnaQ, trnaM, trnaW, trnaA, trnaN, trnaC, trnaY,
trnaS2, trnaD, trnaK are shown in Table 2, part B. For PCR amplification, template DNAs (30 ng/µL) were
added to the PCR reaction mixture (23.7 µL) containing 2.5 µL of 10x PCR buffer (KAPA Biosystems, Inc.
Wilmington, Massachusetts, United States), 0.5 µL of 50 mM MgCl2, 2.0 µL of 2.5 mM dNTPs, 0.2 µL of
                                                   Page 4/17
Taq polymerase enzyme (5 units/µL), 0.5µL of each primer (10 mM) and 16.5 µL of nuclease free water.
The thermal cycling program used was set as follows: 950C (3 min, 1 cycle) followed by 35 cycles of 95 0C
(30 s), 480C (40 s), 72 0C (1 min) and a final extension at 72 0C (10 min). Figure 2 shows the products
generated using these primer pairs.
Primers for longer regions of the mitochondrial genome
Two primer pairs designated as PHCDBS 1F, 1R and PHCDBS 2F, 2R were designed to amplify larger
portions of the mitochondrial DNA. A combination involving other primer sets such as PHCDBS 3F and
PHCDBS 14R were also used to cover a region of 10kb (Table 2). Another primer combination (PHCDBS
14F + PHCDBS3R) was used to cover the remaining mitochondrial region of 7kb (Table 2). For PCR
amplification, template DNA samples (30 ng/µL) were added to the PCR reaction mixture (27.5 µL)
containing 12.5 µL of Q5 high fidelity 2X master mix (New England Biolabs, Ipswich, Massachusetts,
United States), 5.0 µL of template DNA and 7.5 µL nuclease free water, 1.25 µL of Forward and reverse
Primer each. The PCR thermal cycling program set as follows: 98 0C (30 s); 35 cycles of 98 0C (10 s), 50
0
C (30 s), 72 0C (6 min) followed by final extension at 72 0C (2 min). As shown in the Fig. 3, the designed
primer sets were successfully amplified by PCR.
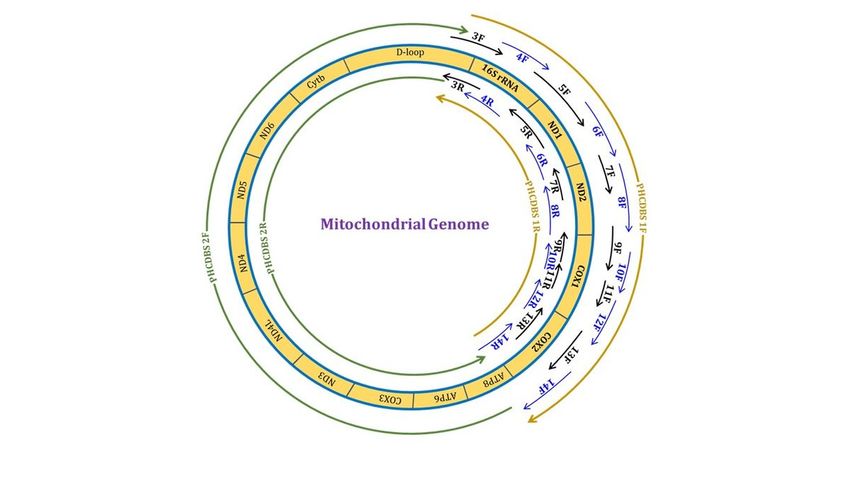
Tests of sequence coverage
To test the sequence coverage of different primer pairs, the larger fragments (I and II) were sequenced
using a next generation sequencer (Illumina HiSeq 2500). Small fragments were sequenced bidirectionally
on a Sanger Sequencing Platform (Genetic Analyzer ABI 3730 xl) using standard operating protocols.
Sequences obtained were analyzed using bioinformatic curation methods, and mitochondrial assemblies
were obtained. A graphical representation of actual primer positions and the regions covered are depicted
in Fig. 4.
This genome assembly was also compared to reference genomes and found to be fully aligned in respect
to gene order and genome coverage.
Discussion
Studies have shown that datasets derived from complete mitochondrial genome sequences appear to
offer more consistent information about evolutionary relationships among species of higher taxa such as
primates, and that these can be used effectively to establish the timescale of their evolution (Finstermeier
et al. 2013; Kurabayashi and Sumida 2013). In contrast, studies using single or small numbers of genes to
analyze evolutionary relationships have often reported rapid radiations or unresolved relationships, largely
because the conclusions are based on the use of relatively small numbers of informative sites (Matsui et
al. 2009). Phylogenies generated using complete mitochondrial genomes have also been shown to have
considerably higher levels of statistical support when compared to analyses based on single genes
(Liedigk et al. 2014). Therefore, the use of these larger datasets also has the potential to raise even a weak
phylogenetic signal to a level above that of random noise (Hillis and Bull 1993).
Page 5/17However, owing to factors such as differing transition to transversion substitution ratios between even
closely related species, it is often challenging to find primers suitable for comparative studies of complete
mitochondrial genomes. More specifically, for many primate species, even for closely related species,
attempts to use the same pair of primers for cross species amplification often fails.
The present study was planned with the goal of studying evolutionary questions related to primate
phylogeny that are yet to be resolved in general for several species (Pozzi et al. 2014), and in particular for
resolution of relationships among several primate species found in India. For this goal, a new approach
was developed to obtain complete mitochondrial genome sequences from a collection of closely related
primate species. The approach we have used is novel compared to methods used and proposed by others
(Wu et al. 2004; Chuang et al. 2006; Chen et al. 2009; Yang et al. 2009; Chang et al. 2010; Yang et al.
2010).
The protocol shown in Fig. 1 describes the method that relies first on the use of conserved regions
identified from alignments of published primate mitochondrial genomes. These alignments reveal several
conserved regions where primer design algorithms are then used to identify primers for amplification
beginning at the 5’ end of one region (such as PHCDBS 3F) and the 3’ end primer of another region (such
as PHCDBS14R). This single primer pair can amplify approximately half (6726 bp) of the entire
mitochondrial genome. In a similar manner, another primer pair using PHCDBS 14F as the 5’ prime end
primer and PHCDBS 3R as a 3’ prime end primer was used to cover another large segment (9837 bp) of
the mitochondrial genome (Fig. 5).
One of the potential challenges of using this method is the possibility of poor coverage in certain regions
(Fig. 4, Table 2). This may be due to uncertain rates of substitutions or the possible existence of
pseudogenes inserted into the nuclear genome, as suggested by various authors (Thalmann et al. 2004;
Raaum et al. 2005; Pozzi et al. 2014; Finstermeier et al. 2013). To address this, apart from the primers
used above to amplify large portions of mitochondrial genome, twelve other primer pairs were also
designed for the amplification of fragments covering smaller segments of the genome. Most of these
smaller amplification products represent the conserved regions of individual genes. These smaller
products can also be used to detect amplification of any pseudogene copies of mitochondrial genes that
may have inserted into the nuclear genome (Chiou et al. 2011). These primers were also optimized for
annealing temperatures to minimize the possibility of non-specific amplification (Figs. 1 & 2). Even at
annealing temperatures 60C lower, non-specific amplification was not observed (Schoenbrunner et al.
2017). The primers used to successfully amplify the primate mitochondrial genome of S. hypoleucos
along with their resultant sequence analysis are shown in the supporting data (Supplementary Fig. S1;
Supplementary Table S1).
Overall, this strategy may help in minimizing sequencing costs using Sanger sequencing platforms
(Ughade et al. 2019) and for validation of NGS based data in genome assemblies. The primer design also
ensures that there is sufficient overlap of the different amplified fragments in order to obtain the complete
genome sequences, including the primer sites and flanking nucleotides (Fig. 3).
Page 6/17Applying the strategy mentioned in Fig. 1 of designing primers for amplification of both long and short
segments of the mitochondrial genome can be applied to characterization of the entire mitochondrial
genome of many different closely-related species to S. hypoleucos. Beginning with a download of the
entire mitochondrial genomic sequences of a species within a given family (from Genbank or other
sources) our algorithm to design appropriate primers (Fig. 4) can easily be implemented. Subsequently,
the designed primer sets are used to validate successful PCR amplification and build the genome
assembly representing the entire mitochondrial genome from species with mitochondrial genomes that
have not yet been adequately characterized and analyzed.
Conclusion
Mitochondrial DNA represents one of the most informative molecules for evolutionary studies.
Amplification of the entire mitochondrial genome requires the use of robust primers. This study suggests a
method of primer design and optimization (PDO) where first long amplification products are produced
using 5’ primers from the conserved region of one gene and 3’ primers from conserved region of another
gene. Additional primer sets representing shorter segments of the genome are also used to fill in gaps in
order to complete the mitogenome sequencing. Using this strategy, the mitochondrial genome of S.
hypoleucos was successfully amplified and sequenced. Applying this strategy of designing primers using
conserved regions of known mtDNA sequences may be utilized for amplification and characterization of
the entire mitochondrial genome sequences from many other species where groups of closely related
species are known to exist.
Declarations
Acknowledgement
Authors are thankful to University Grants Commission, New Delhi, India for providing Junior Research
Fellowship to Vipin Hiremath. Non-invasive samples were provided by Director, Pilikula Biological Park,
Mangalore is highly acknowledged. Also we are thankful to Dr. Bharathi Prakash for her assistance in
sample collection. We sincerely thank all staff member and students at Paul Hebert Centre for DNA
Barcoding and Biodiversity Studies, Aurangabad for their assistance in completing this work.
Authors Contribution:
Vipin Hiremath: Conceiving research idea; sample collection, conduction of experiments;
Chandrakant Jadhav: Data analysis;
GD Khedkar: Conceiving research idea; writing manuscript
Competing interests: The authors do not have conflict of interest to declare.
Consent for publication: Not applicable.
Page 7/17Ethics approval consent to participate: Not applicable.
Abbreviations
MtDNA
Mitochondrial DNA; PDO:Primer design and optimization; COI:cytochrome oxidase subunit I
References
Avise JC. 1986. Mitochondrial DNA and the evolutionary genetics of higher animals. Philos Trans R Soc
Lond B Biol Sci 312:325–342.
Avise JC, Saunders NC. 1984. Hybridization and introgression among species of sunfish (Lepomis):
analysis by mitochondrial DNA and allozyme markers. Genetics 108:237–255.
Brown WM, Prager EM, Wang A, Wilson AC. 1982. Mitochondrial DNA sequences of primates: Tempo and
mode of evolution. Jour of Mol Evol 18:225–239.
Chang HW, Chou YC, Su YF, Cheng CA, Yao CT. 2010. Molecular phylogeny of the Pycnonotus sinensis and
Pycnonotus taivanus in Taiwan based on sequence variations of nuclear CHD and mitochondrial
cytochrome b genes. Biochem Syst and Eco 38:195–201.
Chang HW, Chuang LY, Cheng YH, Gu DL, Huang HW. 2010. An introduction to mitochondrial informatics.
Meth in Mol Bio 628:259–274.
Chen YF, Chen RC, Chan YK, Pan RH, Hseu YC. 2009. Design of multiplex PCR primers using heuristic
algorithm for sequential deletion applications. Comp Bio and Chem 33:181–188.
Chiou KL, Pozzi L, Lynch AJW, Di Fiore A. 2011. Pleistocene diversification of living squirrel monkeys
(Saimiri spp.) inferred from complete mitochondrial genome sequences. Mol Phylo and Evol 59 (3):736–
745. https://doi.org/10.1016/j.ympev.2011.03.025.
Dasmahapatra KK, Elias M, Hill RI, Hoffman JI, Mallet J. 2010. Mitochondrial DNA barcoding detects some
species that are real, and some that are not. Mol Eco Res 10:264–273.
de Freitas PD, Fernando LM, Karla CC, Pedro MG, Luiz LC, Alcides P, Carlos DB. 2018. Next-Generation
Sequencing of the Complete Mitochondrial Genome of the Endangered Species Black Lion Tamarin
Leontopithecus chrysopygus (Primates) and Mitogenomic Phylogeny Focusing on the Callitrichidae
Family. G3: Genes, Genomes, Genetics 8 (6):1985–1991; https://doi.org/10.1534/g3.118.200153.
Finstermeier K, Zinner D, Brameier M, Meyer M, Kreuz E, Hofreiter M, Roos C. 2013. A Mitogenomic
Phylogeny of Living Primates. PLoS ONE 8(7) https://doi.org/10.1371/journal.pone.0069504
Page 8/17Gerber AS, Loggins R, Kumar S, Dowling TE. 2001. Does non neutral evolution shape observed patterns of
DNA variation in animal mitochondrial genomes? Annual Reviews in Genetics 35:539–566.
Khedkar GD, Abhayankar SB, Nalage D, Shaikh NA, Khedkar CD. 2016a. DNA barcode based wildlife
forensics for resolving the origin of claw samples using a novel primer cocktail. Mitochondrial DNA Part A
27(6):3932–3935.
Khedkar GD, Tiknaik A, Kalyankar AD, Reddy CA, Khedkar CD, Ron TB, Haymer D. 2016b. Genetic structure
of populations and conservation issues relating to an endangered catfish, Clarias batrachus, in India.
Mitochondrial DNA Part A 27(2):1181–1187.
Hillis DM, Bull JJ. 1993.An empirical test of bootstrapping as a method for assessing confidence in
phylogenetic analysis. Syst Biol 42(2):182–192. https://doi.org/10.1093/sysbio/42.2.182.
Howell N, Kubacka I, Mackey DA. 1996. How rapidly does the human mitochondrial genome evolve? Am J
Hum Genet 59:501–509.
Kerr KCR, Lijtmaer DA, Barreira AS, Hebert PDN, Tubaro PL. 2009. Probing evolutionary patterns in
neotropical birds through DNA barcodes. PLoS ONE 4: e4379.
Kibbe WA. 2007.OligoCalc: an online oligonucleotide properties calculator.
Nucleic Acids Res. 35(Web Server issue):W43-6.
Kim SR, Kim MI, Hong MY, Kim KY, Kang PD, Hwang JS, Han YS, Jin BR, Kim I. 2009. The complete
mitogenome sequence of the Japanese oak silkmoth, Antheraea yamamai (Lepidoptera: Saturniidae). Mol
Bio Rep 36: 1871–1880
Kurabayashi A, Sumida M. 2013.Afrobatrachian mitochondrial genomes: Genome reorganization, gene
rearrangement mechanisms and evolutionary trends of duplicated and rearranged genes. BMC Genomics
14 (1). https://doi.org/10.1186/1471-2164-14-633.
Kurabayashi A, Yoshikawa N, Sato N, Hayashi Y, Oumi S, Fujii T, Sumida M. 2010.Complete mitochondrial
DNA sequence of the endangered frog Odorranaishikawae (family Ranidae) and unexpected diversity of
mt gene arrangements in ranids. Mol Phylo and Evol 56 (2):543–553.
https://doi.org/10.1016/j.ympev.2010.01.022
Li H, Handsaker B, Wysoker A, Fennell T, Ruan J. 2009. The Sequence Alignment/Map format and SAM
tools. Bioinformatics 25 (16):2078–2079. doi:10.1093/bioinformatics/btp352.
Liedigk R, Yang M, Jablonski NG, Momberg F, Geissmann T, Lwin N, Roos C. 2012. Evolutionary history of
the odd-nosed monkeys and the phylogenetic position of the newly described Myanmar snub-nosed
monkey Rhinopithecus strykeri. PLoS ONE7 (5). https://doi.org/10.1371/journal.pone.0037418.
Page 9/17Pozzi L, Hodgson JA, Burrell AS, Sterner KN, Raaum RL, Disotell TR. 2014. Primate phylogenetic
relationships and divergence dates inferred from complete mitochondrial genomes. Mol Phylo and Evol
75(2014):165–183.
Ma LL, Zhang XY, Yue BS, Ran JH. 2010. Complete mitochondrial genome of the Chinese Monal pheasant
Lophophorus lhuysii, with phylogenetic implication in Phasianidae. Mitochondrial DNA 21:5–7.
Matsui A, Rakotondraparany F, Munechika I, Hasegawa M, Horai S. 2009.Molecular phylogeny and
evolution of prosimians based on complete sequences of mitochondrial DNAs. Gene 441(1–2):53–66.
https://doi.org/10.1016/j.gene.2008.08.024
Nabholz B, Glemin S, Galtier N. 2009. The erratic mitochondrial clock: variations of mutation rate, not
population size, affect mtDNA diversity across birds and mammals. BMC Evol Bio 9:54.
Oakenfull EA, Lim HN, Ryder AO. 2000. A survey of equid mitochondrial DNA: Implications for the
evolution, genetic diversity and conservation of Equus. Cons Genet 1:341–355.
Pozzi L, Hodgson JA, Burrell AS, Sterner KN, Raaum RL, Disotell TR. 2014. Primate phylogenetic
relationships and divergence dates inferred from complete mitochondrial genomes. Mol phylo and evol
75:165–183. doi:10.1016/j.ympev.2014.02.023
Raaum RL, Sterner KN, Noviello CM, Stewart CB, Disotell TR. 2005. Catarrhine primate divergence dates
estimated from complete mitochondrial genomes: Concordance with fossil and nuclear DNA evidence.
Jourl of Hum Evol 48(3): 237–257. https://doi.org/10.1016/j.jhevol.2004.11.007.
Ramos A, Santos C, Barbena E, Mateiu L, Alvarez L, Nogués R, Aluja MP. 2011. Validated primer set that
prevents nuclear DNA sequences of mitochondrial origin co-amplification: A revision based on the New
Human Genome Reference Sequence (GRCh37). Electrophoresis 32 (6–7):782–783.
https://doi.org/10.1002/elps.201000583.
Rizzi E, Lari M, Gigli E, De Bellis G, Caramelli D. 2012.Ancient DNA studies: New perspectives on old
samples. Gen Sel Evol https://doi.org/10.1186/1297-9686-44-21.
Roos C, Zinner D, Kubatko LS, Schwarz C, Yang M, Meyer D, Osterholz M. 2011. Nuclear versus
mitochondrial DNA: Evidence for hybridization in colobine monkeys. BMC Evol Bio 11(1).
https://doi.org/10.1186/1471-2148-11-77.
Schoenbrunner NJ, Gupta AP, Young KKY, Will SG. 2017. Covalent modification of primers improves PCR
amplification specificity and yield. Bio Meth and Proto 2 (1). https://doi.org/10.1093/biomethods/bpx011.
Thalmann O, Hebler J, Poinar HN, Pääbo S, Vigilant L. 2004. Unreliable mtDNA data due to nuclear
insertions: A cautionary tale from analysis of humans and other great apes. Mol Eco 13 (2):321–335.
https://doi.org/10.1046/j.1365-294X.2003.02070.x
Page 10/17Ughade BR, Khilare VC, Sangale DM, Korhale GA, Ingle P, Tathe, AE, Khedkar GD. 2019. A definitive method
for distinguishing cultivated onion from its weedy mimic, Asphodelus fistulosus, at multiple
developmental stages. Weed Research 59(1):39–48. https://doi.org/10.1111/wre.12337.
Untergasser A, Cutcutache I, Koressaar T, Ye J, Faircloth BC, Remm M, Rozen SG. 2012. Primer3 - new
capabilities and interfaces. Nucl Acids Res 40 (15):e115.
Webb DM, Moore WS. 2005.A phylogenetic analysis of woodpeckers and their allies using 12S, Cytb, COI
nucleotide sequences (class Aves; order Piciformes). Mol Phylo and Evol 36:233–248.
Wilson AC, Cann RL, Carr SM, George M, Gyllensten UB, Bychowski KMH, Higuchi RG. 1985. Mitochondrial
DNA and Two Perspectives on Evolutionary Genetics. Bio Jour of the Linn Soc 26(4):375–400.
doi:10.1111/j.1095-8312.1985.tb02048.x.
Wu JS, Lee C, Wu CC, Shiue YL. 2004. Primer design using genetic algorithm. Bioinformatics 20:1710–
1717.
Yang CH, Cheng YH, Chuang LY, Chang HW. 2009. Specific PCR product primer design using memetic
algorithm. Biotechnological Progress 25:745–753.
Yang CH, Cheng YH, Chang HW, Chuang LY. 2010. Primer design with specific PCR product using particle
swarm optimization. Inter Jour of Chem and Bio Eng 3:18–23.
Zhang K, Xiang HT, Zhao, SC. 2017. The complete mitochondrial genome of the drill (Mandrillus
leucophaeus). Mitochondrial DNA Part A 28(1):69–70. https://doi.org/10.3109/19401736.2015.1110802
Tables
Table 1. List of reference sequences of primate species used for primer designing
Page 11/17Sr. No. Species Name Accession number Sub family Family
1 T. vetulus NC_019582.1 Colobinae Cercopithecidae
2 T. shortridgei KP834334.1 Colobinae Cercopithecidae
3 T. pileatus NC_024529.1 Colobinae Cercopithecidae
4 T. obscurus AY863425.1 Colobinae Cercopithecidae
5 T. johnii NC_019583.1 Colobinae Cercopithecidae
6 T. hatinhensis NC_019579.1 Colobinae Cercopithecidae
7 T. germaini NC_019580.1 Colobinae Cercopithecidae
8 T. francoisi NC_023970.1 Colobinae Cercopithecidae
9 T. cristatus NC_023971.1 Colobinae Cercopithecidae
10 S. entellus DQ355297.1 Colobinae Cercopithecidae
11 P. roxellana DQ355300.1 Colobinae Cercopithecidae
12 P. nemaeus DQ355302.1 Colobinae Cercopithecidae
13 P. badius DQ355301.1 Colobinae Cercopithecidae
14 P. melalophos DQ355299.1 Colobinae Cercopithecidae
15 P. pygmaeus NC_001646.1 Ponginae Hominidae
16 P. abelii NC_002083.1 Ponginae Hominidae
17 P. hamadryas NC_001992.1 Cercopithecinae Cercopithecidae
18 P. troglodytes NC_001643.1 Homininae Hominidae
19 P. paniscus NC_001644.1 Homininae Hominidae
20 N. larvatus DQ355298.1 Colobinae Cercopithecidae
21 M. sylvanus NC_002764.1 Cercopithecinae Cercopithecidae
22 H. lar NC_002082.1 -- Halobatidae
23 G. gorilla NC_001645.1 Gorillinae Hominidae
24 C. guereza AY863427.1 Colobinae Cercopithecidae
25 C. albifrons NC_002763.1 Cebinae Cebidae
Table 2. Details of primers designed to amplify mitochondrial genome of S. hypoleucos
Figures
Page 12/17Primer Forward Primer Products Tm GC% Annealing Predicted Primer position
name Sequence ( 0C) temp. ( 0C) product
Start End
size
A. Primers designed for amplification of large fragments
PHCDBS ATAC TAGC Left half region 46 45 55.3 6726 1092 7818
1F CCAA ATCC between 16S rRNA and
CAAC COII
PHCDBS TTTA GCTG 40 53.2
1R AGGC ATTT
CACT
PHCDBS CCCG CAGT Right half region 46 40 53.2 9837 7819 1091*
2F TATT TTAG TCTT between COII and 16S
PHCDBS CCAG GAGA rRNA 40 53.2
2R ATTC ATTC
ATGT
B. Primers designed for amplification of small fragments
PHCDBS ATAC TAGC 16SrRNA 44 45 55.3 659 1092 1750
3F CCAA ATCC 53.2
CAAC
PHCDBS CCAG GAGA 40
3R ATTC ATTC
ATGT
PHCDBS ACCT AGAA 16SrRNA 48 40 53.2 651 1640 2290
4F AAAT CCCA 55.3
GACA
PHCDBS TGAC TTGT 45
4R GTGG TCTT
AGCA
PHCDBS TAAA TCCA 16SrRNA, tRNA-L, ND1 48 45 55.3 656 2182 2837
5F CGGA CCTA 55.3
ACAC
PHCDBS TGGG TCCT 45
5R TTAC GTAG
TTGT
PHCDBS TTAC TTTA CCCA ND1, tRNA-I, tRNA-Q 48 45 55.3 650 2751 3400
6F TCCT AGCC 51.2
PHCDBS TATG AAGA 35
6R AAAG GGCA
AATG
PHCDBS CCCT TTTC TTCA tRNA-Q, tRNA-M, ND2 48 45 55.3 576 3387 3962
7F TAGC TGAG 57.3
PHCDBS GTGG GAGC 50
7R TAAG TGAG
GTAA
PHCDBS TTGG TTAT ATCC ND2, tRNA-W, tRNA-A 48 36.36 54.7 685 3865 4549
8F TTCC CATA CT 57.3
PHCDBS AGGC TTAG 50
8R AGCT AGGA
ATGC
PHCDBS TCCT AGCA tRNA-N, tRNA-C, 46 38.10 54.0 689 4420 5108
9F TACT CTTC tRNAY, COI 51.2
AATCA
PHCDBS AGGT TTTT 35
9R GTGG GTTT
GAAT
PHCDBS TACT CTGC COI 48 45 55.3 632 5023 5654
10F ATCA ACTG 55.3
Page 13/17AACG
PHCDBS GTAG AAAT 45
10R GATG GTGG
GAGA
PHCDBS ATTT CCCC GTCT COI 48 35 51.2 581 5602 6182
11F AAAC AATA 53.2
PHCDBS CAAT AAAG 40
11R CCTA GGAA
TCCA
PHCDBS TGGA TTCC COI, tRNA-S2, tRNA- 48 40 53.2 610 6163 6772
12F TAGG CTTT D 51.2
ATTG
PHCDBS TAGA ACTT 35
12R TGCG TTTT
GAAG
PHCDBS GGCT CCTT TATT COII 48 45 55.3 606 6692 7297
13F TCCC TAGT 55.3
PHCDBS GATG GTAA 45
13R AGGA GGGG
TTAT
PHCDBS CCCG CAGT COII, tRNA-K 48 40 53.2 608 7211 7818
14F TATT TTAG TCTT
PHCDBS TTTA GCTG 40 53.2
14R AGGC ATTT
CACT
Figure 1
Page 14/17Flow chart of primer design and PDO for mitochondrial genome studies
Figure 2
Gel images showing the amplification success of the newly designed set of primers for shorter segments
of the mitochondrial genome.
Figure 3
Gel images showing the amplification success of the newly designed setsof primers. L- 10KB ladder; A-
amplified product 10 kb and B-amplified product 7kb)
Page 15/17Figure 4
Circular mitochondrial diagram showing the position of primers and regions covered (Shorter + Larger
fragments).
Page 16/17Figure 5
Circular mitochondrial diagram showing the position of primers and regions covered (Larger fragments).
Supplementary Files
This is a list of supplementary files associated with this preprint. Click to download.
SupportingFigureS1.jpg
SupplementarytableS1.docx
Page 17/17You can also read