PROFITABLE SILVER PRODUCER POSITIONED TO GROW - Corporate Presentation February 2023
←
→
Page content transcription
If your browser does not render page correctly, please read the page content below
PROFITABLE SILVER PRODUCER
POSITIONED TO GROW

Corporate Presentation
                         TSX: SVM | NYSE AMERICAN: SVM
February 2023                                        1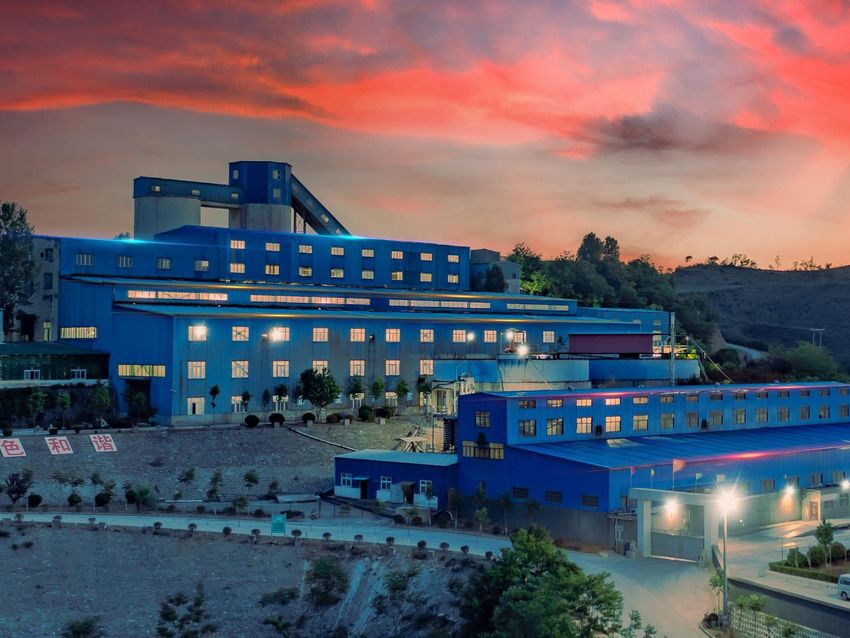
CAUTIONARY STATEMENTS
                                                                                                                                                                     TSX: SVM | NYSE AMERICAN SVM

Cautionary Note Regarding Forward-Looking Information and Forward-Looking Statements
This presentation includes statements concerning future operations, prospects, strategies, plans, projections, forecasts, financial conditions and economic performance, as well as intentions
and objectives, that are “forward-looking statements” within the meaning of the United States Private Securities Litigation Reform Act of 1995 and “forward-looking information” within the
meaning of applicable Canadian provincial securities laws (collectively, “forward-looking statement”). Forward-looking statements are typically identified by words such as: “anticipates,”
“expects,” “believes,” “forecasts”, “projects”, “estimates,” “seeks,” “plans,” “intends”, “strategies”, “targets”, “goals”, “objectives”, “budgets”, “schedules”, “potential” or variations thereof or
stating that certain actions, events or results “may”, “could”, “would”, “might” or “will” be taken, occur or be achieved, or the negative of any of these terms and similar expressions. All
statements, other than statements of historical fact, included in this presentation including, without limitation, the anticipated business plans and timing of future activities of Silvercorp Metals
Inc. (the “Company” or “Silvercorp”), the possibility, timing and amount of estimated future production, costs of production, and reserve determination and reserve conversion rates, and
statements with respect to the price of silver, lead and zinc, are forward-looking statement. Forward-looking statements are necessarily based upon a number of assumptions, estimates,
beliefs, expectations and opinions as of the date of the disclosure that, while considered reasonable by management, are inherently subject to significant uncertainties and contingencies.
Forward-looking statements by the Company are not guarantees of future results or performance, and actual results may differ materially from those in forward-looking statements as a result of
known and unknown risks, uncertainties and various other factors. Such risks and uncertainties include fluctuations in precious metal prices, unpredictable results of exploration activities,
uncertainties inherent in the estimation of mineral reserves and resources, fluctuations in the costs of goods and services, problems associated with exploration, development and mining
operations, changes in legal, social or political conditions in the jurisdictions where the Company operates, delays in obtaining governmental permits and approvals, lack of appropriate funding,
accidents, other risks of the mining industry, risks relating to epidemics or pandemics such as COVID–19 and other risk factors as discussed in the Company’s filings with Canadian and United
States securities regulatory agencies. Should one or more of these risks or uncertainties materialize, or should underlying assumptions or estimates prove incorrect, actual results may vary
materially from those anticipated, believed, estimated or expected. The Company cautions readers not to place undue reliance on any such forward-looking statements, which speak only as of
the date made. The Company disclaims any obligation to update any forward-looking statements in this presentation, except as otherwise required by law. No securities regulatory authority
has in any way passed on the merits of this presentation nor any securities referred herein.
Cautionary Note to U.S. Investors concerning estimates of Measured, Indicated and Inferred Resources
Silvercorp has prepared disclosure in accordance with Canadian reporting standards, which differ significantly from the current requirements of the U.S. Securities and Exchange Commission
(the “SEC”) set out in Industry Guide 7. The terms “proven mineral reserve”, “probable mineral reserve” and “mineral reserves” used in this presentation are in reference to the mining terms
defined in the Canadian Institute of Mining, Metallurgy and Petroleum Standards (the “CIM Standards”), which definitions have been adopted by National Instrument 43-101 Standards of
Disclosure for Mineral Projects (“NI 43-101”) and differ from the definitions in the SEC’s Industry Guide 7. “Reserves” under the CIM Standards may not qualify as reserves under Industry
Guide 7. Under SEC Industry Guide 7, a mineral reserve is defined as a part of a mineral deposit, which could be economically and legally extracted or produced at the time the reserve
determination is made. Accordingly, information contained in this presentation providing descriptions of our mineral deposits in accordance with NI 43-101 may not be comparable to similar
information made public by other U.S. companies subject to the United States federal securities laws and the rules and regulations thereunder. In addition, the terms “mineral resource”,
“measured mineral resource”, “indicated mineral resource” and “inferred mineral resource” are defined in the CIM Standards and are required to be disclosed by NI 43-101; however, these
terms are not defined terms under SEC Industry Guide 7 and are normally not permitted to be used in reports and registration statements filed with the SEC. Investors are cautioned not to
assume that any part or all of mineral deposits in these categories will ever be converted into reserves. “Inferred mineral resources” are that part of a mineral resource for which quantity and
grade or quality are estimated on the basis of limited geological evidence and sampling. Such geological evidence is sufficient to imply but not verify geological and grade or quality continuity.
However, it is reasonably expected that the majority of inferred mineral resources could be upgraded to indicated mineral resources with continued exploration. Under Canadian rules,
estimates of inferred mineral resources may not form the basis of feasibility or pre-feasibility studies, except in rare cases. Investors are cautioned not to assume that all or any part of an
inferred mineral resource is economically or legally mineable. Disclosure of “contained ounces” in a resource is permitted disclosure under Canadian regulations; however, the SEC normally
only permits issuers to report mineralization that does not constitute “reserves” by SEC standards as in place tonnage and grade without reference to unit measures.
Effective February 25, 2019, the SEC adopted new mining disclosure rules under subpart 1300 of Regulation S-K of the United States Securities Act of 1933, as amended (the “SEC
Modernization Rules”), with compliance required for the first fiscal year beginning on or after January 1, 2021. The SEC Modernization Rules replace the historical property disclosure
requirements included in SEC Industry Guide 7. As a result of the adoption of the SEC Modernization Rules, the SEC now recognizes estimates of “Measured Mineral Resources”, “Indicated
Mineral Resources” and “Inferred Mineral Resources”. In addition, the SEC has amended its definitions of “Proven Mineral Reserves” and “Probable Mineral Reserves” to be substantially
similar to corresponding definitions under the CIM Standards. During the period leading up to the compliance date of the SEC Modernization Rules, information regarding minimal resources or
reserves contained or referenced in this presentation may not be comparable to similar information made public by companies that report according to U.S. standards. While the SEC
Modernization Rules are expected to be “substantially similar” to the CIM Standards, readers are cautioned that there are differences between the SEC Modernization Rules and the CIM
Standards.

                                                                                                                                                                                        2
COMPELLING VALUE FOR PROFITABLE AND
GROWING SILVER PRODUCER                                               TSX: SVM | NYSE AMERICAN SVM

 Market Cap $521M*
                           • $0 debt, no financing since 2010
                           • Strategy – worldwide M&A targeting >$50M annual FCF
                               • High margin/long mine life with reasonable capital
                                  expenditures and timelines
       Cash                • US$0.025/share annual dividend
      $210 M               • >$175 M in dividends and buybacks since inception

                           • New Pacific (28.2%) worth $109* M; ~3X increase
                           • Strategy – investments and incubation for growth
Value of Mining Equity
       $122 M
                           •   Average Analyst Mining Asset NAV = ~$575 M
                           •   Strategy – consistently profitable, with growth
                           •   $91.3 M 4Q trailing OCF
Mining Assets/Implied EV   •   Q3 US$9.28 AISC/oz of Ag production
        $189 M             •   Optimizing mines and increasing mill capacity
                           •   ~8 Moz Ag/year by FY2026 – vs. 6.6 Moz in FY2023
                           •   17+ year ESG & government relations commitment
                                                                                 3
                           * As of February 27, 2023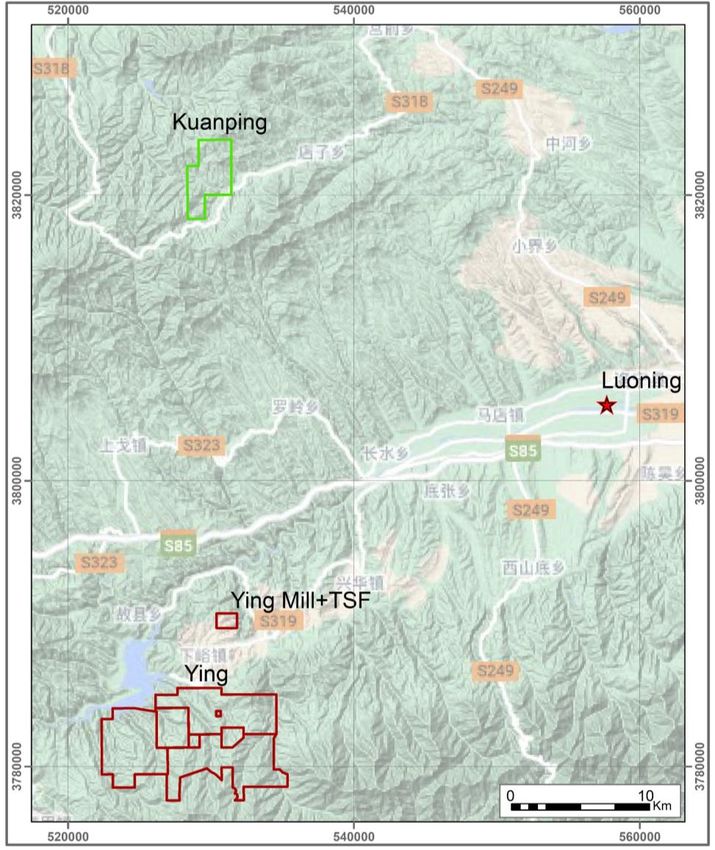
STABLE & PROFITABLE SILVER PRODUCER
 POSITIONED TO GROW                                                                    TSX: SVM | NYSE AMERICAN SVM

Historical Production
(April 2006 – December 2022)
                                        Ying Mining District, Henan Province
                                        (SGX, HPG, HZG, TLP, LME, LMW and DCG mines)
• Silver: +87 Moz.
• Lead + Zinc: +1.2 Blbs.
• Profit Distribution: >US$520M
• +15 year mine life remaining

China Advantages:
• Close to customers (smelters)
• Close to suppliers                 BYP Mine, Hunan
• Capable & disciplined work force   Province
                                     (Care and Maintenance)
• Stable mining regulations
• Free market for metal                                       GC Mine, Guangdong Province
• Free profit distribution
• 2022 FDI surged ~10% to $189
  billion                                                                                             4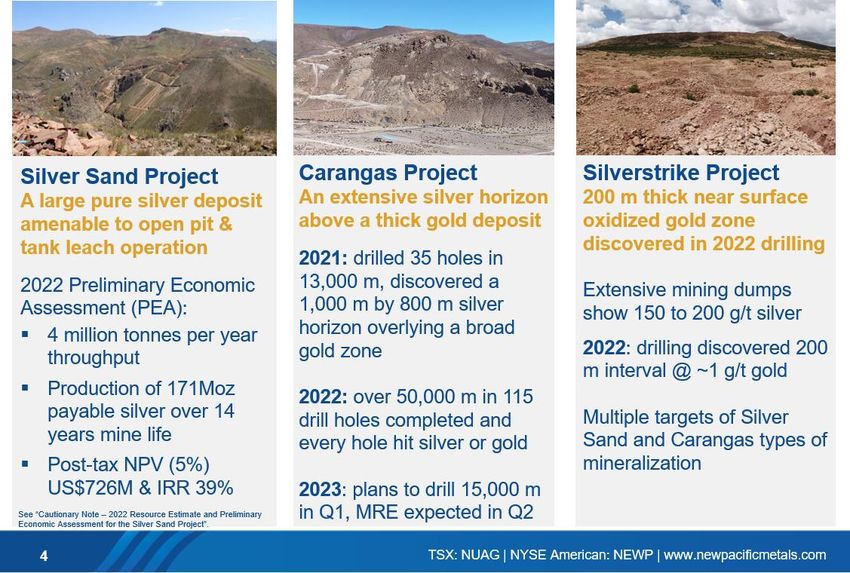
MANAGEMENT FOCUS ON GENERATING
FREE CASH FLOW                                                                           TSX: SVM | NYSE AMERICAN SVM

      Asset Quality – Lower Cost, Higher Margin Compared to Peers
                           (1)

                                                                                                                     8.5%
                                  41%

                          (2)

                                                                       Calendar Year

                                                                         (3)                                   (3)

                                                          (3)                                    (4)
                                  $9.28

                                          1)    Indicated in calendar quarters
                                          2)    Net of by-product credits
                                          3)    Changed reporting basis to AgEq
                                          4)    Only reflects silver segment
                                          •    Data Source: Capital IQ, Company filing
          Calendar Year                                                                                 5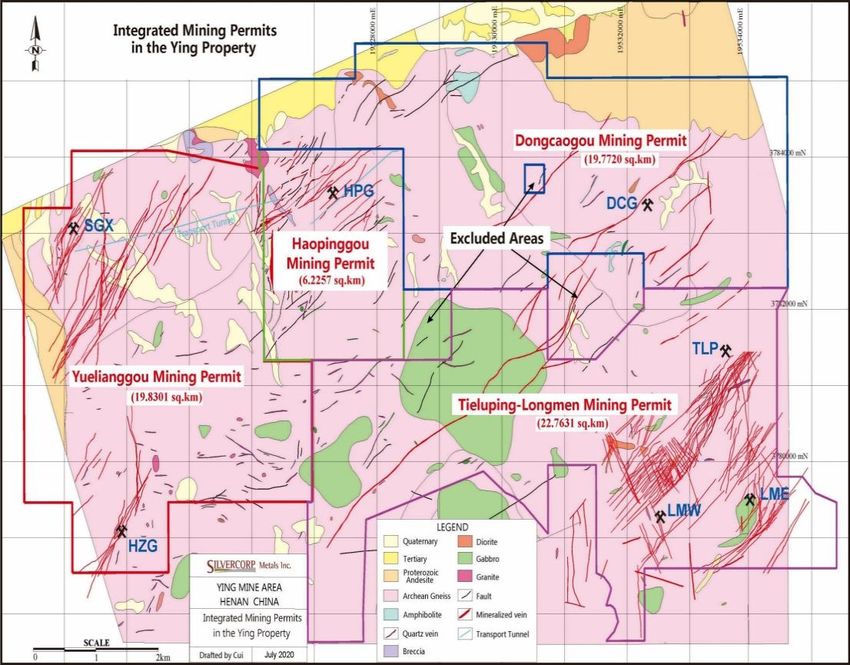
MANAGEMENT FOCUS ON GENERATING
FREE CASH FLOW                                                                                                                        TSX: SVM | NYSE AMERICAN SVM

                         Calendar Year                                                                         Calendar Year
Adjusted net income = adjusted for one-time non-cash items, FX gain(loss),      Free cash flow = operating cash flow less capital expenditures, less capital lease
investment in associates gain(loss), equity investments gain(loss) and share-   payments
based compensation
                                                                                                                                                    6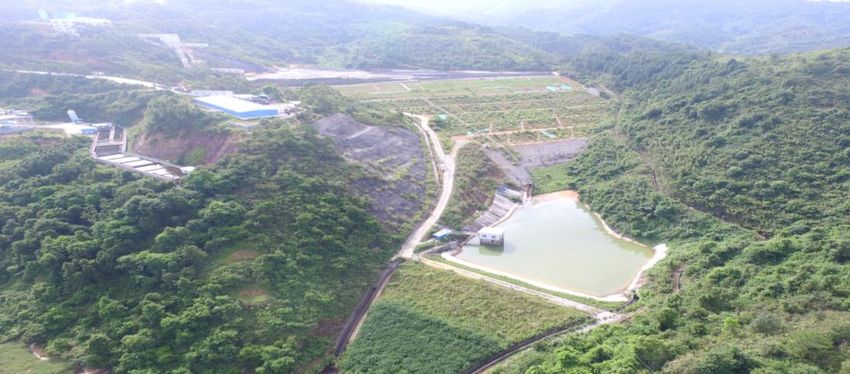
PROVIDING VALUE FOR INVESTORS
                                                                                                                          TSX: SVM | NYSE AMERICAN SVM

•   Stock prices as of February 27, 2023; LTM results are most recent reported. Data Source: Capital IQ, Company filing                  7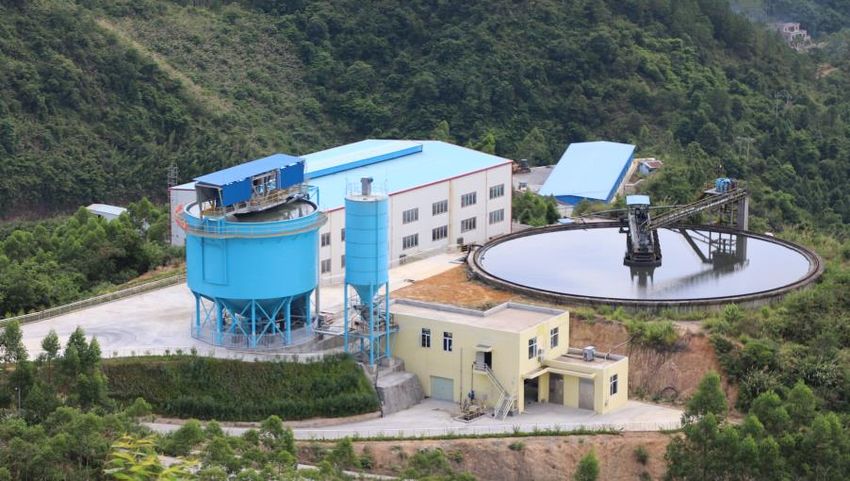
YING DISTRICT – GROWTH THROUGH DRILLING,
  OPTIMIZATION, EXPANSION, & CONSOLIDATION          TSX: SVM | NYSE AMERICAN SVM

Drilled ~1,000,000 m in 2020-2022
 • 270,000+ metres planned in FY2024
 • Extensions of known mineralization & newly
   discovered Au veins in resource area
Mine optimization in progress
 • Improved mine planning and mill head
   grades with XRT ore sorting at nominal cost
 • Maximizing mining recovery with paste
   backfill
Constructing new 3,000 t/d mill & TSF
 • US$30 million mill construction awaiting
   environmental approvals
 • US$38 million 20M m3 tailings storage
   facility (TSF) commenced
Advancing the Kuanping project
 • 12.39 km2 located ~33 km north of Ying
 • 6 silver-lead-zinc vein structures and 1 gold-
   silver vein structures defined
 • Mining license received; preparing
   environmental protection, mine safety and
   design reports                                                  8
EXTENSIVE EXPLORATION FOR ORGANIC GROWTH
                                                                            TSX: SVM | NYSE AMERICAN SVM

                        Silvercorp’s extensive drilling & tunnelling
        Ying:    2,210 km of drilling and 735 km of tunnelling since 2004
        GC:      395 km of drilling and 100 km of tunnelling since 2004
KM

                                           Calendar Year
Benefits of drilling:
1)    Made new discoveries, including gold and gold-copper zones
2)    Increased FY2024 production
3)    Resource and reserve replacement in updated NI 43-101 MRE
4)    Deferring mine development at greater depths, or even mining at shallower depths
5)    Reducing amount of tunnel development and sustaining capital
6)    Improving mine planning to boost productivity and reduce costs
                                                                                           9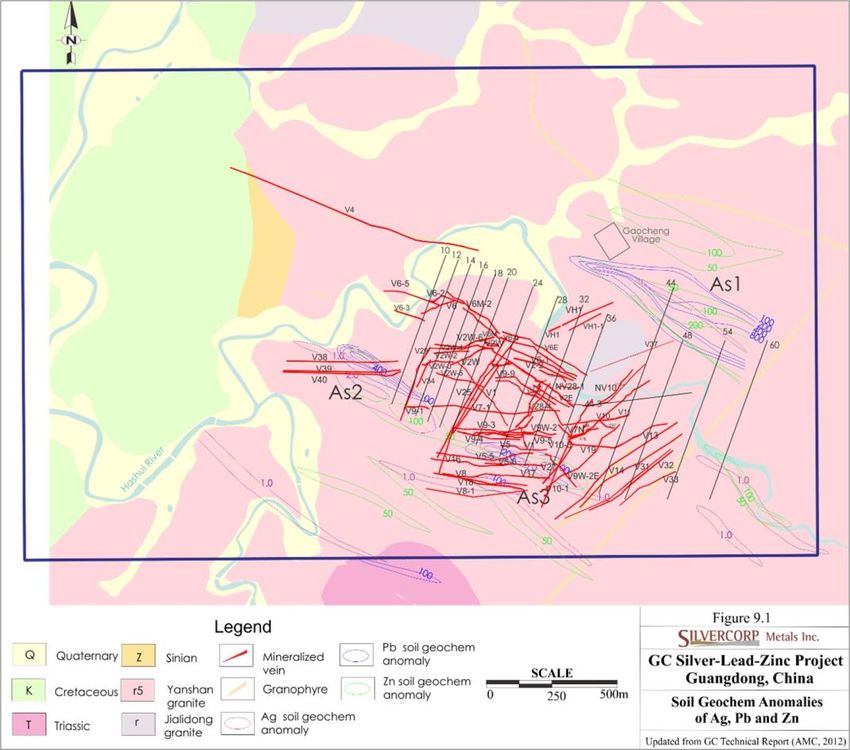
ORGANIC PRODUCTION GROWTH
                                                                                                                                       TSX: SVM | NYSE AMERICAN SVM

                                                                       Fiscal Year
Silvercorp’s fiscal year is April 1-March 31
* Consolidated Fiscal 2023 silver production based on nine-month output (Apr. 1 to Dec. 31, 2022) plus expected Fiscal Q4 production
** Mid-point of guidance. Expected Fiscal 2024 Ying production includes silver equivalent gold production at a 65:1 ratio
                                                                                                                                                     10
RESERVE AND RESOURCE GROWTH THROUGH
EXTENSIVE EXPLORATION TSX: SVM | NYSE AMERICAN SVM
Extensive Drilling & Tunnelling Grows Silver Reserves & Resources Net of Depletion
(Remaining Mining Life >15 Years)
Historical Production
Silver: > 87 Moz.
Lead + Zinc: > 1.2 Blbs.
Calendar Year
• See Appendix III, IV and V for breakout of Measured, Indicated and Inferred, Which is inclusive of Proven and Probable categories.
• Silver equivalent was calculated by converting Gold at a rate of 65:1, but excluding Lead and Zinc
11INCUBATING WORLD CLASS OPPORTUNITIES
– WHY NEW PACIFIC METALS TSX: SVM | NYSE AMERICAN SVM
12CATALYSTS TSX: SVM | NYSE AMERICAN SVM
1) Increased production for FY2024
2) Additional drilling to upgrade resources to reserves and make new discoveries
3) Mine optimization programs at Ying and GC
4) Advance Kuanping to construction status with updated plan and cost estimates
5) Constructing a new mill and TSF to increase Ying milling capacity to ~5,000 t/d
6) Obtain BYP gold mining permit and determine next steps
7) New Pacific value creation through project advancement and key milestones
8) Potential acquisition(s)
13LONG-TERM COMMITMENT TO RESPONSIBLE
MINING & ESG TSX: SVM | NYSE AMERICAN SVM
Safety, Efficiency, Sustainability
• Build a strong corporate culture in safety, social ecological systems and harmonious
environments
• Integrate innovative technology to optimize our operations
• Continuously being largest taxpayer to sustain local social programs
• Generate sustainable economic, social, and environmental value for all stakeholders
14FY2022 SUSTAINABILITY REPORT
TSX: SVM | NYSE AMERICAN SVM
Highlights of Our Responsible Performance & Accomplishments
HEALTH & SAFETY ENVIRONMENT SOCIAL GOVERNANCE
• Zero work-related • Zero material • Zero grievances • Formed
fatalities incidents • Donated to public Sustainability
• 100% of • EMS ISO 14001 welfare projects Committee and
operations are ISO certification • Helped to promote ESG Management
45001 certified • $2.1 million development in Centre
• LTIR reduced for invested in education, tourism, • Disclosure
third year in a row environmental and public Standard aligned
protection infrastructure with UN SDGs
• Carried out 1,118 • Supports Diversity
hours of & Inclusion and
environmental Human Rights
protection training Statements
15OWNERSHIP & COVERAGE
TSX: SVM | NYSE AMERICAN SVM
Top 10 Institutional Investors % O/S Analyst Coverage
1 Van Eck Associates 4.74 Canada
Ryan Thompson BMO Capital Markets
2 Global X Management 2.73
Felix Shafigullin Eight Capital
3 Renaissance Technologies 2.32
Justin Stevens PI Financial
4 Connor Clark & Lunn 1.67 Dalton Baretto Canaccord Genuity
5 ETF Managers Group 1.51 Craig Stanley Raymond James
6 Acadian Asset Management 1.33 Gabriel Gonzalez Echelon Capital Markets
US
7 Two Sigma Advisors 1.32 Joe Reagor Roth Capital
8 Stabilitas GmbH 1.30
9 DZ Privatbank S.A. 1.30
10 BlackRock Fund Advisors 1.26
Source: BD Corporate & CIQ February 2023 Data
16HEAD OFFICE Suite #1750 1066 West Hastings St. Vancouver, BC, Canada V6E 3X1 Tel: 604-669-9397 Fax: 604-669-9387 Toll-Free: 1-888-224-1881 Investor@silvercorp.ca www.silvercorp.ca Watch The Most Recent Interview Silvercorp’s disclosure documents are available from the System for Electronic Document Analysis and Retrieval (SEDAR) at www.sedar.com TSX: SVM NYSE AMERICAN: SVM 17
APPENDICES

                       TSX: SVM
                            18
             NYSE AMERICAN: SVM
LEADERSHIP: A SOLID HISTORY OF VALUE
CREATION TSX: SVM | NYSE AMERICAN SVM
Management Board of Directors
Rui Feng, Ph.D., Geology
Rui Feng, Ph.D., Geology
Chairman and CEO
Derek Liu, MBA, CGA, CPA David Kong, CA, CPA, Former Ernst &
Chief Financial Officer Young LLP Partner; over 30 years PubCo.
experience
Lon Shaver, CFA
Vice President Yikang Liu, Former Dep. Gen. Sec. of the
China Mining Assoc.; over 40 years
geological experience
Paul Simpson, Securities lawyer; 20 years
experience advising natural resources
companies
Marina Katusa, BSc., MBA, over 10 years
experience in geology and corporate
development
Ken Robertson, CA, CPA, ICD.D, over 35
years of public accounting experience in
19
Canada and EnglandFISCAL 2023 PRODUCTION AND CAPEX
TSX: SVM | NYSE AMERICAN SVM
FY2023 Production
Head grades Metal production Production costs
Ore processed Silver Lead Zinc Silver Gold Lead Zinc Cash cost AISC*
(tonnes) (g/t) (%) (%) (Koz) (Koz) (Klbs) (Klbs) ($/t) ($/t)
Nine months ended December 31, 2022 Actual
Ying Mining District 642,147 262 3.9 0.7 5,027 3.4 50,566 5,986 92.35 141.66
GC Mine 251,114 73 1.3 2.8 484 - 6,564 13,900 56.51 83.02
Consolidated 893,261 209 3.2 1.3 5,511 3.4 57,130 19,886 77.73 136.90
Expected Q4 Fiscal 2023 results
Consolidated 175,000 1,100 1.0 11,200 4,300
FY2023 Capital Expenditures
Expensed Expensed
Capitalized Development and Expenditures
Tunnelling Drilling
Exploration and Capitalized Exploration Equipment, Mining Exploration
Ramp Development Total
Development Tunnels Drilling Mill and TSF Preparation Drilling
(Metres) ($ Thousand) (Metres) ($ Thousand) (Metres) ($ Thousand) ($ Thousand) ($ Thousand) (Metres) (Metres)
Nine months ended December 31, 2022 Actual
Ying Mining District 5,469 $ 4,127 51,118 $ 20,636 108,023 $ 4,933 $ 10,278 $ 39,974 26,162 110,449
GC Mine - - 10,503 $ 3,275 15,052 $ 555 $ 2,719 $ 6,549 5,579 39,655
Corporate and others - - - - 8,485 $ 1,744 $ 99 $ 1,843 - -
Consolidated 5,469 $ 4,127 61,621 $ 23,911 131,560 $ 7,232 $ 13,096 $ 48,366 31,741 150,104
Expected Q4 Fiscal 2023 results
Consolidated 1,500 $ 1,200 13,400 $ 6,000 27,800 $ 800 $ 5,200 $ 13,200 7,000 20,600
20FISCAL 2024 PRODUCTION AND CAPITAL
EXPENDITURE GUIDANCE TSX: SVM | NYSE AMERICAN SVM
FY2024 Production Guidance
FY2024 Capital Expenditure Guidance
21REVENUE PERCENTAGE BY METAL
TSX: SVM | NYSE AMERICAN SVM
Base Metals: 43%
Gold: 3%
Silver: 54%
Calendar Quarters
22LONG-TERM COMMITMENT TO RESPONSIBLE
MINING & ESG TSX: SVM | NYSE AMERICAN SVM
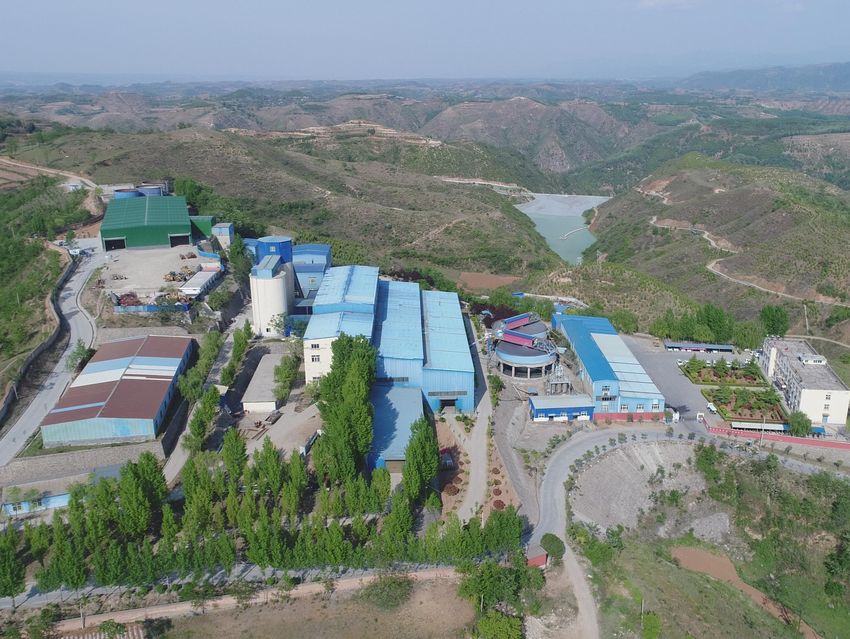
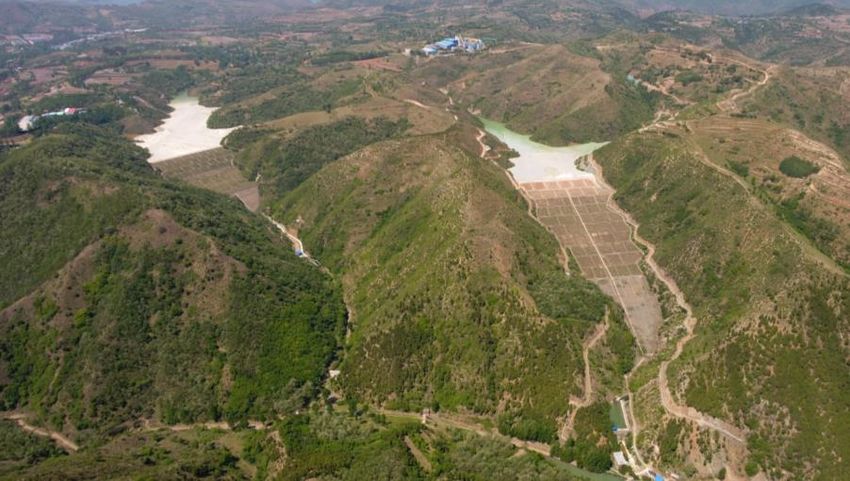
Construct Green Mines Solid Waste Reduction Initiatives
GC Mine Site (Birds Eye View) GC Mine Tailings Back Fill Facility
Ying Tailings Storage Facility Ying 1 M t/y waste rock aggregate 23
plantLONG-TERM COMMITMENT TO RESPONSIBLE
MINING & ESG TSX: SVM | NYSE AMERICAN SVM
Recycle treated waste water to mills for milling Environment Management Certificates
SGX Mine waste water treatment system
2022 ESG Best Practice Award
24
GC Mine tailings dry stackingYING MINING DISTRICT, HENAN
TSX: SVM | NYSE AMERICAN SVM
• SGX, TLP, LME, LMW, HPG, HZG and
DCG underground mines have Ying Mining District: 4 mining permits 68.59km²
identified over 300 veins
• 2 mills of 3,200 tpd capacity produce
silver-lead and zinc concentrates
• 6 smelters within 200 km ²
• Produced over 80 Moz of silver & 1 ¹
Blbs of lead & zinc since 2006
• >2.2 M metres of drilling extends ¹
mine life >15 years after 17 years’
production
• 270+ km drilling planned for FY2024 ²
²
• New XRT Ore Sorting System and ¹
paste backfill plant
• Acquired Kuanping Project, 33 km
north
¹ 77.5% owned by Silvercorp
• Building new 3,000 tpd mill and TSF ² 80% owned by Silvercorp
• Ying Mining District Video
25EXTENSIVE EXPLORATION FOR ORGANIC GROWTH
TSX: SVM | NYSE AMERICAN SVM
Development System & 3D Models at Ying One of Eight Core Logging Warehouses
Tunnels and Drill Holes Seven Core Storage Facilities 26EXTENSIVE EXPLORATION FOR ORGANIC GROWTH
TSX: SVM | NYSE AMERICAN SVM
Making new discoveries - Finding Gold Deposits in Silver Mines
Drilling at HPG Mine discovered a new “Rhyolitic Breccia Dyke” type of broad Au-Ag zone:
Breccia dyke (extends along a 2 km NW trend, up to 200 m thick and over 1 km depth) is
perpendicular to normally mined NE Ag-Pb-Zn veins; was missed by previous drilling.
Hole ZK1315 intercepted 18.4 m @ 1.42 g/t Au, 122 g/t Ag, 0.97% Pb, 0.56% Zn
Hole ZK1511 intercepted 31.8 m @ 1.14 g/t Au, 52 g/t Ag, 0.3% Pb, and 0.25% Zn.
Cross-cut tunnel PD2-570-15WCM cut 20.7 m @ 1.06 g/t Au, 122 g/t Ag, 1.33% Pb, and 1.48%
Zn
Drilling at HPG Mine discovered high grade Au veins
Hole ZK2542 intercepted 1.64 m true width of vein H16 @ 24.66 g/t Au
Hole ZK2342 intercepted 2.09 m interval of vein H16 @ 8.93 g/t Au
Hole ZK1218 intercepted 1.22 m true width of vein H17 @ 10.54 g/t Au
Hole ZK11206 intercepted 1.10 m true width of vein H41W @ 2.86 g/t Au, 1,469 g/t Ag,
3.69% Pb, 2.33% Zn
Hole ZK11604 intercepted 1.12 m true width of vein H40 @ 7.31 g/t Au, 100 g/t Ag, 1.78% Pb
Hole ZK2537 intercepted 1.58 m interval @ 17.1 g/t Au, 301 g/t Ag, and 18.66% Pb
27EXTENSIVE EXPLORATION FOR ORGANIC GROWTH
TSX: SVM | NYSE AMERICAN SVM
LMW Mine: Low Angle Au or Au-Cu Veins, Wide Ag-Pb-Cu Zone, New High-Grade
Ag-Pb-Zn Veins Discovered
Vein LM50:
Hole ZKX0796 intercepted 2.74 m true width @ 11.82 g/t Au
Hole ZKX0423 intercepted 1.62 m true width @ 10.53 g/t Au
Hole ZKX0723 intercepted 4.89m true width @ 5.23 g/t Au
Vein LM26:
Hole ZKX0787 intercepted 1.27 m true width @ 5.86 g/t Au
Hole ZKX0172 intercepted 1.01 m true width @ 2.81 g/t Au and 4.05% Cu;
Vein LM22:
Hole ZKX0535 intercepted 1.66m true width @ 37.08 g/t Au and 0.53% Cu
Hole ZKX05X098 intercepted 0.70 m true width @ 29.00 g/t Au and 1.20% Cu
Wide Ag-Pb mineralization defined at LM7 vein
Hole ZKX0575 intercepted 19.67 m true width @ 261 g/t Ag, 1.08% Pb, and 0.78% Cu
Hole ZKX0530 intercepted 23.96 m true width @ 202 g/t Ag, 1.26% Pb, and 0.37% Cu
Hole ZKX0751 intercepted 19.32 m true width @ 162 g/t Ag, 1.38% Pb and 1.00% Cu
Multiple High-Grade Ag-Pb-Zn Veins Discovered West of LMW Mining Areas
Hole ZKX0818 intercepted 2.82 m true width @ 2,238 g/t Ag and 5.90% Pb
Hole ZKX0634 intercepted 3.43 m true width @ 970 g/t Ag and 16.20% Pb
28
Hole ZKX0636 intercepted 0.91 m true width @ 2,511 g/t Ag, 3.45% Pb and 1.01% ZnREALIZED METAL PRICE EXAMPLES
TSX: SVM | NYSE AMERICAN SVM
Silver Lead Zinc
US$ Per Ounce US$ Per Pound US$ Per Pound
* Net of value added tax
Shanghai Metal Exchange quoted prices on February 14, 2023: Silver=4.910 RMB/gram, lead=15,125 RMB/tonne,
Zinc=23,110 RMB/tonne, all including 13% VAT. Conversion to net realized selling prices as follows:
Silver in US$ =4.910/1.13*31.1035/6.827*92.5%=$18.31
Lead in US$=(15,125-400 smelter deduction)/1.13/2204.62/6.827=$0.87
Zinc in US$=(23,110—6,000 smelter deduction)/1.13/2204.62/6.827=$1.01
29GC MINE
TSX: SVM | NYSE AMERICAN SVM
Updated MRE NI 43-101 March 2021:
• P&P Reserves up 8% from the last
Resource Estimate Report, despite
2 years mine production depletion
• Measured and indicated resources
up 11% and inferred resource up
17%
• Projected LOM has the potential to
go beyond 2034
GC Underground Mine operates:
• 330,000 tonne ore per year to
produce silver-lead, zinc, and minor
tin concentrates since 2014
• XRT Ore Sorting System nearing
completion
• Tailings are de-watered, then back-
filled underground and dry-stacked
30BYP GOLD MINE
TSX: SVM | NYSE AMERICAN SVM
Preparing for production:
• Lead-Zinc mine suspended August 2014
• 2019 NI 43-101 gold resource identified
421,000 oz M&I and 110,000 oz inferred
• Applied for a new gold mining permit
500 tpd Mill at the BYP Mine
31LEAD & ZINC PRODUCTION
> 1 Billion Pounds of Lead and Zinc Over 15 Years TSX: SVM | NYSE AMERICAN SVM
Fiscal Year
Silvercorp’s fiscal year is April 1-March 31
* Consolidated Fiscal 2023 lead & zinc production based on nine-month output (Apr. 1 to Dec. 31, 2022) plus expected Fiscal Q4 production
** Fiscal 2024E reflects the mid point of guidance
32GROWING RESERVES & RESOURCES - LEAD & ZINC
CY2005 – CY20211 (After > 1 Blbs Lead & Zinc Produced) 2 TSX: SVM | NYSE AMERICAN SVM
Calendar Year
1. Measured & Indicated Resources inclusive of Reserves. See Appendix III, IV and V for breakout of Measured, Indicated and Inferred, Proven and Probable
categories.
2. Includes production since the last technical reports for Ying and GC, respectively; BYP: approx. lbs produced prior to March 31, 2015 33MANAGEMENT FOCUS ON GENERATING
FREE CASH FLOW TSX: SVM | NYSE AMERICAN SVM
Profit (Green Line Below) on every tonne of ore mined
Silver Price (US$ per ounce)
Per Tonne Value (US$)
Calendar Period
• Realized silver price is calculated using the Shanghai Metal Exchange price, less smelter deduction and Value Added Tax 34CHINA INVESTMENT CONSIDERATIONS
TSX: SVM | NYSE AMERICAN SVM
1) Silvercorp operations are held through Chinese entities
• Significant employers, taxpayers and contributors to the local economies
• We supply necessary raw materials for manufacturing exporters
2) Many companies depend on China for manufacturing
• Nike – 36% of shoe manufacturing in China (Ohio State University study)
• Wal-Mart – majority of goods sourced from China
• BASF US$15B petrochemical complex in Southern China
• Exxon Mobil US$10B complex in Southern China
• Tesla Shanghai plant accounted for half its deliveries in 2021
• Apple produces >90% of its products, including 98% of iPhones in China
3) China is a significant market for western companies (revenue %)
• Apple (20%), Wynn Resorts (76%), Las Vegas Sands (62%), Tesla (25%), MGM
Resorts (23%), Skechers USA (20%), Nvidia (45%), AMD (39%), Texas Instruments
(25%), Intel (24%) (Morgan Stanley 2022)
• BHP (~52%), Rio Tinto (~44%), Teck (34%), Antofagasta (~32%), Anglo American
(~22%)
• GM – ~41% of its total cars sold in China
35SUMMARY OF RESERVES1,2
TSX: SVM | NYSE AMERICAN SVM
Average Grades Contained Metal Reserves
Reserve Tonnes
Project Silver Gold Lead Zinc Silver Gold AgEq3 Lead Zinc
Category (Million)
(g/t) (g/t) (%) (%) (Moz) (Koz) (Moz) (Kt) (Kt)
Proven 5.78 255 0.18 3.75 1.22 47 34 50 217 70
Ying Mining
Probable 6.54 230 0.34 3.02 0.87 48 71 53 198 57
District
Proven +
12.32 242 0.26 3.36 1.03 96 105 102 414 128
Probable
Proven 2.59 93 - 1.50 3.30 8 - 8 38 86
GC Mine Probable 1.54 95 - 1.50 3.00 5 - 5 23 47
Proven +
4.13 94 - 1.50 3.19 12 - 12 61 132
Probable
Proven 8.37 205 0.18 3.05 1.86 55 34 57 255 156
Consolidated4 Probable 8.08 204 0.34 2.73 1.28 53 71 58 221 104
Total 16.45 205 0.26 2.89 1.57 108 105 115 475 260
1. Mineral Reserves Estimate for Ying Mining District effective December 31, 2021; Mineral Reserves Estimate for GC Mine effective December 31, 2020.
2. Totals may not add up due to rounding.
3. Silver equivalent (AgEq) includes gold converted to AgEq at a rate of 65:1.
4. Consolidated average grades reflect those assets that produce the metal.
36SUMMARY OF RESOURCES1,2
TSX: SVM | NYSE AMERICAN SVM
Contained Metal Resources
Average Grades
Resource Tonnes (Inclusive of Reserves)
Project
Category (Million) Silver Gold Lead Zinc Silver Gold AgEq3 Lead Zinc
(g/t) (g/t) (%) (%) (Moz) (Koz) (Moz) (Kt) (Kt)
Measured 8.78 262 0.21 3.98 1.25 74 60 78 349 109
Indicated 9.95 225 0.32 3.09 0.84 72 101 79 307 84
Ying Mining
District Measured +
18.73 242 0.27 3.51 1.03 146 161 156 657 193
Indicated
Inferred 13.05 201 0.41 3.15 0.77 84 172 96 412 101
Measured 5.29 88 - 1.30 3.10 15 - 15 70 163
Indicated 4.75 75 - 1.10 2.50 11 - 11 50 117
GC Mine Measured +
10.03 82 - 1.20 2.80 26 - 26 120 281
Indicated
Inferred 8.44 87 - 1.00 2.40 24 - 24 88 200
Measured 2.80 - 3.00 - - - 269 17 - -
Indicated 5.62 - 0.84 0.53 1.62 - 152 10 30 91
BYP Mine Measured +
8.42 - 1.56 0.36 1.08 - 421 27 30 91
Indicated
Inferred 7.43 - 0.46 1.13 2.53 - 110 7 84 188
Measured 16.87 197 0.88 2.97 1.95 89 329 110 419 273
Indicated 20.32 177 0.51 1.92 1.44 84 253 100 388 292
4
Consolidated Measured +
37.18 186 0.67 2.35 1.65 172 582 210 807 565
Indicated
Inferred 28.92 156 0.43 2.00 1.70 108 282 126 584 489
1. Mineral Resources Estimate for Ying Mining District effective December 31, 2021; Mineral Resources Estimate for GC Mine effective December 31, 2020; Mineral Resources
Estimate for BYP Mine as of November 30th, 2018.
2. Totals may not add up due to rounding.
3. Silver equivalent (AgEq) includes gold converted to AgEq at a rate of 65:1. 37
4. Consolidated average grades reflect those assets that produce the metal.ENDNOTES
TSX: SVM | NYSE AMERICAN SVM
• Qualified Persons
• Guoliang Ma, P. Geo., is a Qualified Person within the meaning of National Instrument 43-101 – Standards Of Disclosure for Mineral Projects (“NI
43-101”) who supervised the preparation of the scientific and technical information of Silvercorp included in this presentation.
• For more information on Silvercorp’s projects, readers should refer to Silvercorp’s Annual Information Form dated June 23, 2020, and Silvercorp’s
technical reports, each of which is available on SEDAR at www.sedar.com.
• The scientific and technical information related to Silvercorp’s projects included in this investor presentation are derived from the technical reports
entitled:
• Mineral Resources and Reserves Update on the Ying Ag-Au-Pb-Zn Property in Henan Province, China effective December 31, 2021.
• NI 43-101 Technical Report Update on the Gaocheng Ag-Zn-Pb Project in Guangdong Province, People’s Republic of China” with an effective date of
March 31, 2021 (Mineral Resources and Mineral Reserves effective December 31, 2020), prepared by AMC Mining Consultants (Canada) Ltd.
(“AMC”)
• NI 43-101 Technical Report Update on the Ying Ag-Pb-Zn Property in Henan Province, China effective date 31 July, 2020 by H.A. Smith, P.Eng., A.A.
Ross. P.Geo., P.Geol., S. Robinson, P.Geo., R. Webster, MAIG, R. Chesher, FAusIMM(CP), A. Riles, MAIG
• NI 43-101 Technical Report for Ying Gold-Silver-Lead-Zinc Property, Henan Province, China, effective date 31 December, 2016 by P R Stephenson,
P. Geo., H A Smith, P.Eng., A Ross, P. Geo, H Muller, Beng, MAusIMM, CP.
• NI 43-101 Technical Report on the GC Ag-Zn-Pb Project in Guangdong Province, People’s Republic of China, effective date 30 June 2019 prepared
by D. Nussipakynova, P.Geo., H. Smith, P.Eng., A. Riles, MAIG (QP), P. Stephenson, P.Geo., MAIG.
• NI 43-101 Technical Report for BYP Gold-Lead-Zinc Property, Hunan Province, China, effective date 30 April, 2019, prepared by Tony Cameron,
Principle Mining Engineer, Robert William Dennis, Executive Consultant, and Song Huang, Consulting Geologist.
• Non-IFRS Measures
• This presentation includes certain terms or performance measures commonly used in the mining industry that are not defined under International
Financial Reporting Standards (“IFRS”), including “all-in sustaining costs”. Non-IFRS measures do not have any standardized meaning prescribed
under IFRS, and therefore they may not be comparable to similar measures employed by other companies. The data presented is intended to
provide additional information and should not be considered in isolation or as a substitute for measures of performance prepared in accordance
with IFRS and should be read in conjunction with the Company’s consolidated financial statements. Readers should refer to the Company’s most
recently filed Management Discussion & Analysis, available under the Company’s corporate profile at www.sedar.com and at www.sec.gov for a
more detailed discussion of how the Company calculates such measures and a reconciliation of certain measures to IFRS terms. 38You can also read