BMO 31st Global Metals & Mining Conference - February 27th - March 3rd, 2022 - Lundin Group of Companies
←
→
Page content transcription
If your browser does not render page correctly, please read the page content below
BMO 31st Global Metals & Mining Conference
February 27th - March 3rd, 2022
Caution Regarding Forward-Looking Information and Statements
All statements, other than statements of historical fact, made and information contained in this     June 15, 2016 with an effective date of April 30, 2016. Information of a scientific and
presentation and responses to questions constitute “forward-looking information” or “forward-        technical nature in this presentation was reviewed and approved by Ron Hochstein, P.Eng.,
looking statements” as those terms are defined under Canadian securities laws (“forward-             Lundin Gold’s President and Chief Executive Officer, who is a Qualified Persons within the
looking statements”). Forward-looking statements may be identified by terminology such               meaning of National Instrument 43-101 - Standards of Disclosure for Mineral Projects (“NI
“believes”, “anticipates”, “expects”, “is expected”, “scheduled”, “estimates”, “pending”,            43-101”). The disclosure of exploration information contained in this press release was
“intends”, “plans”, “forecasts”, “targets”, or “hopes”, or variations of such words and phrases or   prepared by Stephen Leary, MAusIMM CP(Geo), a consultant to the Company, who is a
statements that certain actions, events or results “may”, “could”, “would”, “will”, “should”         Qualified Person in accordance with the requirements of NI 43-101.
“might”, “will be taken”, or “occur” and similar expressions).
                                                                                                     Unless otherwise indicated, all dollar values herein are in US dollars.
By their nature, forward-looking statements involve assumptions, inherent risks and
uncertainties, many of which are difficult to predict, and are usually beyond the control of         Important Information for US Investors
management, that could cause actual results to be materially different from those expressed          This presentation may use the terms “measured", “indicated“, “inferred" and “historical”
by these forward-looking. Lundin Gold believes that the expectations reflected in these              mineral resources. U.S. investors are advised that, while such terms are recognized and
forward-looking statements are reasonable as of the date made, but no assurance can be               required by Canadian regulations, the Securities and Exchange Commission does not
given that these expectations will prove to be correct. In particular, this presentation             recognize them. “Inferred mineral resources" and “historical estimates” have a great
contains forward-looking statements pertaining to: estimates of gold production, grades,             amount of uncertainty as to their existence and great uncertainty as to their economic
recoveries and costs, expected sales receipts, cash flow forecasts, the expected timing and          feasibility. It cannot be assumed that all or any part of an inferred mineral resource or a
impact of completion of capital projects including the south ventilation raise, the timing and       historical estimate will ever be upgraded to a higher category. Under Canadian rules,
the success of its drill program at Fruta del Norte and its other exploration activities,            estimates of inferred mineral resources may not form the basis of feasibility or other
estimates of Mineral Reserves and Resources and future growth opportunities.                         economic studies. Further, historical estimates are not recognized under Canada’s NI 43-
                                                                                                     101. U.S. investors are cautioned not to assume that all or any part of measured or indicated
There can be no assurance that such statements will prove to be accurate, as Lundin                  mineral resources will ever be converted to mineral reserves.
Gold's actual results and future events could differ materially from those anticipated in this
forward-looking information as a result of the factors discussed in the "Risk Factors" section       This presentation is not an offer of securities for sale in the United States or in any other
in Lundin Gold’s Management Discussion & Analysis dated February 23, 2022, which is                  jurisdiction. The Company’s securities have not been and will not be registered under the
available at www.lundingold.com or on SEDAR. Forward-looking information should not be               United States Securities Act of 1933, as amended, and may not be offered or sold within the
unduly relied upon.                                                                                  United States absent registration or an application exemption from registration.

Except as noted, the technical information contained in this presentation relating to the
Fruta Del Norte Project is based on a Technical Report prepared for the Company entitled
“Fruta del Norte Project, Ecuador, NI 43-101 Technical Report on Feasibility Study” dated

                                                                                                                                                                                      2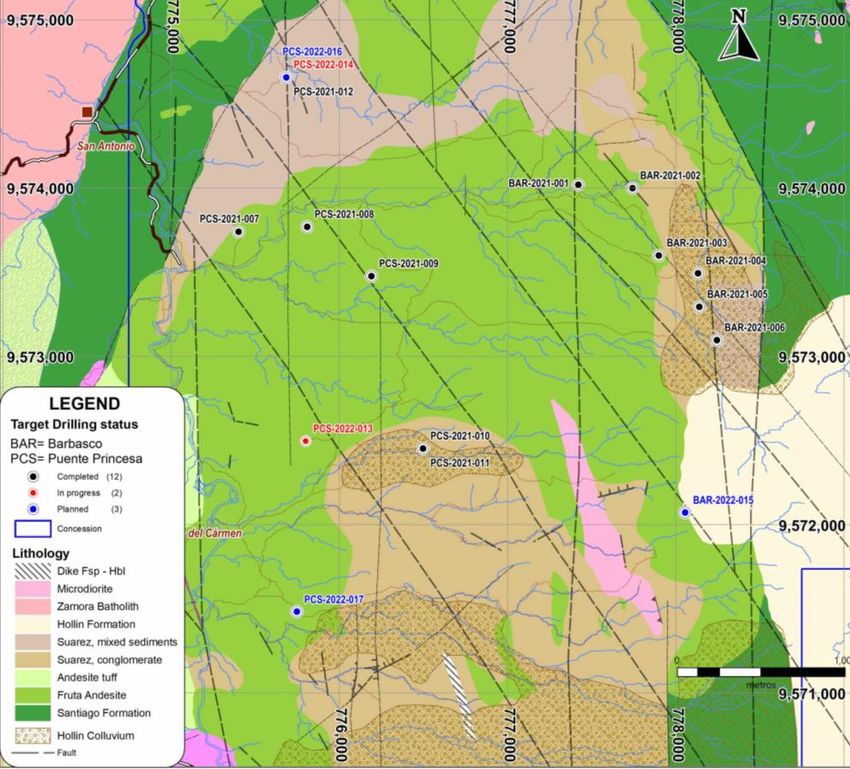
Strongly Positioned to Create Shareholder Value
       Operational
                                             Cash Flow                        Growth                             ESG
       Excellence

                                                                                                  Focused on implementing a market
                                     Significant cash flow generation in                                leading ESG strategy
  Beat 2021 production guidance
                                                    2021                   Regional exploration
                                                                                                  Multiple pillars of the strategy focus
Focus on continued optimization of                                                                 upon aspects of local community
                                     Peer leading free cash flow yield     Resource expansion
           operations                                                                                         development
                                          Clean up balance sheet           M&A opportunities
   Studies to evaluate further                                                                      Adopting TCFD recommendations
            expansion                                                                             and incorporating climate-related risk
                                         Consider dividend policy
                                                                                                            into disclosures

                                                                                                                             3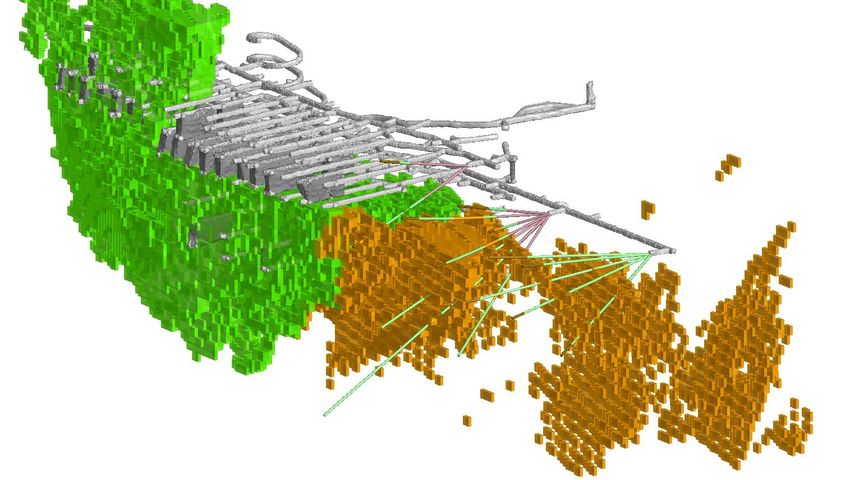
2021 Was a Successful Year for Lundin Gold
                                         Beat 2021 gold production guidance

                           Throughput expanded from 3,500 tpd to 4,200 tpd, on time and on
                                                      budget

                                           Improved recovery every quarter

                                       Advanced regional exploration programs

                                           No COVID-19 related stoppages

                            Completion of Estamos Conectados internet connectivity project

                                         Zamora River Bridge fully operational

                                         Achievement of Project Completion

                                                                                      4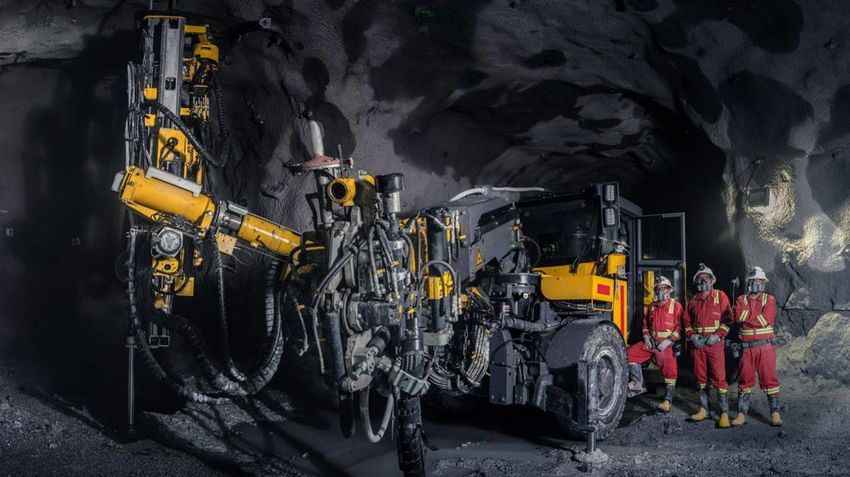
2021 Production Guidance Beaten
 Three Months ended December 31, 2021                   Full Year 2021

           107,915 oz                               428,514 oz
               Gold produced                            Gold produced

  75,299 oz               32,616 oz        289,499 oz              139,015 oz
 Gold as concentrate       Gold as doré   Gold as concentrate        Gold as doré

              379,166                                1,415,634
               Tonnes milled                            Tonnes milled

               9.9 g/t                                 10.6 g/t
           Average Head Grade                        Average Head Grade

                89.7%                                    88.6%
             Average recovery                          Average recovery

            4,121 tpd                                 3,878 tpd
         Average Mill Throughput                  Average Mill Throughput

                                                                                    5
Lundin Gold in the Lower Quartile of the Global Gold AISC Curve1
                                  2000
                                                                                                                    Gold Price ~$1,909/oz2
                                  1800

                                  1600
                                                                                                                                                                                                          FY 2021 AISC3
                                  1400                                                                                                                                                 Cash operating costs                     $632
All-In Sustaining Cost (US$/oz)

                                  1200                                                                                                                                                 Corporate social responsibility           $3

                                  1000                                                                                                                                                 Treatment and refining charges           $81

                                   800
                                                                                                                                                                                       Accretion of restoration prevision       $0.2

                                                                                                                                                                                       Sustaining capital                       $71
                                   600
                                                                                                                                                                                       Silver by product credit                 ($25)
                                   400
                                                                                                                                                                                       AISC per oz sold                         $762
                                   200

                                     0
                                         0   10          20            30           40            50           60            70           80            90           100
                                                                                Percentage (%) of Global Production

                                             1.   SNL Metals and Mining, public company filings   2. Spot gold as at February 23, 2022
                                             2.   3. Please refer to page 14 in the Company's MD&A for the year ended December 31, 2021 for an explanation of non-IFRS measures used                                        6
2022 Guidance an Indication of Things to Come

  2022 Gold Production                                                   Cash Operating Costs1                                                        AISC1

 405,000 – 445,000                                                                  $710 – 780                                                   $860 – 930
            oz gold                                                              per oz gold sold2                                              per oz gold sold2

  Average Head Grade                                                 Average Mill Throughput                                                  Average Gold Recovery

     9.79 g/t gold                                                                      4,200 tpd                                                    89%

       1.   Please refer to page 14 in the Company's MD&A for the year ended December 31, 2021 for an explanation of non-IFRS measures used
       2.   Based on an assumed gold price of $1,750/oz and silver price of $22.50/oz                                                                           7
Three-Year Outlook Underscores Free Cash Flow1 Potential

                    2022                                                                                2023                                                          2024

     405,000 - 450,000                                                               390,000 - 430,000                                                    400,000 - 440,000
             Gold Production (oz)                                                                 Gold Production (oz)                                            Gold Production (oz)

             40 - 45                                                                              30 - 35                                                          7 - 12
     Sustaining Capital ($ million)                                                  Sustaining Capital ($ million)                                       Sustaining Capital ($ million)

        710 - 780                                                                         700 - 775                                                          675 - 745
 Cash Operating Cost ($/oz sold)1,2                                          Cash Operating Cost ($/oz sold)1,2                                       Cash Operating Cost ($/oz sold)1,2

      860 - 930                                                                       850 - 915                                                           750 - 810
      AISC ($/oz sold)1,2                                                             AISC ($/oz sold)1,2                                                 AISC ($/oz sold)1,2

             1.   Please refer to page 14 in the Company's MD&A for the year ended December 31, 2021 for an explanation of non-IFRS measures used
             2.   Gold/silver price per oz assumption, based on analyst estimates, is 2022: $1,750/$22.50; 2023: $1,715/$23.81; 2024: $1,642/$22.43                                        8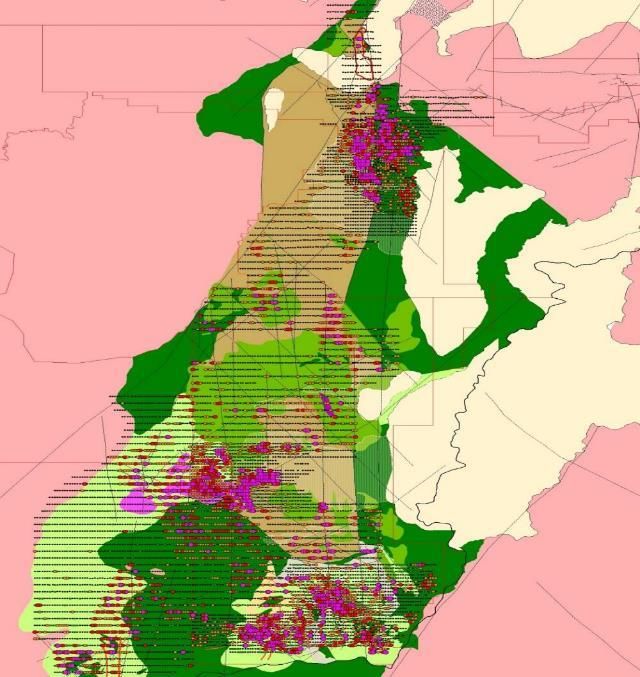
Lundin Gold Continues to Generate Strong Cash Flow
 In 2021, Lundin Gold generated $417.8 million in operating cash flow and ended the year with a cash balance of $262.6 million
                                            compared to $79.6 million a year prior.

                                                                             18.9                               (190.0)
                                         417.8

                                                                                                                                                (63.1)

                                                                                                                                                                          262.6

            79.6

   Cash as at Dec. 31, 2020   Cash generated from operating   Proceeds from stock option exercises Principal and interest payments made   Capital expenditures   Cash as at Dec. 31, 2021
                                        activities             and exercise of anti-dilution rights       under the loan facilities

 As at December 31, 2021, Lundin Gold had a working capital balance of $224.3 million compared to $56.6 million at December
                                                         31, 2020

                                                                                                                                                                                  9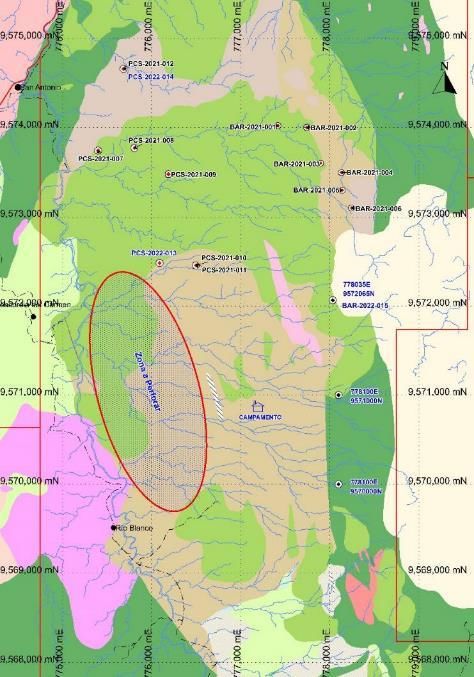
Free Cash Flow Gives Lundin Gold Flexibility

                                            Debt
                                         Repayment

       Based on guidance and current
                                                     Organic
        gold prices, Lundin Gold will
                                                     Growth/
        generate significant free cash
                                                      M&A
        flow for many years to come

                                         Dividends

                                                        10
Ongoing Construction Projects – South Ventilation Raise
Raise boring and shotcreting of the 2.1 m raise was
completed early Q4
Contractor has mobilized and set-up is complete
Anticipated SVR Completion
Near End of Q2 2022
11Encouraging 2021 Regional Exploration Drill Results
12 diamond drill holes totalling
11,136 m were completed at
Barbasco and Puente Princesa in
2021
2021 exploration results have
provided direction for 2022
program
12Exploration Drilling in 2022 Now Underway
Aim to find buried "Fruta del Norte" type epithermal gold-silver
systems in the southern Basin
Barbasco
Drilling will test the eastern edge of the southern Suarez basin (black circle), a 3km long
area completely covered by sedimentary and colluvial rocks
Puente-Princesa
Drilling underway with two rigs turning, and will continue to the south (red circle), along
the western Basin margin
16,500 metres regional exploration drilling are planned for 2022 at a cost
of $14 million
13ESG Considered in Every Aspect of Our Activities
Climate Change Adopting TCFD recommendations and incorporating climate-related risk into disclosures
Community
LUG invested $4.7m in local community infrastructure in 2021
Infrastructure
Community Programs to address education, healthy lifestyles, health infrastructure and youth development in
Well-being and around Los Encuentros were ongoing in 2021
Environmental LUG continues to meet its Environmental Stewardship goals by implementing industry best practices
Stewardship for water, waste and tailings management, and emissions reductions while protecting biodiversity
Sustainability
Pillars Total Recordable Incident Rate for 2021 was 0.46 and by year end we had reached 4.0 million hours
Health & Safety
worked without a lost time incident
15% female representation in the workforce / 30% female director representation / Strong
Human Rights
engagement with local Indigenous peoples
1,690 direct jobs at year end (Zamora Chinchipe: 50%) / $31M spent on local procurement in Zamora
Lasting Economic
Chinchipe in 2021 ($193M in Ecuador) / $20M invested in domestic economy strengthening projects
Opportunities
between 2015 and 2020
Responsible Resource Work with many stakeholders to improve resource governance in Ecuador. Active within the EITI* and
Governance report according to the ESTMA**. Have a leadership position within the Chamber of Mines.
* EITI: Extractive Industries Transparency Initiative
** ESTMA: Extractive Sector Transparency Measures Act
14Mining Playing an Important Part in
Ecuadorian Economic Growth
Mineral Resources now represent one of Ecuador’s top four exports
$2.1 billion1 Mining has represented more than
Mining exports in 2021
40%1
+99% vs. 2020 of Foreign Direct Investment between
2016 and 2020
Lundin Gold will contribute to Ecuador’s economy for years to come
$1.3 -1.5 $626 million $8 – 8.8
billion2 Lundin Gold domestic billion2
purchases (2017 – 2020)
LOM royalties and taxes Lundin Gold estimated
expected to be paid exports over LOM
Local economic and social impact
66%3 23%3 $1.1 billion2
Average annual increase in tax Average annual increase in Estimated total impact of FDN
collection in Yantzaza vs. 5% sales in Yantzaza vs. 2% direct purchases in Zamora
national average (2015-2019) national average (2015-2019) Chinchipe over LOM
Employment4
In 2020, Yantzaza was among the 3 cantons with the highest average salaries
1. Source: BCE 3. Source: SRI
2. Source: Lundin Gold Economic Impact Study 4. Source: INEC 15Corporate Structure (Data as at February 23, 2022)
CAPITAL MARKETS DATA ANALYST COVERAGE SHAREHOLDERS
BMO Capital Markets Outperform, $14.00
Symbol TSX: LUG / OMX: LUG
CIBC World Markets Outperform, $14.00
Share price (CAD/sh) 9.96 13%
Cormark Securities Buy, $13.00
Strategic
Desjardins Securities Buy, $12.75
52 Week Trading Range 8.82/12.93 Management
Haywood Securities Buy, $14.50
23%
Shares Outstanding 233.4 M Institutional
National Bank of
Perform, $11.75 58%
Canada Retail
Market Capitalization C$2,326 M Scotiabank Perform, $13.00 5%
Stifel GMP Buy, $15.50
Cash Position (Dec 31, 2021) US$263 M
SpareBank 1 Markets Buy, SEK 100 / CAD $15.00
LT Debt (Dec 31, 2021) US$740 M TD Securities Buy, $13.50
16Lundin Gold – Value Creation Opportunities
Operational
Cash Flow Growth ESG
Excellence
2022 FDN Catalysts
Completion of the SVR
Evaluate further throughput expansion
Climate change report
Regional exploration drilling results
17Contact information:
Finlay Heppenstall - Director, Investor Relations
finlay.heppenstall@lundingold.com
+1 604-806-3089
Thank you!
TSX: LUG / OMX: LUG
@LundinGold / LundinGoldEC Lundin Gold Lundin Gold Lundin Gold Ecuador www.lundingold.comAppendix
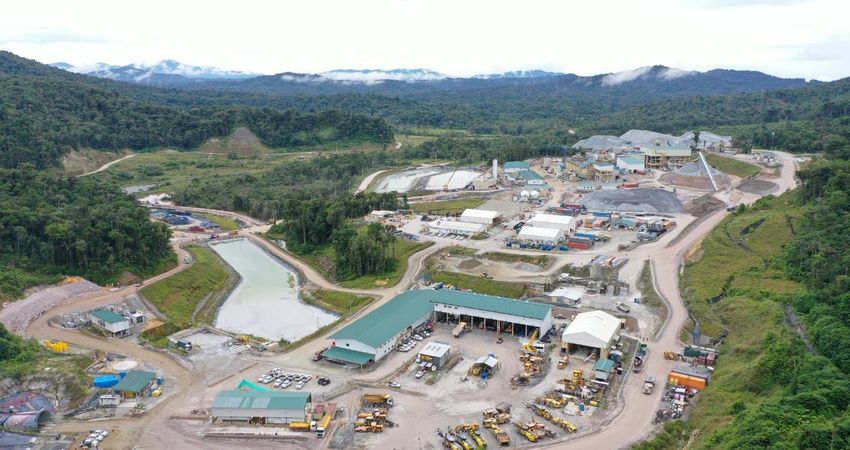
Fruta del Norte: The first large-
scale gold mine in Ecuador

                                     Location:
   Zamora Chinchipe Province, Southeast Ecuador
          Ownership:                                      Stage:
           100%                                     Producing
          Mine Type:                                   Life of Mine:
       Underground                                  ~13 years
                               Probable Reserves:
       5.24 million oz of gold grading 8.0 g/t1

                        LOM Average Gold Production:
                     340,000 oz per year

          1.   As at December 31, 2020                                 20
Non-Executive Board of Directors, Management and Operations Team
Lukas Lundin* Carmel Daniele Gillian Davidson Ian Gibbs Chantal Gosselin Ashley Heppenstall Craig Jones Paul McRae* Bob Thiele
Chairman Director Director Director Director Director Director Director Director
Ron F. Hochstein Alessandro Bitelli Sheila Colman Nathan Monash David Dicaire Iliana Rodriguez Chester See
President, CEO & EVP, CFO VP, Legal and VP, Business VP, Projects VP, Human VP, Finance
Director Corporate Secretary Sustainability Resources
Guy Bédard Doug Moore Javier Santillan Juan Carlos Contreras Murray Wright
General Manager Operations Director Mine Manager Mill Manager Supply Chain Manager
* Will be stepping down from the Board upon completion of their term at the Company’s upcoming 2022 annual meeting of shareholders 21Fourth Quarter and 2021 Financial Highlights
Three Months ended Year ended
December 31 December 31
(Tables are expressed in $’000, except share and per share amounts, or unless otherwise stated) 2021 2020 2021 2020
Net revenues 186,440 189,250 733,329 358,1561
Income from mining operations 91,646 94,857 355,712 172,3861
Earnings before interest, taxes, depreciation, and amortization (“EBITDA”)2 63,113 26,327 415,588 39,979
Adjusted earnings before interest, taxes, depreciation, and amortization 2 108,819 117,000 436,006 206,267
Net income 28,789 (1,233) 221,426 (47,158)
Free cash flow2 74,681 43,252 268,370 (8,294)
Average realized gold price ($/oz sold)2 1,779 1,850 1,772 1,8661
Cash operating cost ($/oz sold)2 625 627 632 6671
All-in sustaining costs ($/oz sold)2 715 747 762 7731
Free cash flow per share2 0.32 0.19 1.16 (0.04)
Adjusted net earnings2 77,902 76,224 248,907 105,914
Adjusted net earnings per share2 0.33 0.33 1.07 0.47
1. Amount relates to the period after achievement of commercial production.
2. Please refer to page 14 in the Company's MD&A for the year ended December 31, 2021 for an explanation of non-IFRS measures used. 22Free Cash Flow1
(Tables are expressed in $’000, except share and per share Three Months ended Year ended
amounts, or unless otherwise stated)
December 31 December 31
2021 2020 2021 2020
Net cash provided by operating activities 108,006 95,019 417,752 113,644
Net cash used for investing activities (8,786) (32,491) (63,109) (79,644)
Interest paid (23,477) (19,276) (85,211) (42,294)
Finance charge paid (1,062) - (1,062) -
Free cash flow1 74,681 43,252 268,370 (8,294)
Basic weighted average shares outstanding 233,211,843 230,039,327 232,179,557 227,500,029
Free cash flow per share1 0.32 0.19 1.16 (0.04)
1. Please refer to page 14 in the Company's MD&A for the year ended December 31, 2021 for an explanation of non-IFRS measures used 23Probable Mineral Reserves of 5.24 Moz of
Gold at 8.03 g/t1
Processed in
December 31, December 31,
2020 Reserve2 Remainder of
2019 20204
20203
Mt 17.6 20.8 0.6 20.3
Au (g/t) 8.74 8.1 9.84 8.03
Au (Moz) 4.99 5.41 0.18 5.24
Ag (g/t) 12.1 11.8 12.04 11.45
Ag (Moz) 6.92 7.68 0.22 7.46
Result of converting a portion of Drift and Fill mineable orebody sections to
Long Hole Stoping, due to good ground conditions experienced in the mine
These changes have also resulted in a slight increase to dilution and decrease
in average grade
Mineral Resources estimates at Fruta del Norte were not affected
1. See slide 33 for information regarding the assumptions, parameters and risks associated 3. Corresponds to mill feed from August 1, 2020 to December 31, 2020
with the FY2020 reconciliation, along with other disclosure in accordance with NI-43-101 4. See the Company’s Annual Information Form dated March 2, 2021, available under the 24
2. As at July 31, 2020 Company’s profile at www.sedar.com.Fruta del Norte one of the few Multi-Million Ounce, High-Grade Gold
Assets in Production1
Producers with gold reserves > 4 million ounces
1. Source: S&P Global Market Intelligence Metals and Mining, company reports, Lundin Gold Annual Information Form dated March 2, 2021 2531 km of Underground Mine Development Completed1
2,223 meters developed during the fourth quarter. Rates averaged 24.2 m per day.
1. As at December 31, 2021 26Process Plant Flowsheet
27Fruta del Norte
FDN SW FDN East Regional Exploration Potential
Objective is to discover another Fruta del Norte type
Suarez Pull Alejandro gold-silver epithermal deposit
Apart Basin –
38 km2
La Negra Norte Key exploration ground is the 38 km2 Suarez Pull-Apart Basin
La Negra
Puente-Princesa
Barbasco
The Basin remains essentially untested and geological
conditions are similar to those at Fruta del Norte
Gata Salvaje Guayacan
2021 regional exploration drill program consisted of 11,000m
Lora
drilled at Barbaso and Puente-Princesa
El Puma
Emperador
Many more additional targets yet to be evaluated
28Fruta del Norte Resource Expansion Drilling Program Progressing
10,000 m underground drill program focused on opportunities within existing current reserve and expansion of
inferred resources
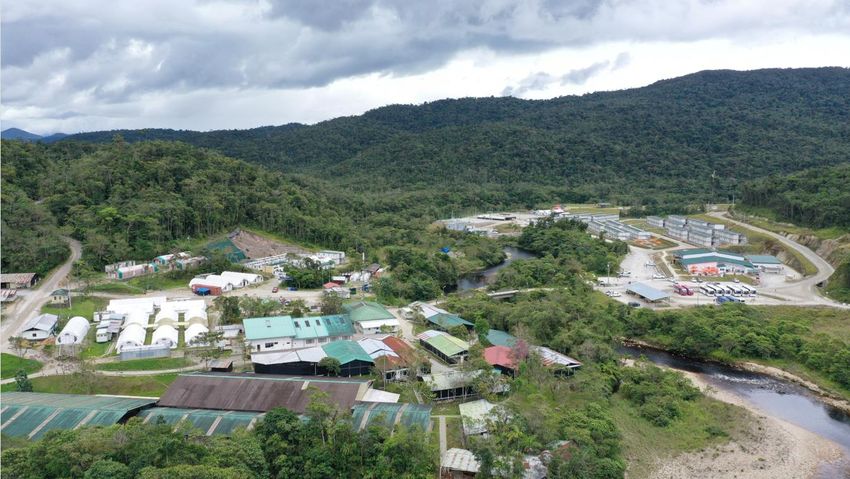
29Estamos Conectados Connectivity Project Completed in October 2021
1,370 tablets distributed to students in
the Los Encuentros parish as well as Fibre optic infrastructure has been
Internet service has been improved for
several other rural communities close to installed to provide improved internet
local schools in the area
Fruta del Norte service to the local communities
Lundin Gold is appreciative of the numerous partners who have committed to
supporting this connectivity project through the Lundin Foundation, including:
30Newcrest Financing Package and Senior Debt Facility
Gold Pre-Pay and Stream Finance Package Senior Debt Facility
Gold Prepay Credit Facility of US$150 million, repayable in 19 fixed $350 million from lenders syndicate
quarterly principal and interest instalments equivalent to the value of
− 7 lenders and 1 export credit agency
9,775 oz gold (raising to 11,500 oz and 13,225 if the gold price is less
than $1,436 and less than $1,062, respectively) based on spot at time − Tranche A: US$250 million senior commercial facility.
of payment starting December 2020 and ending 2025.
− Tranche B: US$100 million senior covered facility under a raw material
− First payment made under the gold prepay in December 2020. guarantee provided export credit agency.
Stream Credit Agreement of US$150 million, repayable in variable − Term: eight and half years, maturing in June 2026.
monthly principal and interest instalments equivalent to the delivery of
− Annual interest: 3 or 6 month LIBOR plus an average margin of approx. 5.05%
7.75% gold production and 100% silver production, based on spot at (Tranche A) and 2.50% (tranche B) over the term.
time of payment less US$400/ounce Au and US$4.00/ounce Ag, up to a
maximum of 350,000 oz of gold and 6 million oz of silver. Fully drawn at end of 2019.
− Payments commenced upon achievement of Commercial Production in Repayable in variable quarterly instalments starting at the end of 2020 and
February 2020 maturing in June 2026.
− Option to buy back 50% of the stream in June 2024 and 50% in June 2026 First payment made in December 2020
Project completion achieved in December 2021
Offtake agreement for up to 2.5 million ounces refined gold
31Government Agreements
The Company has all the major agreements and permits with the Government of Ecuador in place
The Exploitation Agreement The Investment Protection Agreement
• The Exploitation Agreement sets out the rights and obligations of the • The Investment Protection Agreement primarily deals with tax and mining
Government of Ecuador and Aurelian as mining concessionaire with respect to regulatory stabilisation and other investment protection mechanisms. Key
the Project and incorporates: benefits include:
• Term: affords the mining concessionaire the right to develop and produce • Income tax rate fixed at 22%
gold from the Project for 25 years
• Exemption from the capital outflow tax of 5% on payments of principal and
• Fiscal Terms: describing royalties, windfall tax and sovereign adjustment interest to financial institutions outside of Ecuador
mechanisms
• The ability to obtain benefits granted by the Government of Ecuador through
• Security: acknowledges the financing requirements and provides the ability future investment protection agreements with other investors in similar
and authorisation to grant security projects in Ecuador
• Enforcement: provides acknowledgement that the Lenders are entitled to • No restrictions to transfer or assign all or part of the investment, including
foreclose without authorisation from the mining concessionaire or the the right to assign its rights to any financing parties
Government of Ecuador
• Other benefits granted to Aurelian include no restriction to:
• Dispute Resolution Procedures: arbitration under UNICTRAL rules (in • produce and sell minerals;
Santiago, Chile)
• import and export goods; and
• establish, maintain, control, or transfer funds abroad, provided statutory
remittances and obligations have been met
Both the Exploitation Agreement and the Investment Protection Agreement were signed in December 2016
32Mineral Resources
Notes:
NI 43-101 Mineral Resources - Mineral Resources, inclusive of 1. The Qualified Person for the estimate is Mr. David Ross, P.Geo., an employee of RPA. The estimate has
an effective date of 31 December, 2015.
Mineral Reserves as at December 15, 2015 2. Mineral Resources are reported inclusive of Mineral Reserves; Mineral Resources that are not Mineral
Reserves do not have demonstrated economic viability.
3. Mineral Resources are reported at a cut-off grade of 3.5 g/t Au; which was calculated using a long term
gold price of US$1,500/oz.
4. Mineral Resources are constrained within underground mineable shapes that assume a minimum
Tonnage Grade Contained Metal Grade Tonnage thickness of 2 m; metallurgical recovery of 94%; total operating costs of US$145/t milled (mining cost
Category of US$60/t milled; process costs of US$35/t milled; G&A costs of US$15/t milled; surface infrastructure
(M t) (g/t Au) (M oz Au) (g/t Ag) (M oz Ag) costs of US$28/t milled; concentrate transport and treatment costs of US$7/t milled); royalties of
US$71/oz and selling costs of US$65/oz.
Indicated 23.8 9.61 7.35 12.9 9.89 5. Numbers may not add due to rounding.
6. For information with respect to the key assumptions, parameters and risks associated with the results
of the Technical Report for the Project, the Mineral Resource and Mineral Reserve estimates included
Inferred 11.6 5.69 2.13 10.8 4.05 therein and other technical information, please refer to the Technical Report.
Notes to Probable Mineral Reserve Update
December 2020 December Unit
Key Input
1. The 2020 Reserve has been estimated in accordance with CIM Standards and NI 43-101. The 2020 Reserve is as at July 31, 31, 2019 Reserve 31, 2020
2020 and reflects mill feed from January 1, 2020 to July 31, 2020. Gold Price 1,250 1,400 1,400 $/oz
2. Additional information on Mineral Resource and Mineral Reserve estimates for Fruta del Norte is contained in the in the TS 48 47 47 $/t
Technical Report which is available under the Company's profile on SEDAR. Except as set out below, the assumptions, D&F 81 69 69 $/t
parameters and risks associated with the Company's Mineral Resource and Mineral Reserve estimates set out herein are as
Process, Surface Ops, G&A 58 57 57 $/t
set out in the Technical Report.
3. All Mineral Reserves presented are Probable Mineral Reserves. No Proven Mineral Reserves were estimated. Dilution Factor 10 8 8 Percent
4. Mineral Reserves were estimated using key inputs listed in the top right table. Concentrate Transport & Treatment 68 92 92 $/oz
5. Gold cut-off grades for the different mining methods are listed in the bottom right table. Royalty 71 77 77 $/oz
6. Silver was not considered in the calculation of the cut-off grade. Gold Metallurgical Recovery 91.7 91.7 91.7 Percent
7. Tonnages are rounded to the nearest 1,000 t, gold grades are rounded to two decimal places, and silver grades are rounded
to one decimal place. Tonnage and grade measurements are in metric units; contained gold and silver are reported as December 2020 December
Gold Cut-off Grade Unit
31, 2019 Reserve 31, 2020
thousands of troy ounces.
8. Rounding as required by reporting guidelines may result in summation differences. Transverse Stope 3.8 3.8 3.8 g/t
Drift and Fill 5.0 4.4 4.4 g/t
33@LundinGold / LundinGoldEC Lundin Gold Lundin Gold Lundin Gold Ecuador www.lundingold.com
You can also read