Progress towards preventing waste in Europe - the case of textile waste prevention - EEA Report No 15/2021
←
→
Page content transcription
If your browser does not render page correctly, please read the page content below
EEA Report   No 15/2021

Progress towards preventing waste
  in Europe — the case of textile
         waste prevention
EEA Report   No 15/2021

Progress towards preventing waste
  in Europe — the case of textile
         waste prevention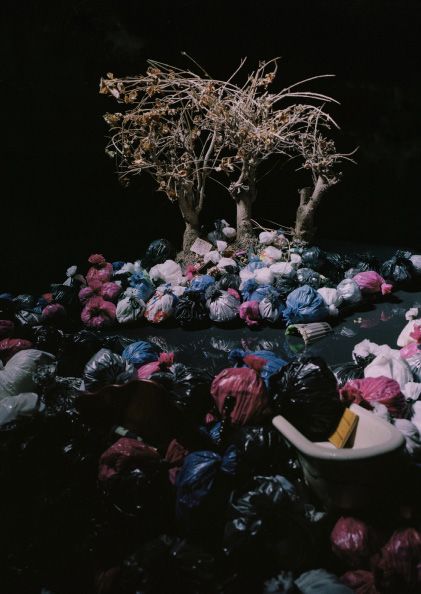
Cover design: EEA
Cover photo: ©Zoltán Balogh, WasteSMART, EEA
Layout: Formato Verde

Legal notice
The contents of this publication do not necessarily reflect the official opinions of the European Commission or other
institutions of the European Union. Neither the European Environment Agency nor any person or company acting on
behalf of the Agency is responsible for the use that may be made of the information contained in this report.

Brexit notice
EEA products, websites and services may refer to research carried out prior to the UK's withdrawal from the EU.
Research and data relating to the UK will generally be explained by using terminology such as: 'EU-27 and the UK' or
'EEA-32 and the UK'. Exceptions to this approach will be clarified in the context of their use.

Copyright notice
© European Environment Agency, 2021
Reproduction is authorised provided the source is acknowledged.

More information on the European Union is available on the Internet (http://europa.eu).

Luxembourg: Publications Office of the European Union, 2021

ISBN 978-92-9480-411-2
ISSN 1977-8449
doi:10.2800/494502

European Environment Agency
Kongens Nytorv 6
1050 Copenhagen K
Denmark

Tel.: +45 33 36 71 00
Internet: eea.europa.eu
Enquiries: eea.europa.eu/enquiries

Contents

Acknowledgements.....................................................................................................................................5

Key messages...............................................................................................................................................7

Executive summary.....................................................................................................................................9

1    Introduction.........................................................................................................................................11

2    Monitoring progress in waste prevention implementation...........................................................15
     2.1     Decoupling waste generation from economic growth..................................................................... 15
     2.2     Overview of national and regional waste prevention programmes............................................... 19
     2.3     Waste streams....................................................................................................................................... 21
     2.4     Indicators............................................................................................................................................... 22
     2.5     Targets.................................................................................................................................................... 24
     2.6     Waste prevention measures............................................................................................................... 26
     2.7     New waste prevention focus areas.................................................................................................... 28
     2.8     Conclusions........................................................................................................................................... 30

3    Preventing textile waste in Europe...................................................................................................33
     3.1     Introduction and scope........................................................................................................................ 33
     3.2     Production and consumption of textiles in Europe and related environmental impacts........... 33
     3.3     Textile waste generation in the EU..................................................................................................... 37
     3.4     Policy background on textile waste prevention................................................................................ 39
     3.5     Intervention points for textile waste prevention along the life cycle stages................................. 42
     3.6     Challenges and potentials for textile waste prevention in the EU.................................................. 46
     3.7     Conclusions and future prospects...................................................................................................... 48

Abbreviations.............................................................................................................................................52

References..................................................................................................................................................53

Annex 1 Overview of country waste prevention programmes..........................................................57

Annex 2 Good practice examples in European countries...................................................................60

                                                              Progress towards preventing waste in Europe — the case of textile waste prevention                              3
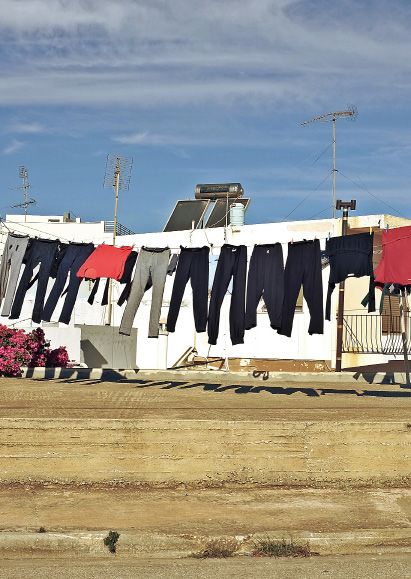
© Stelios Charalampakis, MyCity/EEA

Acknowledgements

This report was written by Burcu Gözet and Henning Wilts          Martin Adams (EEA), David Watson (PlanMiljø), Chiel Berends,
(Wuppertal Institute), Saskia Manshoven (VITO) and Ioannis        Caterina Savelli, Anne-Laure Gassin (European Commission) and
Bakas (EEA).                                                      various experts from the Eionet network.

The authors are grateful to the following for their valuable
comments, input and support: Almut Reichel, Daniel Montalvo,

                                                Progress towards preventing waste in Europe — the case of textile waste prevention   5
© Salvador Dewald, WasteSMART/EEA © EEA
Key messages
• The EU as a whole and many individual countries have achieved a relative decoupling of waste generation from
economic growth. However, there are no signs that the overall objective of reducing waste generation in a growing
economy is close to being achieved.
• Data for trends in waste generation show no observable link between the adoption of waste prevention
programmes by countries in 2013 and the amount of waste generated. In fact, waste generation, excluding major
mineral wastes, increased by 5.2 % between 2014 and 2018 in the EU.
• In mid-2021, 10 out of the 32 countries examined did not have a waste prevention programme in place, although all
EU Member States had one in place earlier. This might be the result of countries deciding to align waste prevention
policies with waste management plans or circular economy strategies, which can unlock synergetic effects.
• The introduction of solid quantitative prevention targets at the EU level would help consolidate prevention efforts
in European countries and promote a comprehensive prevention policy, including measures and indicators, driven
by the objective of fulfilling the target.
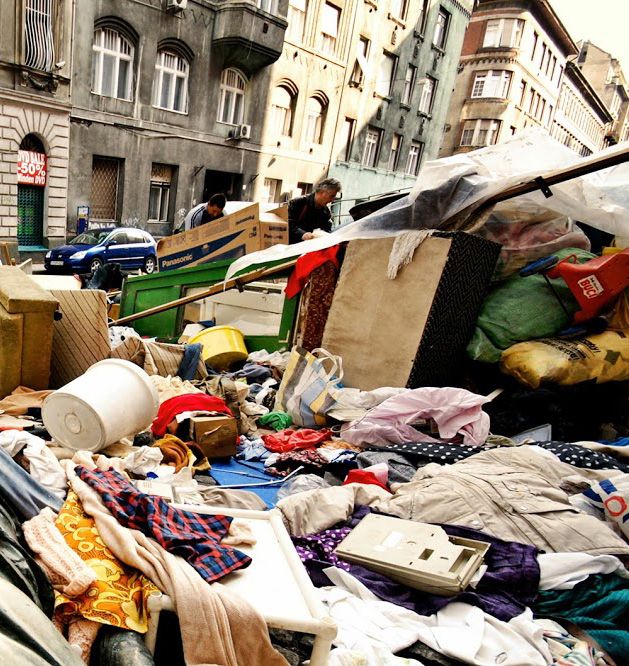
• Textile waste would benefit greatly from waste prevention measures, as this is a fast-growing, environmentally
impactful waste stream associated with unsustainable consumption patterns. The average European generates
approximately 11 kg of textile waste annually.
• Preventing textile waste has great potential, mainly through reducing consumption, eco-design and ultimately
reuse. To facilitate this, emphasis should be put on product design to promote durable and long-lasting materials,
while support should be given to repair (e.g. tax breaks) and reuse (e.g. regulation).
Progress towards preventing waste in Europe — the case of textile waste prevention 7© Beth Barkway, Environment & Me/EEA
Executive summary

Waste prevention is the best waste management policy option,        show a higher tendency to set quantitative targets when there
according to the waste hierarchy, the EU's main rule for the        were solely qualitative targets before, indicating a stronger
environmental ranking of waste management policies. Its main        movement towards waste prevention. While informative
objective is to reduce waste generation, the environmental          measures and awareness-raising are the most used measure
impacts of waste management and the hazardousness of the            types in Member States, we found that the number of newly
waste generated. It is mainly expressed as the aspiration to        initiated voluntary agreements has decreased slightly. Finally,
break the link between waste generation and economic growth         with regard to specific waste streams, measures addressing
(decoupling). To support this objective, the EU and all is Member   plastic packaging waste, food waste and waste electronic
States have put in place legislation that promotes activities in    products in particular have gained in importance.
products' life cycles aimed at reducing the amount of waste
generated. At the national level, these policies are described      With regard to the new focus area of food waste, it has been
in national or regional waste prevention programmes, which          shown that most countries are already active in promoting food
have been in place in most of the countries examined since at       waste prevention. The measures implemented, however, have
least 2013.                                                         been evaluated as relatively light and tend to focus on voluntary
                                                                    commitments or information provision. With the food waste
This report aims to assess progress towards waste prevention        prevention programmes currently developed across Europe, it
measures' main objective of decoupling, scoping the EU as           is expected that food waste prevention policy will be designed
a whole by synthesising information from national waste             in a more systematic manner and that more effective measures,
prevention measures, targets, indicators and targeted waste         targets and data collection systems for food waste will be
streams. Our analysis shows that waste generation at the            introduced. Prevention of waste through reuse, which is the
EU level is still very dependent on developments in the             second new focus area, has gained importance for a number
economy, as expressed through gross domestic product (GDP).         of product groups. Analysis has, however, revealed divergent
The EU has achieved a relative decoupling, meaning that             frameworks depending on product group, with reuse already
waste generation is growing, albeit at a slower pace than           established and a central part of the market for certain product
the economy. However, there are no signs that absolute              groups (e.g. for cars) and still in its infancy for others. However,
decoupling, meaning that waste is decreasing in a growing           the recent focus of EU legislation on reuse is expected to
economy, is close to being achieved at the EU level. Moreover,      motivate EU Member States to intensify their efforts, especially
there is no observable effect of the wide adoption by countries     with respect to product groups addressed by that legislation,
of waste prevention programmes since at least 2013, as waste        namely electronics, furniture, construction materials and
generation, excluding major mineral wastes, has increased by        products, and textiles.
5.7 % in the 4 years between 2014 and 2018. At the national
level, changes in population have not been large enough to          The second part of this report examines the potential of waste
sufficiently explain the changes in waste intensity, defined as     prevention policies to address the growing quantities of textile
the amount of waste generated per unit of GDP. Overall, only        wastes. Textile is a very suitable candidate for such policies,
7 out of 30 countries showed an increase in waste intensity         as it is a fast-growing waste stream, based on unsustainable
(more waste generated per unit GDP) between 2008 and 2018,          consumption patterns, driven by phenomena such as fast
while 12 countries showed a strong (more than 10 percentage         fashion. This suitability is increasingly being recognised by
points) decrease.                                                   EU policymakers, as the textile industry is a key sector for
                                                                    applying circular economy measures, a key part of which is
The national/regional waste prevention programmes have              waste prevention.
been analysed with respect to the waste streams in focus,
indicators, targets and waste prevention measures. This             Each European citizen generates around 11 kg of textile waste
examination revealed that 10 out of the 32 countries reviewed       annually. Of this quantity, around one third is separately
do not have a waste prevention programme in place (based on         collected for reuse and recycling, suggesting that two thirds
data from 2021). To date, only 10 countries have updated their      ends up in residual waste or is stored in households. Several
waste prevention programmes according to the revised Waste          drivers have been identified for the generation of textile waste,
Framework Directive ((EU) 2018/851). Updated programmes             including the increasing number of clothing collections placed

                                                 Progress towards preventing waste in Europe — the case of textile waste prevention        9
Executive summary
on the market by fashion brands, social media advertising fast targets for textile waste prevention. This could be a major
fashion brands and digitalisation, which has helped fashion drawback in waste prevention efforts, as solid targets are a
brands to develop efficient supply chains and gain customers driver for comprehensive policies.
through online shopping.
Furthermore, we assessed the intervention points for textile
The assessment of the policy background on textile waste waste prevention throughout products' life cycle stages; this
prevention has highlighted various regulations that are directly highlights the potential at each stage such as product design,
or indirectly linked to textile waste generation, such as the production and distribution, use and maintenance, and reuse
Textile Regulation on textile fibre names and related labelling to contribute to waste prevention. Various potential measures
and marking of the fibre composition of textile products are discussed, such as the extended producer responsibility
((EU) No 1007/2011), the REACH (Registration, Evaluation, schemes, which can encourage collection for reuse and improve
Authorisation and Restriction of Chemicals) Regulation durability. A key barrier to the implementation of textile waste
((EC) No 1907/2006) and the EU green public procurement prevention measures, targets and indicators continues to be
criteria for textile products and services. At the national level, that the actual quantity of textile waste generation remains
various measures have been set out by Member States to widely unknown. It is argued that increasing the collection rate
address textile waste. While 40 measures have been recorded will make more textiles available for recycling and potentially
in total across all programmes, some included specific also for reuse. Although the textile value chain is highly
sub‑chapters dealing with textile waste generation and linked globalised and complex, closing communication gaps between
environmental impacts. Currently, only 6 out of 31 national stakeholders, implementing 'design for prevention' and
and regional waste prevention programmes include specific increasing transparency, i.e. traceability, would accelerate textile
indicators on textile waste prevention. The majority of these waste prevention efforts. More specifically, strategies need to
indicators focus on the reuse of clothing and footwear. When it be developed to address the increasing consumption of textiles,
comes to targets, it has been shown that none of the currently advance their durability through improved design, and support
available waste prevention programmes include quantified repair and reuse through economic instruments and regulation.
10 Progress towards preventing waste in Europe — the case of textile waste prevention1
Introduction
Waste prevention is a key strategy for Europe's When we look closer at the circular economy objectives of
transformation towards a resource-light and climate-neutral reducing the extraction of natural resources and keeping
circular economy. The long-established waste prevention the value of products as high as possible and for as long as
hierarchy, as the optimal policy option for dealing with waste possible, it is evident that waste prevention clearly contributes
generation (Figure 1.1), offers the same type of systemic to this directly. Adopting key waste prevention strategies, such
and transformational policy objective as the aspiration as design for durability and longevity, reuse of products and
for a circular economy. Waste prevention, by definition, materials and the extension of product lifespans, ultimately
links different life cycle stages of products together under leads to using fewer products, and therefore resources, to
a common principle, namely that of waste reduction. In satisfy our societal needs. Other waste prevention options,
this way, waste prevention provides a comprehensive such as repair and remanufacturing, can safeguard the value
policy approach that links together stakeholders in the of products and make sure that they are used until the actual
supply chain, design and use of products and services, and end of their service life. Waste prevention strategies are
waste management. conceptually summarised in Figure 1.2.
Figure 1.1 The EU waste hierarchy
Product Prevention
(non-waste)
Waste Preparing for re-use
Recycling
Recovery
Disposal
Source: European Commission (2018).
Progress towards preventing waste in Europe — the case of textile waste prevention 11Introduction
Figure 1.2 The R strategies for waste prevention and management
R0 Refuse Make a product redundant: abandon function or use different product
Product design
and R1 Rethink Make product use more intensive: sharing or multi-functional products
manufacture
R2 Reduce Consume less through efficient manufacturing or use
R3 Re-use Re-use of functioning discarded products by another use
R4 Repair Repair and maintenance of defects to deep original function
Extended life spans
and R5 Refurbish Restore and update
functionality
R6 Remanufacture Use parts in a new product with the same function
R7 Repurpose Use products or parts in a new product with a different function
The importance of waste prevention, as outlined above, is account of the high levels of consumption of textile products
recognised not only in EU legislation, but also in the 2020 in Europe and its increasing waste generation. More broadly,
circular economy action plan, which calls for specific waste textiles is also a very relevant sector for EU policymaking. It has
prevention steps to be taken and for the consideration of been recognised as a key sector in the circular economy action
developing waste prevention targets for specific sectors and plan of 2020. Currently, the European Commission is working on
waste streams. preparing a textile strategy for the EU. Therefore, the thematic
part of this report focuses on the prevention of textile waste,
According to the definition set out in the revised Waste assessing the potential for prevention in this waste stream and
Framework Directive (WFD), waste prevention refers to: gathering knowledge that will be potentially useful for the broad
policy processes currently in the making.
measures taken before a substance, material or product
has become waste, that reduce: This report has a dual purpose. The first is to provide a
snapshot of the current implementation of waste prevention
a. the quantity of waste, including through the reuse of measures in Europe and assess the progress towards the main
products or the extension of the lifespan of products; overall objective of waste prevention of decoupling waste
generation from economic growth. The second aim of the
b. the adverse impacts of the generated waste on the report is to investigate a specific waste stream and assess its
environment and human health; or prospects for implementing waste prevention. Therefore, this
report is divided into two parts:
c. the content of hazardous substances in materials and
products. (EU, 2018). • Chapter 2 provides an overview of the progress towards
implementing waste prevention as a whole. It describes the
The overall objective for implementing waste prevention current policy framework and the status quo of national
is to 'break the link between economic growth and the and regional waste prevention programmes, analyses the
environmental impacts associated with the generation of planned and implemented waste prevention measures
waste' (EU, 2018). In order to implement waste prevention, in in these programmes and reviews progress towards
accordance with Article 29 of the WFD, Member States have waste prevention based on waste intensities. A specific
to establish waste prevention programmes describing specific emphasis has been put on the development of new waste
objectives and measures. prevention‑monitoring approaches for reuse and food
waste, in line with policy developments at the EU level.
Waste prevention can be applied to separate waste streams (see
Box 1.1) and the overall policies can be supported by tailor‑made • Chapter 3 is thematic and focuses on the assessment of the
measures that address particular aspects of the waste stream implementation of waste prevention for textile wastes and
in question. Textile waste is a prime candidate stream that involves in-depth analyses of the potential for, barriers to
would benefit greatly from implementing waste prevention on and progress by each Member State and at the EU level.
12 Progress towards preventing waste in Europe — the case of textile waste preventionIntroduction
Box 1.1 Prevention of emerging waste streams
The energy transition to a clean energy system involves several technologies, essential for bringing about this transition
effectively: wind power plants, photovoltaics and energy storage systems. It is expected that waste from the end-of-life
stage of such technologies will increase exponentially in the coming years.
Waste prevention can tackle these emerging waste streams by interventions in product design and maintenance (for more
details, please consult the EEA briefing on emerging waste streams (a)) and some European countries are already moving in
that direction:
• In 2020, Enel Green, in Spain, launched a call for start-ups to develop solutions for the life extension, recyclability and
remanufacturing of wind turbine components.
• In the wind sector, some producers offer regular maintenance and repair of wind turbines in operation to increase
the durability and life span of wind power plants, and others are exploring targets for waste prevention using life
cycle assessment.
• In Finland, France, Germany and some other European countries, enterprises have come to agreements with electric
car manufacturers to use batteries that have been decommissioned but still function in a second-life application as
residential battery packs for storing solar energy.
Note: (a) https://www.eea.europa.eu/publications/emerging-waste-streams-opportunities-and
Progress towards preventing waste in Europe — the case of textile waste prevention 13© Ergys Gezka, WasteSMART/EEA
2
      Monitoring progress in waste
      prevention implementation

2.1        Decoupling waste generation from                                  This complexity of factors affecting waste generation
           economic growth                                                   is significant when trying to interpret trends. When it is
                                                                             impossible to establish causal links between waste prevention
Article 30 of the revised Waste Framework Directive (WFD)                    measures and waste generation trends, it is difficult to draw
mandates the EEA to analyse the 'decoupling of waste                         conclusions on decoupling, as the decoupling stability might be
generation from economic growth and the transition towards a                 compromised by other socio-economic factors. For example,
circular economy' (EU, 2018). In the past, increases in economic             during the dip in waste generation during the financial crisis of
output have been accompanied by simultaneous increases in                    2008-2010 did not lead to decoupling because it was a result
waste generation, and so sustained economic growth brings a                  of an economic downturn, not the effect of waste policy making.
continual increase in waste generation. The transition towards
a circular economy in Europe, in which the value of products
and raw materials contained in those are preserved for as                    2.1.1     EU level
long as possible, aims to break this link and minimise overall
waste generation. Successful waste prevention aims to increase               Figure 2.1 shows that waste generation in the EU has been
well‑being and reduce waste generation and the corresponding                 increasing constantly since 2008. Between 2008 and 2018, total
environmental impacts.                                                       waste generation increased by 8.5 % (more than 182 million tonnes).
                                                                             Major mineral wastes, such as hard rocks, concrete and soils,
There are three types of decoupling:                                         comprise a major share of total waste. However, this type of waste
                                                                             is produced in specific economic sectors (construction and mining)
1. absolute decoupling, when waste generation is decreasing,                 and the management of this type of waste poses a relatively
   while the economy is growing;                                             low environmental concern compared with other waste types.
                                                                             Therefore, to be able to interpret trends in a more meaningful
2. relative decoupling, when waste generation is increasing,                 way, Figure 2.1 includes a trend for waste excluding major mineral
   but at a slower pace than economic growth;                                wastes. This shows a lower increase of 6.4 % over the same period.
                                                                             For both waste generation types, there is a sharper increase in the
3. no decoupling, when waste generation is increasing at the                 last data point (2018). However, it should be noted that measuring
   same pace as or faster than the economy.                                  total waste is a complex task, with data collection and data quality
                                                                             issues encountered.
Interpreting these types of decoupling and linking them to
waste prevention measures is difficult, as other socio-economic              Generally, a population increase could, of course, explain an
factors also influence the level of waste generated. First of all,           increase in absolute amounts of waste generated. However,
regarding the influence of economic factors, waste generation                the EU-27 population was relatively stable between 2008 and
depends more on specific expenditure types and the share of                  2018, so the reasons for the increase in waste generation
expenditure types by income than on broad, economy‑wide                      cannot be attributed to demography. The EU's gross domestic
economic developments, in particular when examining specific                 product (GDP) (1) in the same period of time increased by
waste streams. Other social factors that affect waste generation             20.4 %, at a much faster pace than the waste generated. This
are demography (especially population growth) and household                  means that the EU as a whole has achieved relative decoupling,
size. Underlying this is the cultural variety of Europe, which               but has not yet achieved waste prevention measures' main
encompasses a range of lifestyle habits across all areas,                    objective of actually reducing the waste generated while the
including consumption and waste management.                                  economy grows.

(1)   GDP here includes the contribution of mining and also demolition that result in the waste excluded from the graph in Figure 2.1. Although this
      limitation is acknowledged, the contribution to GDP from these activities is very small.

                                                        Progress towards preventing waste in Europe — the case of textile waste prevention             15
Monitoring progress in waste prevention implementation
Figure 2.1 Waste generation development compared with gross domestic product (GDP) and population in
the EU-27
Percentage
125
Gross Domestic Product
(GDP)
120
115
110
Total waste generation
Total waste excluding
major mineral wastes
105
Population
100
95
0
2008 2009 2010 2011 2012 2013 2014 2015 2016 2017 2018
By 2013, most EU Member States put in place their waste absolute decoupling. The 2016‑2018 change led to the largest
prevention programmes in line with the mandate from the 2008 drop in waste intensity, because although waste generation
WFD. Looking at the waste generation trends in Figure 2.1, there increased at a faster pace than before, the acceleration of the
is no observable impact of the adoption of the programmes economy was even faster. This demonstrates the usefulness
at EU level. In fact, waste generation, excluding major mineral of waste intensity as a metric for monitoring progress towards
wastes, increased by 5.2 % between 2014 and 2018. decoupling waste generation from economic growth.
Waste intensity expresses waste generation per unit of GDP, These changes in waste intensity are the combined effect
reflecting the economy's 'eco-efficiency' in terms of the of various developments that either increase or decrease
levels of waste generated (Eurostat, 2020a). This term and waste generation, specifically continuous economic growth
subsequent indicator is part of Eurostat's circular economy (a key driver of waste generation) and at the same time the
monitoring framework. Waste intensity also reflects the improved efficiency of production processes (as highlighted
structure of the economy, as a services-based economy by Eurostat indicators on resource productivity) (2). It is not
is less waste intensive than an industry-based economy. possible, however, to quantify the effect of waste prevention
However, given that the structure of the economy changes measures that have been implemented by the EU countries
at a relatively slow rate, changes in waste intensity are likely during this period, as the effect of prevention measures can
to indicate trends towards decoupling. For the EU-27, the rarely be assessed quantitatively and unilaterally against
waste intensity (for total waste, excluding major mineral waste generation. On the other hand, we cannot exclude the
waste), decreased from approximately 68 kg/EUR 1 000 GDP possibility that the emphasis given to waste prevention in the
in 2008 to around 60 kg/EUR 1 000 GDP in 2018, which is 2008 WFD may have resulted in, for example, improvements in
a significant improvement, in spite of the EU not achieving waste intensity.
(2) https://ec.europa.eu/eurostat/statistics-explained/index.php?title=Resource_productivity_statistics
16 Progress towards preventing waste in Europe — the case of textile waste preventionMonitoring progress in waste prevention implementation
To highlight the relevance of these contributing factors, a The pace of economic growth based on increasing turnover
decomposition analysis was conducted to assess the effect in industry and increased consumption expenditure by
of certain driving forces on waste generation (Hoekstra and households has outrun efforts to reduce waste generation per
van der Bergh, 2006), decomposing the change in a macro euro of value created.
indicator (waste generation) between two points in time into
the contributions from the changes in the determinants (in this The analysis highlights that an actual and significant decoupling
case, economic growth and waste intensity). of waste generation and economic growth has not been
achieved over the last decade. The total generation of waste is
Figure 2.2 shows the result of this analysis: the change in waste still closely linked to GDP growth rates. The analysis of waste
generated per capita over time (taking 2008 as the reference prevention programmes and other activities aimed at avoiding
year) is depicted as the combined effect of increased GDP and waste generation (see following sections in this chapter) has
decreased waste intensity. An increase in GDP alone would lead shown a slight increase in the stringency of such measures
to an increase in waste generation and a decrease in waste (e.g. showing a higher share of regulatory measures compared
intensity would lead to a decrease in waste generation. The figure with just informative measures, such as awareness raising
shows the net effect of these two developments combined. campaigns); nevertheless, this is not yet reflected in the
actual outcomes that still indicate rather linear patterns of
The orange line indicates that waste generation per capita production and consumption. A more detailed analysis of the
decreased slightly in 2010 and 2012, mainly because of available data shows a very close relation between decreasing
the economic crisis; Between 2010 and 2012 the effect waste intensities and a rising share of the service sector in the
of the increase in GDP on economic growth (in blue) was EU‑27. New business models based on 'pay per use' seem to
overcompensated for by decreased waste intensity (grey bars). contribute to waste prevention, but of course the rising share
The struggling economy grew so slowly that technological and of the tertiary sector — from 33.9 % to 39 % of the EU-27 GDP
organisational improvements were able to reduce the total between 2008 and 2018 — also reduced the share of especially
generation of waste in Europe. Since 2014 the relation between waste-intensive production processes in Europe. Further
the two effects has been reversed, leading to a significant analysis should focus on the extent to which such processes
increase in waste generation per capita of almost 100 kg. have just been outsourced to other regions.
Figure 2.2 Decomposition analysis of waste generation (excluding major mineral wastes)
Percentage
24
22
20
18
16
14
12
10
8 6.90
6
3.18
4
1.12
2
-0.24 -0.32
0
-2
-4
-6
-8
-10
-12
-14
2010 2012 2014 2016 2018
Gross Domestic Product (GDP) Waste intensity Waste generation, excluding major mineral waste
Progress towards preventing waste in Europe — the case of textile waste prevention 17Monitoring progress in waste prevention implementation
Map 2.1 Percentage change in generation of waste per GDP unit between 2008 (a) and 2018 (excluding major
mineral waste) and population per country
Waste intensity Waste
-33 1 570 change 2008-2018 generation 2018
(%) (kg/capita)
10
Iceland
Reduced Below EU average
-21 2 135 -40 2 569 Increased Above EU average
10 4
-11 1 660
Sweden Finland Population
12 -1 9 711 change 2008-2018 (%)
Norway -1 Decreased
-8 701 Estonia Increased
0 1 774 -12
6 Latvia -39 1 403
75 1 611
Denmark -13
8 -5 2 112
-3 2 612 Lithuania
Ireland 5 0
4 1 872
Netherlands Poland
38 3 504 1
Germany -8 1 542 -22 1 579
7
-4 2 278 3 1
Belgium
24 Czechia
Slovakia -63 1 115
Luxembourg -32 1 884 -24 1 099 -5
6 -3 Romania
-2 1 515
Austria -16 1 479 Hungary
5
3
8 3 097
France Slovenia 18 922 -6
-15 1 316 -21 955
-5
-2 23 1 850 Bulgaria 14
Croatia
Portugal 0 1 540 3 -9 1 478 Turkey
2 -3
Italy
Spain 3 1 090 -9 930
Greece
17 11
Malta Cyprus
Note: Waste generation is given for 2018 as kg/capita.
(a) 2008 was selected as a reference year so that a large enough time interval was created for monitoring developments in waste
intensity. However, it should be noted that, for some countries, the effect of the economic crisis of 2007-2011 might have affected the
levels of waste generation and GDP in 2008.
Sources: Eurostat (2021a, 2021b).
is not large enough to explain sufficiently the changes in the
2.1.2 Country level waste intensity. In some countries with positive developments in
waste intensity (negative values in Map 2.1), population increased,
Map 2.1 illustrates the evolution of waste intensity as the such is the case in Austria, Finland, Iceland, Turkey and Sweden.
generation of waste (excluding major mineral waste) per unit In countries that were also successful in decoupling the waste
GDP from 2008 to 2018. Positive values in Map 2.1 indicate that generation from economic growth, such as Romania, Lithuania
the increase of waste generation has exceeded the economic and Hungary, the population did decrease, but this alone cannot
growth (in terms of GDP) within that period, whereas negative justify the changes in waste intensity. On the other hand, Latvia is
values indicate a successful relative or absolute decoupling of the only country where the population decrease was higher than
waste generation from economic growth. Map 2.1 also shows the the reduction in waste intensity, meaning that the improvement in
population change in the same period (2008-2018) and the level Latvia can be explained by the population change. In the countries
of waste generation in 2018. In most cases, the population change where waste intensity increased between 2008 and 2018, the
18 Progress towards preventing waste in Europe — the case of textile waste preventionMonitoring progress in waste prevention implementation
population increase was always smaller than the increase rate of of a legislative change in the WFD (see Article 30(1)). Given that
waste intensity and therefore this cannot be the only reason for all Member States had to have their first waste prevention
the changes in waste intensity. programmes published in 2013, various Member States had
planned to have a new waste prevention programme in place
In total, only 7 out of the 30 countries in Map 2.1 show an in 2019, 6 years after their first one. However, the amendment
increasing waste intensity, while 12 show a strong (more than of the WFD in 2018 introduced a new approach to waste
10 percentage points) decrease. Ireland shows the highest prevention and new requirements for EU Member States.
increase in waste intensity, meaning that its waste generation far Therefore, a number of EU countries are in the process of
exceeded economic growth, while the opposite is the case for reconsidering their national waste strategies, including waste
Romania. To account for factors influencing waste intensity, other prevention. This report takes into account newly ratified waste
than waste prevention measures, a deeper investigation of the prevention programmes where available, but it should also be
economic structure of the countries would be needed, but that acknowledged that the effect of the amended WFD is not yet
exercise is outside the scope of this report. Note that changes reflected in all countries' waste prevention programmes.
in data collection systems, data quality, waste classification and
definitions might have played a role in the data in Map 2.1. Reflecting on the impact of adopting waste prevention
programmes on waste generation, no observable trends can
Despite the acknowledged complexity of assessing waste be seen. Figure 2.1 shows that waste generation has been
generation trends against economic developments, the unaffected by the wide adoption of such programmes by
main objective of the EU waste prevention policy, namely European countries in 2013. Moreover, looking at individual
the absolute decoupling of waste generation from economic countries in the EEA waste prevention country profiles (3),
growth, has not been achieved yet. However, the fact that many the adoption of a waste prevention programme is very rarely
EU Member States, and the EU as a whole, show a relative correlated with a drop in waste generation afterwards.
decoupling during the period 2008-2018 is an encouraging sign
for future developments.
Box 2.1 Example of the evaluation process
2.2 Overview of national and regional waste in Germany
prevention programmes
The German federal government adopted its first
The WFD required that Member States established waste waste prevention programme in July 2013 under the
prevention programmes no later than December 2013. The title 'Waste prevention programme of the German
government with the involvement of the federal states'
waste prevention programmes have been operating since then.
('Abfallvermeidungsprogramm des Bundes unter Beteiligung
The following Table 2.1 provides an overview of the current
der Länder'). The German waste prevention programme is
status and duration of the different regional and national waste
to be evaluated every 6 years and updated as necessary
prevention programmes. Based on the provisions in the WFD, as per Section 33 of Germany's waste prevention
some were developed as stand-alone programmes, whereas in mechanism, the Circular Economy Act (KrWG). Against
some other countries the programmes have been included in this background, the German environmental protection
waste management plans or strategies. agency (Umweltbundesamt) initiated a research project to
evaluate the status quo of waste prevention in Germany.
It can be observed that there is an increasing trend for countries This included an assessment of waste prevention results
to integrate waste prevention programmes in national waste and the institutional structures. Other aspects not
management plans or other policy documents, such as their previously addressed in the waste prevention programme
were also to be examined to see whether or not they
circular economy laws or strategies, as is the case in France, for
contribute to waste prevention. Specific proposals to
example. One reason for this trend is that such an integration
possibly develop and update the programme were
with waste management plans aligns the implementation
developed based on the results of the analysis referring
period of a country's main strategic waste policy documents. to the current status of the implementation of the waste
This, however, might lead to gaps if a country is not covered by prevention programme at the federal, state and municipal
a waste prevention programme for a certain period. levels and the evaluation of existing prevention potentials.
Concrete proposals for measures concerning previously
Table 2.1 shows that 10 out of the 32 countries are not covered prioritised waste streams and relevant priority prevention
by a waste prevention programme in 2021. According to the approaches were developed to facilitate this.
WFD, waste prevention programmes have to be evaluated and
revised at least every 6 years and, where relevant, in the event Sources: UBA (2020).
(3) https://www.eea.europa.eu/themes/waste/waste-prevention/countries
Progress towards preventing waste in Europe — the case of textile waste prevention 19Monitoring progress in waste prevention implementation
The analysis presented in this report is based on the national measures and monitoring schemes can be found in the EEA
waste prevention programmes presented in Table 2.1. More waste prevention country profiles. Tables 2.2-2.4) aim to provide
details referring to concrete objectives, targets, indicators, an overview of the different aspects of these programmes.
Table 2.1 Status and duration of waste prevention programmes in Europe by mid-2021
2014
2015
2016
2017
2018
2019
2020
2021
2022
2023
2024
2025
2030
EEA member countries
Austria
Belgium (a)
Bulgaria
Croatia
Cyprus
Czechia
Denmark 2027
Estonia
Finland
France ∞
Germany ∞
Greece 2030
Hungary
Iceland 2027
Ireland
Italy
Latvia
Liechtenstein
Lithuania
Luxembourg
Malta
Netherlands ∞
Norway ∞
Poland
Portugal
Romania
Slovakia
Slovenia
spain
Sweden
Switzerland ∞
Turkey
Notes: The dark blue bars represent programmes updated in accordance with the revised WFD of 2018. The light blue bars refer to initial and
partially still ongoing programmes. Grey cells indicate that no programme was in place in that year.
(a) The Brussels and Flanders regional programmes end in 2023 and 2022, respectively, while the Wallonia regional plan ends in 2024.
20 Progress towards preventing waste in Europe — the case of textile waste preventionMonitoring progress in waste prevention implementation
2.3 Waste streams The national waste prevention programmes include measures
and targets for the specific waste streams in focus accordingly.
Within the WFD (Article 9), waste prevention includes Each country's selection of waste stream, however, is also
particularly the following streams: waste electrical and related to factors such as waste volumes generated or economic
electronic equipment (WEEE), textiles and furniture, packaging, importance (EEA, 2021), which may differ in different national
manufacturing and hazardous waste. Additionally, there is a settings. An overview of the waste streams considered in the
special focus on the prevention of food waste. national waste prevention programmes is outlined in Table 2.2.
Table 2.2 Waste streams considered in EEA member countries and regions
Food/ Plastic/ Household/
EEA member Manufacturing Hazardous
organic packaging Textile (16) WEEE (29) municipal
countries waste (29) waste (27)
waste (30) waste (30) waste (28)
Austria
Belgium (a)
Bulgaria
Croatia
Cyprus
Czechia
Denmark
Estonia
Finland
France
Germany
Greece
Hungary
Iceland
Ireland
Italy
Latvia
Liechtenstein
Lithuania
Luxembourg
Malta
Netherlands
Norway
Poland
Portugal
Romania
Slovakia
Slovenia
Spain
Sweden
Switzerland
Turkey
Note: (a) Note that the regional plan, as part of the Wallonia regional programme, does not cover textile and manufacturing waste.
Progress towards preventing waste in Europe — the case of textile waste prevention 21Monitoring progress in waste prevention implementation
Based on this overview, it can be stated that most countries The waste Prevention indicators can thereby be manyfold,
have almost all types of waste materials covered: categorised into four types: (1) output-based indicators,
(2) decoupling indicators, (3) response indicators and (4)
• Hazardous waste, which is considered in almost all indicators of specific waste prevention measures. While
countries, is often addressed in specific strategies, e.g. in output‑based indicators monitor the success of waste
the Irish national hazardous waste management plan. prevention measures in absolute numbers or percentages,
decoupling indicators consider them in relation to economic
• Plastic, i.e. packaging waste, and food waste are focus values such as GDP. Response indicators relate to the process
points in all programmes that are covered by various types of waste prevention (such as number of measures) and, finally,
of measures. indicators are grouped into specific waste prevention measures
that do not relate to the aggregated effects of the programme
• Textile waste, which has gained in importance as a waste but to specific prevention measures (such as cost-benefit). An
stream, is considered in 16 programmes. Countries such overview of indicator types considered in the waste prevention
as Belgium, Germany and Slovakia have included textile programmes of the countries examined is provided in Table 2.3.
waste in their revised waste prevention programmes,
whereas there had been no consideration of textile waste It can be seen that output-based indicators are covered in
in their former programmes. most of the programmes. These mostly refer to the generation
of total or specific waste streams or to material flows such as
With respect to the recommendations of the revised WFD, household or municipal waste or construction and demolition
countries already seem to have been considering WEEE, waste (tonnes/year). Reuse rates are also considered; for
packaging, manufacturing and hazardous waste. Furniture is example, Poland considers the percentage of packaging placed
not yet broadly addressed as a standalone waste stream, but on the market that is reusable.
in some cases it is included in household waste prevention
measures. Textile waste is not yet a focus in most countries, Decoupling indicators, which illustrate a nation's waste
but the recent policy focus at the EU level (e.g. the forthcoming intensity or the waste intensity of a specific sector, are
textile strategy) is expected to make textiles more prominently implemented in 11 out of 30 programmes. They are commonly
part of the next versions of waste prevention programmes. expressed per unit of GDP (and per population) or gross value
added (GVA). An example is Slovakia, where the indicator
Overall, it can be seen that the revision of waste prevention quantity of total municipal waste per unit of GDP and
programmes is accompanied by an extension of the waste population is used.
streams considered. Slovakia, for instance, includes the waste
streams textiles and WEEE, which are additions in comparison Response indicators can cover a wide range of indicators.
to its former programme. Denmark, for example, considers the number of enterprises
with certified environmental management, the number of
This overview also serves as a reflection of the countries' policy eco-labelled products and the degree of public awareness of
priorities. The fact that plastic and food waste are considered them. Italy uses response indicators throughout various waste
throughout all programmes can, for instance, be traced streams, such as the number of guidelines related to food
back to policy initiatives at the EU level; waste prevention industry by-products or the number of ethical procurement
programmes serve as a policy vehicle to address certain groups created.
requirements. These two streams have long been recognised
as having a significant potential for prevention, while the Indicators linked to specific waste prevention measures
prevention of food waste is specifically included in the UN (e.g. banning specific single-use plastic products) are included
Sustainable Development Goals. in nine programmes. Ireland, for instance, considers the money
saved by comparing the costs of waste before and after the
intervention. The region Flanders, on the other hand, considers
2.4 Indicators the amount and cost of littering and illegal dumping and the
number of rubbish bins.
The application of indicators is crucial to monitoring and
assessing the waste prevention measures set in place. Overall, it can be stated that indicators are relatively sparsely
Given that the amendments in the WFD reorient the policy used throughout the countries, with output-based indicators
focus from the development of prevention strategies and being the most common type of indicator used. While some
programmes towards the implementation of prevention and programmes involve indicators that cover up to three types of
its monitoring, indicators become essential elements for future indicator, other programmes have not included any indicator.
prevention policies. Indicators ensure not only the monitoring This can be the case for countries that predominantly define
of developments but also the evaluation of their effectiveness. qualitative waste prevention targets, e.g. Norway.
22 Progress towards preventing waste in Europe — the case of textile waste preventionMonitoring progress in waste prevention implementation
Table 2.3 Waste prevention indicators considered in EEA countries and regions
EEA member Output-based Decoupling Response Specific waste prevention
countries indicators (22) indicators (11) indicators (18) indicators (9)
Austria
Belgium (a)
Bulgaria
Croatia
Cyprus
Czechia
Denmark
Estonia
Finland
France
Germany
Greece
Hungary
Iceland
Ireland
Italy
Latvia
Liechtenstein
Lithuania
Luxembourg
Malta
Netherlands
Norway
Poland
Portugal
Romania
Slovakia
Slovenia
Spain
Sweden
Switzerland
Turkey
Note: The programme for the Brussels region contains no indicators, while the Flemish one includes only specific indicators.
Progress towards preventing waste in Europe — the case of textile waste prevention 23Monitoring progress in waste prevention implementation
2.5 Targets where solely qualitative targets were considered before. This
has been the case in Germany and Slovakia, and although
Target setting is the cornerstone of policymaking in the area Cyprus did not have any defined targets, the new programme
of waste prevention. Targets set the stage and calibrate the includes both qualitative and quantitative targets. This
ambition of the overall waste prevention strategy and for development indicates countries making stronger commitments
specific waste streams if needed. Targets can drive the policy to waste prevention and is expected to bear measurable results
process, as they require: in the coming years.
• developing indicators for monitoring progress towards This leaves only two countries with no waste prevention
the target; targets: Hungary and Switzerland. Following the trend of
other countries, however, targets might be set with their
• indicating data requirements to measure progress; updated programmes.
• designing measures that would bring about the change The introduction of common waste prevention targets at the EU
commanded by the target; level would help harmonise efforts in countries and promote
the development of solid policies around them. The efforts to
• evaluating the effectiveness of the entire waste prevention achieve the targets would lead to measure being developed
programme at the end of its implementation. to support this, determine the waste streams to focus on and
improve the monitoring of progress towards the set targets.
The type of targets defined in the waste prevention
programmes can be qualitative or quantitative. An overview of
target types set throughout the Member States is outlined in
Table 2.4.
Box 2.2 Quantitative waste prevention targets in
France
A quantitative target is usually concrete and measurable.
That is why it serves as a strong driver for waste prevention In 2020, France introduced a law on the circular
implementation. A successful implementation is, however, economy and the fight against waste. This legislation
dependent on the availability of timely and robust data sets, introduces a large number of quantitative targets
which can be a limitation. Quantitative targets are included in covering overall waste generation and also particular
22 out of the 30 programmes reviewed. However, they mostly waste streams, such as plastic and food waste. These
refer to one or two waste streams that are in focus in that legally binding targets include:
country. Croatia and Estonia, for instance, have one central
• reducing household waste by 15 %;
target on municipal waste prevention, whereas Austria's and
Finland's quantitative target is to halve food waste by 2030.
• reducing the quantities of non-hazardous waste
admitted to storage facilities by 30 % in 2020,
When carefully planned, qualitative targets can provide relative to 2010, and by 50 % in 2025;
evidence of successful actions. A few countries (e.g. Austria,
Iceland, Norway and Slovenia) have identified qualitative targets • recycling 100 % of plastic by 2025, driven and
only, while in most countries qualitative and quantitative ensured by the national waste prevention and
targets exist. The qualitative targets defined within the waste management policy through measures such as
prevention programmes are manifold but mainly refer to improved waste collection programmes;
central waste streams (e.g. electronics, construction, municipal
waste and hazardous waste). Slovenia and Iceland, for instance, • reducing the number of single-use plastic beverage
bottles placed on the market by 50 % by 2030
have several measures in place that focus explicitly on
(Article 66);
hazardous waste prevention.
• halving food waste in distribution and collective
An ideal situation for national programmes is to use both types catering by 2025 and food waste in consumption,
of targets in a blended approach. This is being done by a lot of production, processing and commercial catering by
countries. Particularly with regard to the updated programmes, 2030, relative to 2015 (Article 11).
the tendency is that quantitative targets have been put in place
24 Progress towards preventing waste in Europe — the case of textile waste preventionMonitoring progress in waste prevention implementation
Table 2.4 Waste prevention targets considered in EEA countries and regions
EEA member countries Quantitative targets (22) Qualitative targets (23) No targets (2)
Austria
Belgium (a)
Bulgaria
Croatia
Cyprus
Czechia
Denmark
Estonia
Finland
France
Germany
Greece
Hungary
Iceland
Ireland
Italy
Latvia
Liechtenstein
Lithuania
Luxembourg
Malta
Netherlands
Norway
Poland
Portugal
Romania
Slovakia
Slovenia
Spain
Sweden
Switzerland
Turkey
Note: The Brussels regional programme does not have quantitative targets.
Progress towards preventing waste in Europe — the case of textile waste prevention 25Monitoring progress in waste prevention implementation
2.6 Waste prevention measures Development (ENEA) launched a Symbiosis Users Network
to enable industrial symbiosis in Italy. The network focuses
The WFD obliges the Member States to indicate specific on operational symbiosis issues to prevent waste and
measures by which the amount of waste and related promote circular economy models.
environmental impacts are to be reduced.
2. Most waste prevention programmes include some
The analysis of the national and regional waste prevention regulatory instruments. Romania, for instance, launched
programmes highlights the broad range of measures already a ban on landfilling food waste from wholesale, retail and
taken or under development in Europe. A total of 327 specific distribution sectors from January 2023 onwards — forcing
measures have been recorded, which cover measures initiated these stakeholders to explore prevention potentials more
or undertaken by public authorities only — most countries and thoroughly. By contrast, in Austria single-use plastic bags
regions focus on similar sets of measures. This figure does not have been banned since January 2020, following the rapid
include the probably far bigger number of private initiatives by implementation of the EU Single-use Plastics Directive.
households or companies, e.g. professional online platforms
that offer second-hand products. 3. Economic instruments aim to set economic incentives for
changes in consumption or production patterns by making
It is important to note that this chapter considers national less waste-intensive alternatives more attractive. This type
initiatives. However, countries have the opportunity to of instrument involves tax regulations (e.g. Bulgaria and
collaborate on or exchange best practices regarding waste Sweden), the introduction of fees for plastic bags (e.g. most
prevention measures in international settings. At the EU EU Member States) and other waste management
level, a good example of a platform for such exchanges is the operations so that 'waste-light' products or services become
European Week for Waste Reduction (4), during which more more competitive. The financial support for specific waste
than 10 000 waste prevention actions were logged in 2020 prevention measures can be counted as an economic
from 33 European countries. Other collaborative opportunities instrument as well as an economic incentive for making
are offered through country networks such as the European sustainable purchases (e.g. Portugal).
Commission's waste working group and the EEA's Eionet. Good
practice examples are systematically registered in the EEA's 4. Information instruments relate to campaigns for
country profiles (5) for inspiration and, specifically for food consumers or businesses. Romania, for instance, conducts
waste prevention, at the newly launched EU Food Loss and awareness-raising campaigns on composting, the reduction
Waste Prevention Hub (6). of food waste and responsible paper consumption.
The Netherlands, on the other hand, states that it will
implement an eco-design knowledge platform enabling
2.6.1 Share of policy instruments businesses to access knowledge on a permanent basis. The
underlying assumption is that better access to information
The waste prevention programmes cover a variety of policy will change consumer habits or nudge companies towards
instruments that can be grouped into the following four main taking up cost-saving opportunities.
types: (1) voluntary agreements, (2) regulatory instruments,
(3) economic instruments and (4) information instruments. Figure 2.3 illustrates that more than half of the measures
included in countries' waste prevention programmes focus
1. Voluntary agreements refer to agreements among various on the provision of information and awareness-raising. Of the
stakeholders. They do not necessarily require a political measures listed in the waste prevention programmes, 6 % can
decision-making process but rather require negotiations. be classified as regulatory instruments and 18 % as economic
In 2016, for instance, the Italian National Agency for or market-based instruments. Voluntary agreements represent
New Technologies, Energy and Sustainable Economic 22 % of the measures.
(4) https://ewwr.eu
(5) https://www.eea.europa.eu/themes/waste/waste-prevention/countries
(6) https://ec.europa.eu/food/safety/food_waste/eu-food-loss-waste-prevention-hub
26 Progress towards preventing waste in Europe — the case of textile waste preventionYou can also read