Prospective study of dynamic whole body 68Ga DOTATOC PET/ CT acquisition in patients with well differentiated neuroendocrine tumors
←
→
Page content transcription
If your browser does not render page correctly, please read the page content below
www.nature.com/scientificreports
OPEN Prospective study of dynamic
whole‑body 68Ga‑DOTATOC‑PET/
CT acquisition in patients
with well‑differentiated
neuroendocrine tumors
Philippe Thuillier1,2*, David Bourhis2,3, Jean Philippe Metges5, Romain Le Pennec2,3,
Karim Amrane4, Ulrike Schick4, Frédérique Blanc‑Beguin2,3, Simon Hennebicq2,3,
Pierre‑Yves Salaun2,3, Véronique Kerlan1,2, Nicolas Karakatsanis6 & Ronan Abgral2,3
To present the feasibility of a dynamic whole-body (DWB) 68Ga-DOTATOC-PET/CT acquisition
in patients with well-differentiated neuroendocrine tumors (WD-NETs). Sixty-one patients who
underwent a DWB 68Ga-DOTATOC-PET/CT for a histologically proven/highly suspected WD-NET
were prospectively included. The acquisition consisted in single-bed dynamic acquisition centered on
the heart, followed by the DWB and static acquisitions. For liver, spleen and tumor (1–5/patient), Ki
values (in ml/min/100 ml) were calculated according to Patlak’s analysis and tumor-to-liver (TLR-Ki)
and tumor-to-spleen ratios (TSR-Ki) were recorded. Ki-based parameters were compared to static
parameters (SUVmax/SUVmean, TLR/TSRmean, according to liver/spleen SUVmean), in the whole-
cohort and according to the PET system (analog/digital). A correlation analysis between SUVmean/
Ki was performed using linear and non-linear regressions. Ki-liver was not influenced by the PET
system used, unlike SUVmax/SUVmean. The regression analysis showed a non-linear relation between
Ki/SUVmean (R2 = 0.55,0.68 and 0.71 for liver, spleen and tumor uptake, respectively) and a linear
relation between TLRmean/TLR-Ki (R2 = 0.75). These results were not affected by the PET system, on
the contrary of the relation between TSRmean/TSR-Ki (R2 = 0.94 and 0.73 using linear and non-linear
regressions in digital and analog systems, respectively). Our study is the first showing the feasibility of
a DWB 68Ga-DOTATOC-PET/CT acquisition in WD-NETs.
Abbreviations
18FDG 18-Fluorodesoxyglucose
68Ga-DOTA-SST Gallium-68 DOTA-conjugated somatostatin receptor-targeting peptide
AUC Area under the curve
DCB Dynamic cardiac-bed
DWB Dynamic whole-body
IF Input function
Ki Net uptake rate
KSR Ki-tumor to SUVmean-tumor ratio
NECs Neuroendocrine carcinomas
NETs Neuroendocrine tumors
PET/CT Positron-emission tomography computed tomography
PRRT Peptide-receptor radionuclide therapy
ROI Region of interest
1
Department of Endocrinology, University Hospital of Brest, Boulevard Tanguy Prigent, 29609 Brest cedex,
France. 2EA GETBO 3878, University Hospital of Brest, Brest, France. 3Department of Nuclear Medicine,
University Hospital of Brest, Brest, France. 4Department of Radiotherapy, University Hospital of Brest, Brest,
France. 5Department of Oncology, University Hospital of Brest, Brest, France. 6Department of Radiology, Weil
Cornell Medical College of Cornell University, New York, NY, USA. *email: philippe.thuillier@chu‑brest.fr
Scientific Reports | (2021) 11:4727 | https://doi.org/10.1038/s41598-021-83965-9 1
Vol.:(0123456789)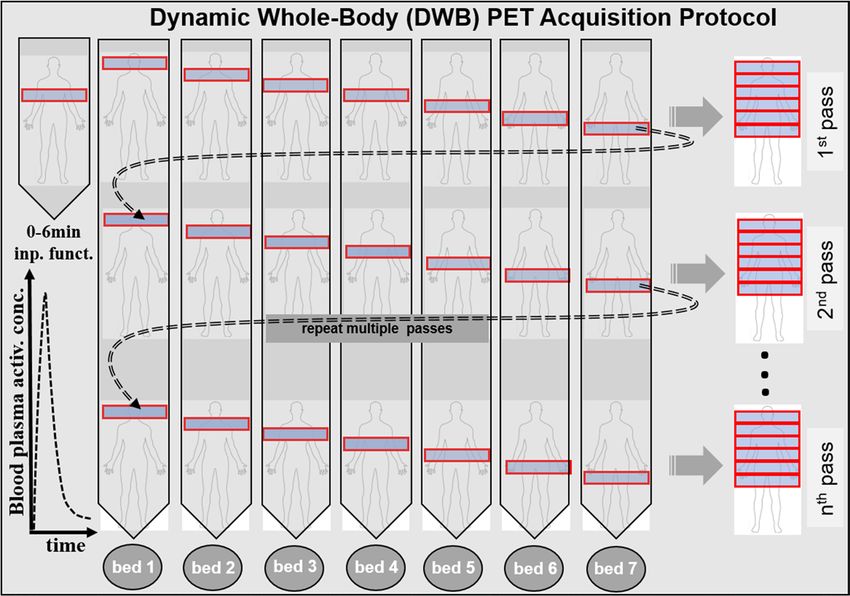
www.nature.com/scientificreports/
SSA Somatostatin analogs
SSTR Somatostatin receptors
SUV Standardized uptake value
TAC Time-activity curve
TBR Tumor-to-blood pool ratio
TLR-Ki Ki-tumor to Ki-liver ratio
TLRmean SUVmean-tumor to SUVmean-liver ratio
TSR-Ki Ki-tumor to Ki-spleen ratio
TSRmean SUVmean-tumor to SUVmean-spleen ratio
VOI Volume of interest
WD-NETs Well-differentiated NETs
Neuroendocrine tumors (NETs) are a group of rare tumors with a common embryological origin. NETs are
characterized by a cellular over-expression of somatostatin receptors (SSTR) allowing the use of radio-labeled
somatostatin analogs for diagnostic imaging or peptide-receptor radionuclide therapy (PRRT). Management
of patients with NETs remains challenging and requires a multidisciplinary approach both for diagnosis, the
histopathological characterization of the tumor and treatment strategy. For a long time, somatostatin receptor
scintigraphy was used in the management of patients with well-differentiated NETs (WD-NETs)1. Currently,
Gallium-68 DOTA-conjugated somatostatin receptor-targeting peptide (68Ga-DOTA-SST) positron-emission
tomography computed tomography (PET/CT) is the mainstay for the diagnosis, staging and monitoring of
WD-NETs2,3.
The capability of quantifying tracer uptake in PET is a real advantage, not only for tumor characterization
(heterogeneity, cellular proliferation) but also for treatment management (response assessment, PRRT plan-
ning). Nevertheless, the actual quantification approach based on standardized uptake value (SUV) parameters
extracted from a 3D static PET acquisition presents some limitations4. Several studies have already assessed
the correlation between SUV-based parameters in 68Ga-DOTA-SST PET/CT and the SSTR expression of NETs,
reporting different results according to the differentiation grade of tumors (i.e. WD-NETs and poorly differenti-
ated neuroendocrine carcinomas (NEC)). Indeed, in a study including 21 NEC, a strong correlation (r = 0.89;
p < 0.0001) was found between SSTR2 gene expression of tumor and SUVmax in 68Ga-DOTATOC PET/CT. On
the contrary, an important overlap in SUVmax values according to SSTR expression grading system was reported
in series concerning patients with WD-NETs, SUVmax not allowing to discriminate WD-NETs with weak, mod-
erate or strong SSTR e xpression5,6. For example, Haug et al. fond only a weak correlation (r = 0.40, p < 0.05) in
27 patients with metastatic NETs6. Moreover, 3 out of 5 NETs without immunohistochemical SSTR expression
showed a high uptake of 68Ga-DOTATATE. In addition to the diagnosis, this variance also appears to occur for
the treatment strategy of WD-NETs. Indeed, a high SSTR expression demonstrated in 68Ga-DOTA-SST PET/
CT is considered as an essential criterion before initiation of somatostatin analogs (SSA) or PRRT. However, few
studies assessed the correlation between SUV-based parameters recorded on pretherapeutic 68Ga-DOTA-SST
PET/CT and the outcome of patients treated by SSA. Only one cohort study, including 30 patients with WD-NET
candidate to Octreotide LP, suggested a positive correlation between progression-free survival and SUVmax in
68
Ga-DOTATATE-PET/CT7, but without significance in ROC analysis (area under the curve (AUC) = 0.647 with
SUVmax threshold of 32, sensitivity and specificity of 75% and 64% respectively; p = 0.17). Therefore, the authors
concluded that SUVmax value in 68Ga-DOTATATE-PET/CT could not be used alone but maybe integrated with a
composite scoring system to predict treatment response to S SA7. Regarding studies assessing SUV-based param-
eters to predict the therapeutic response to PRRT, the results highlighted divergent conclusions. Thus, the choice
of the most relevant parameter whether using the pretherapeutic SUV or the deltaSUV during PRRT treatment
is not established. Once again, ROC analysis of SUV-based parameters alone remained often d isappointing8–11.
Numerous studies have already demonstrated the advantage of quantifying 18-fluorodesoxyglucose (18FDG)
uptake based on compartmental modeling approaches using a 4D dynamic PET/CT acquisition to improve
both tumor characterization and treatment response assessment in comparison with 3D static a cquisition12.
Nevertheless, only few studies assessed the usefulness of dynamic acquisition in 68Ga-DOTA-SST PET/CT in
patients with N ETs13–16. In a small cohort of 10 patients, Velikyan et al. studied the correlation between the Net
Uptake Rate (Ki) and the SUV for both 68Ga-DOTATOC and 68Ga-DOTATATE tracers. Their results showed
no linear correlation between SUVmean and Ki, SUVmean not increasing when Ki values exceeded 0.2 ml/min/
ml. The authors suggested that the SUV did not correctly reflect the density of receptors for highly-expressed
SSTR tumors and could lead to an underestimation of their expression in some c ases13. However, these studies
proposed a one-step dynamic acquisition, limiting the analysis to a sole region of the body and thus constituting
a limitation in the evaluation of metastatic multifocal cancers mainly prevalent in N ETs17. Recently, multi-step
or flow motion acquisition protocols have been developed in the latest generations of PET machines, making
possible to perform a dynamic whole-body (DWB) analysis in a single s can18–22. To our knowledge, no study has
already assessed the interest of a DWB 68Ga-DOTATOC-PET/CT acquisition in patients with NETs.
The objectives of this study are: (i) to present the feasibility of a DWB 68Ga-DOTATOC-PET/CT acquisition
in two PET systems (i.e. analog versus digital) in a large population of patients with WD-NETs; (ii) to describe
derivated Ki parameters within tumor lesions and healthy organs; and (iii) to compare them with the correspond-
ing SUV parameters, according to the cohort characteristics.
Materials and methods
This is a prospective monocentric study ancillary to the GAPET-NET trial (NCT03576040).
Scientific Reports | (2021) 11:4727 | https://doi.org/10.1038/s41598-021-83965-9 2
Vol:.(1234567890)
www.nature.com/scientificreports/
Population. Inclusion criteria. Inclusion criteria were as follows: patients ≥ 18 years old, undergoing a
DWB 68Ga-DOTATOC-PET/CT acquisition for the staging or restaging of a histologically proven or highly
suspected WD-NETs.
Exclusion criteria were as follows: minor patient, other tumor types, tracer contraindication (pregnancy,
breastfeeding), refusal to participate.
The protocol was approved by the institutional medical ethics committee of Brest (29BRC17.0036). Informed
consent was obtained from all the patients to participate in the study.
Patients characteristics. Sixty-one patients (32M/29F) with a mean age of 59.3 ± 15.6 years were included
between July 2018 and July 2019. The clinical characteristics of the population are presented in Table 1. The most
frequent primary tumor origin (34/61 = 55.7%) was the foregut, including 30 patients with a pancreatic NET.
Fourteen (23%) patients had a secretory syndrome and 37 (61%) presented a metastatic disease. Histopatho-
logical grading was not possible in 14 cases for the following reasons: typical imaging of NET in 9 cases (no
cytological exploration in 7 patients with known MEN-1; non-contributory endoscopic ultrasound fine-needle
aspiration in 2 patients with small size pancreatic tumors) and no Ki67 immunohistochemistry of a proven WD-
NET documented in 5 cases (not carried out in routine practice on the date of diagnosis). Among the 47 remain-
ing patients, 29 (63%) had a grade 2 WD-NET. The median Ki-67 value was 5% [IQR, 2–10]. Nineteen (31%)
patients were treated with SSA therapy at the time of the PET/CT. The 68Ga-DOTATOC-PET/CT was performed
for the stating or the restaging of the disease in 31 (50.8%) and 30 (49.2%) cases, respectively.
PET/CT imaging. All images were acquired on two different Biograph (Siemens©, Erlangen, Germany) PET
machines: a mCT system until October 2018; and after a digital Vision system (Siemens©, Erlangen, Germany).
The DWB PET were acquired on the mCT and the Vision systems in 39 (74%) and 22 (36%) cases respectively.
The mean injected tracer dose was of 194.1 ± 42.4 MBq (range: 122–298) and the mean injected tracer dose
(MBq) per kg was of 2.66 ± 0.32 (range: 2.02 – 3.54).
CT data were acquired first after injection of intravenous iodine contrast agent (1.5 mL/kg), unless contraindi-
cated. The CT consisted of a 64-slice multidetector-row spiral scanner with a transverse field of view of 700 mm.
The CT parameters were: collimation of 16 × 1.2 mm, pitch = 1, tube voltage and exposure automatically regulated
(CarekV, CareDose 4D) with 120 kV and 80 Qref mAs as basic parameters. The CT images were reconstructed
with an iterative method (SAFIRE, strength 5).
PET images were then acquired immediately after the injection of 68Ga-DOTATOC prepared with gallium-68
eluted with a Galliapharm generator (Eckert and Ziegler©, Berlin, Germany) and DOTATOC kits purchased
from AAA (Advanced Accelerator Applications©, Saint Genis Pouilly, France).
PET data were reconstructed without and with attenuation correction using an iterative reconstruction algo-
rithm (OSEM 3D) with “time of flight” (ToF) and point spread function (PSF) correction (Siemens© TrueX).
PET images were corrected for random coincidence, scatter and attenuation using CT data; and smoothed using
a Gaussian filter (2 mm wide at mid-height). The sizes of the transaxial reconstruction matrix were respectively
200 × 200 (voxel size = 4.07 × 4.07 × 2 mm) and 440 × 440 (voxel size = 1.65 × 1.65 × 1.65 mm) on the mCT and
the Vision systems.
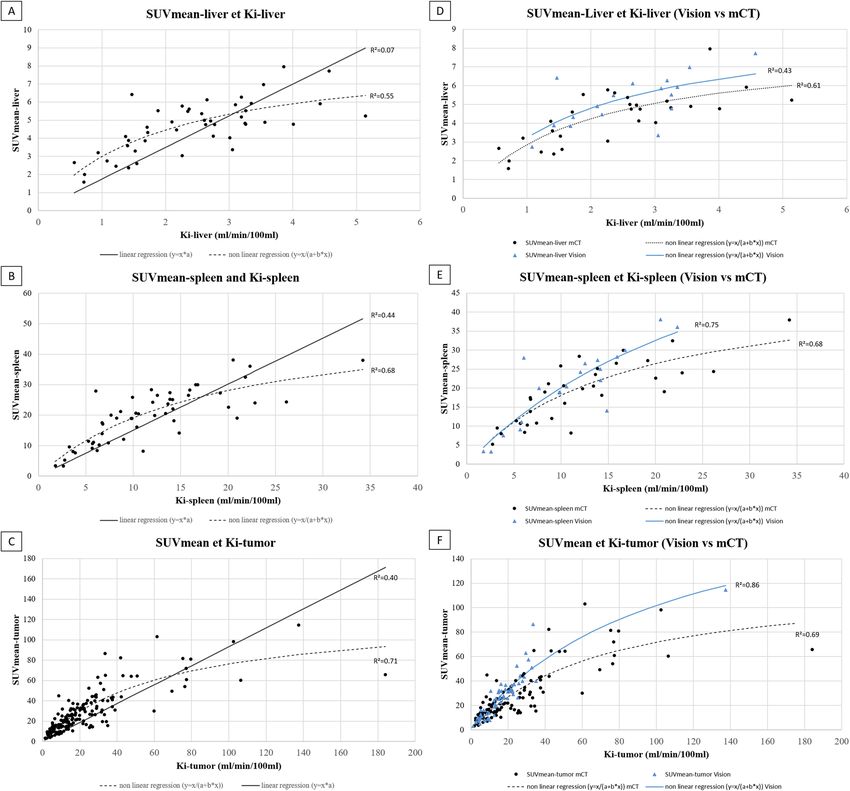
Dynamic whole‑body PET protocol. The DWB PET acquisition was performed (Fig. 1, DWB scan protocol)
according to the methodology previously described by Karakatsanis et al.20.
A single dynamic cardiac-bed (DCB) position acquisition was followed by a DWB cranio-caudal step and
shoot multi-pass acquisition : on the mCT system = 6-min DCB (12 images × 10 s, 12 images × 20 s) + 42-min
DWB (7 passes, 6 min/pass) (Fig. 1); on the Vision system = 6-min DCB (12 images × 5 s, 6 images × 10 s, 8
images × 30 s) + 54-min DWB (9 passes, 6 min/pass).
Static images. On the mCT system, the DWB protocol was followed by a conventional static acquisition. The
PET data were then acquired after the DWB acquisition using a whole-body protocol (2 min per step, 200 × 200
matrix) and were reconstructed using an ordered subsets expectation–maximization (OSEM) algorithm
(TrueX = PSF (point spread function) + TOF (time of flight) OSEM-3D with 4 × 4 × 2 mm voxels.
On the Vision system, the static images were generated by adding the PET raw data from the last 2 dynamic
passes (8th and 9th)20,23.
PET/CT analysis. Quantification of physiological and tumoral tracer uptakes have been analyzed on both
static and dynamic PET images.
Static parameters. Circular regions of interest (ROI) were drawn over a non-invaded part of the liver and
spleen organs to record SUVmax and SUVmean. For that, a 3-cm and a 1-cm diameter circular ROIs in the right
hepatic lobe and in the spleen were respectively used, as previously r ecommended24.
Spherical volumes of interest (VOI) were drawn over each tumor lesions, corresponding to primary location
and/or lymph nodes and/or metastases (up to 5 per patient). Lesions were segmented using a fixed SUV threshold
method delineating a 3D contour around voxels equal to or greater than 40% of SUVmax of the lesion. SUVmax
and SUVmean, defined respectively as the the maximal and mean SUV in the segmented lesion, were recorded.
Mean tumor-to-liver ratio (TLRmean) and tumor-to-spleen ratio (TSRmean), defined as the tumor SUVmean
corrected respectively for the SUVmean in the liver and the spleen, were calculated.
Scientific Reports | (2021) 11:4727 | https://doi.org/10.1038/s41598-021-83965-9 3
Vol.:(0123456789)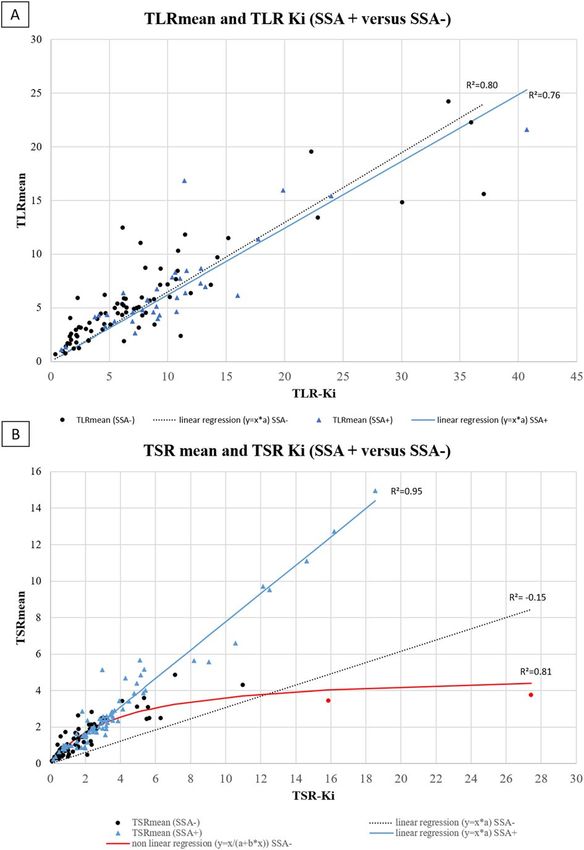
www.nature.com/scientificreports/
Characteristics Patients (n = 61)
Age (years), mean ± Sd 59.3 ± 15.6
Sex (male/female), n 32/29
MEN1, n (%)
Yes 7 (11.5)
No 52 (85.2)
In progress 2 (3.3)
Primary location, n (%)
Foregut 34 (55.7)
Lung 3 (5.0)
Pancreas 30 (49.1)
Duodenum 1 (1.6)
Midgut 21 (34.4)
Small bowel 18 (29.5)
Appendix 1 (1.6)
Caecum 2 (3.3)
Hindgut 2 (3.3)
Rectum 2 (3.3)
Other 1 (1.6)
Unknown 3 (5.0)
Hormonal syndrome, n (%)
No 47 (77)
Yes 14 (23)
Carcinoid syndrome 6 (9.8)
Gastrinoma 3 (5.0)
Insulinoma 2 (3.3)
Glucagonoma 1 (1.6)
VIPoma 1 (1.6)
Hypercalcemia 1 (1.6)
TNM staging, n (%)
T (1/2/3/4/Xa) 5/10/18/6/22
N (0/1/Xa) 16/32/13
M (0/1/Xa) 24/37/0
Grade, n (%)
1 18(38.3)
2 29(61.7)
Unknown
Ki67, n (%; median [IQR]) 5 [2–10]
Past treatment n (%)
Surgery 29 (47.5)
Radiotherapy 1 (1.6)
Systemic treatment 7 (11.5)
Somatostatin analogs 3 (4.9)
Chemotherapy 5 (8.2)
Targeted therapy 1 (1.6)
Locoregional treatment 3 (4.9)
PRRT 0 (0)
Ongoing systemic treatment n (%)
Systemic treatment 20 (32.8)
Somatostatin analogs 19 (31.2)
Chemotherapy 2 (3.3)
Targeted therapy 2 (3.3)
PRRT 2 (3.3)
Table 1. Characteristics of patients. a Not available or unknown.
Scientific Reports | (2021) 11:4727 | https://doi.org/10.1038/s41598-021-83965-9 4
Vol:.(1234567890)
www.nature.com/scientificreports/
Figure 1. Flow chart illustrating the sequence of all dynamic bed frames, as acquired with the step and-shoot
mode during the 2nd phase of the DWB acquisition: 6 unidirectional (cranio-caudal) WB passes are acquired,
each comprised of 7 beds of equal scan duration. The figure was drawn using 2016 Microsoft PowerPoint
application (Microsoft, Germond, WA, United states).
Dynamic parameters. Mean net uptake rate (Ki) values (in ml/min/100 ml) for physiological (Ki-liver, Ki-
spleen) and tumor uptakes (Ki-tumor) were recorded. Tumor-to-liver ratio (TLR-Ki) and tumor-to-spleen ratios
(TSR-Ki), defined as the Ki-tumor corrected for the Ki-liver and the Ki-spleen respectively, were calculated.
Input function. As previously d escribed13, the total radioactivity concentration in the arterial plasma was used
to model the input function (IF). A VOI of 1 cm was drawn as close as possible at the center of the left ventricle
and away from the myocardium to mitigate any partial volume e ffects25 for each image of the DCB. The VOI
was then projected on the DWB images to generate the IF. Theoretically, an arterial blood sample is required to
obtain an IF, but several studies have shown that it can be estimated only from image d ata16,26,27.
An example of IF is illustrated in the Fig. 2.
Ki extraction. On the mCT system, Ki values were calculated on the Excel software (Microsoft, Germond, WA,
United states) from a Patlak graphical analysis of the time-activity curves (TAC). To compute TAC, we applied
liver and spleen ROIs and lesions VOIs previously generate on static images on each pass of the DWB acquisi-
tion. Patlak plots were then calculated from the 3rd to 7th passes of the DWB acquisition (18–48 min). Ki values
were finally deduced by linear regression of the following equation28:
t
CDOTATOC (t) Cp(t)dt
= Ki 0 + Vp (1)
Cp(t) Cp(t)
Vp: volume fraction of plasma in the VOI, Cp: arterial plasma blood concentration and CDOTATOC: tissue
concentration.
An example of TAC and Patlak plot is shown in Fig. 2.
On the Vision system, Ki values were automatically generated on reconstructed Patlak parametric i mages21,22.
Statistical analysis. Relation between static and dynamic parameters in the whole cohort and according to
PET system. A correlation analysis between static and dynamic parameters was also performed. We assessed
the evolution of the SUVmean as a function of the Ki according to two fitting models proposed in the literature:
linear regression16 (SUVmean = A*Ki) and non-linear regression using an inverse hyperbolic fit (SUVmean = Ki/
2 was used to assess the degree at which each model can predict the
(A*Ki + B)). A coefficient of determination R
variance of the measured SUVmean scores using the following definition :
SSres
R2 = 1 − (2)
SStot
Scientific Reports | (2021) 11:4727 | https://doi.org/10.1038/s41598-021-83965-9 5
Vol.:(0123456789)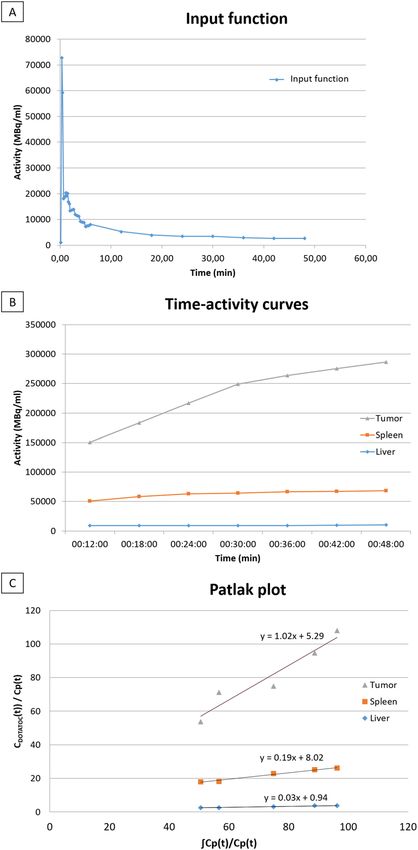
www.nature.com/scientificreports/
Figure 2. Example of dynamic acquisition data processing in a patient with a highly DOTATOC-avid
pancreatic tumor (SUVmax = 159.54 SUVmean 98.29 and Ki = 102.41 ml/min/100 ml) (Top: Input function;
Middle: Time-activity curve; Bottom: Patlak Plot).
SStot is the total sum of squares, which is defined as the sum of squared differences of the measured SUVmean
scores to their mean, and is proportional to the total variance of the SUVmean data. On the other hand, SSres is
the residual sum of squares expressing the variance of the model’s errors and is defined as the sum of the squared
differences (fit residuals) between the fitted SUVmean scores, as predicted from the measured Ki scores according
to each fitted model, and the respective measured SUVmean scores. According to the definition, the coefficient
of determination can have values from − ∞ to 1, thus it can be negative despite its squared notation that may
suggest otherwise. A value of 1 suggests the model’s ability to exactly predict the observed SUVmean data vari-
ance, a value of 0 denotes ability to predict only the mean of the SUVmean scores, while a negative value implies
prediction of scores with larger fitting error variance than the variance of the SUVmean data.
Based on previous studies suggesting that SUV values do not increase when Ki values exceeded 20 ml/min/100
ml13,15, the median value of Ki/SUVmean ratio (KSR) as Ki increased according to the following Ki intervalls
(0–20, 20.1–40, 40.1–60, and > 60 ml/min/100 ml) were first compared using a Kruskal–Wallis test.
To assess the impact of the digital detection on the model on the relation between static and dynamic param-
eters, the median values of physiological/tumoral static (SUVmax, SUVmean) and dynamic (Ki) parameters
according to the type of PET system (analog versus digital) were then compared. A correlation analysis using
linear or non-linear regression according to the results obtained in the whole cohort was also performed.
Scientific Reports | (2021) 11:4727 | https://doi.org/10.1038/s41598-021-83965-9 6
Vol:.(1234567890)www.nature.com/scientificreports/
Parameters Median [IQR]
Physiological
Liver
SUVmax 7.7 [6.4–9.2]
SUVmean 4.8 [3.8–5.7]
Ki (in ml/min/100 ml) 2.5 [1.5–3.2]
Spleen
SUVmax 25.7 [15.4–33.3]
SUVmean 20.5 [11.8–26.5]
Ki (in ml/min/100 ml) 10.6 [6.7–14.9]
Tumoral
SUVmax 39.0 [22.9–60.1]
SUVmean 22.9 [14.8–38.7]
Ki (in ml/min/100 ml) 16.9 [10.1–30]
Ratios
TLRmean 5.3 [3.3–7.2]
TSRmean 1.5 [0.8–2.5]
TLR-Ki 9.2 [6.1–13.1]
TSR-Ki 1.9 [1.0–3.0]
Table 2. Median values of static and dynamic parameters.
Static and dynamic parameters according to cohort characteristics: exploratory analysis. Static and dynamic
parameters were also compared in patients according to their characteristics : histologic grade (G1 vs. G2), Ki67
(< 5% vs. ≥ 5%), primary tumor site (pancreatic versus others) ongoing SSA treatment. A correlation analysis
in subgroup of patients with ongoing SSA treatment (SSA + group) versus no SSA treatment (SSA- group) was
finally performed to assess the influence of a potential competition between the tracer and the treatment on
SSTR.
The significance level of the p-value was 0.05. All statistical analyses were performed using XLStat 2019
(Addinsoft©, Paris, France) and Excel softwares.
Ethics approval and consent to participate. The study was conducted in accordance with the Declara-
tion of Helsinki, Good Clinical Practice, and relevant French regulations regarding ethics and data protection.
Informed consent was obtained from all the patients to participate in the study. The study (NCT03576040) was
approved by our university hospital’s institutional review board (29BRC17.0036).
Consent for publication. All authors contributed to drawing up the manuscript and approved this version.
Results
A total of 175 lesions, comprising 1, 2, 3, 4 and 5 lesions in respectively 22 (36%), 7 (11.5%), 8 (13.1%), 5 (8.2%)
and 19 (31.2%) patients, were segmented. Of the 61 patients, 48 had a sufficient part of healthy liver tissue allow-
ing an analysis of physiological hepatic uptake. The study of physiological spleen uptake was not possible in 6
patients who had previously undergone a splenectomy.
Static and dynamic parameters in the whole cohort and according to PET system. The median
values of the physiological, tumoral and ratio in static and dynamic 68Ga-DOTATOC-PET/CT parameters are
shown in Table 2. The median values of SUVmax-liver and SUVmean-liver were respectively 7.7 [IQR, 6.4–9.2]
and 4.8 [IQR, 3.8–5.7]. The median values of SUVmax-spleen and SUVmean-spleen were respectively 25.7 [IQR,
15.4–33.3] and 20.5 [IQR, 11.8–26.5]. The median values of Ki-liver and Ki-spleen were respectively 2.5 ml/
min/100 ml [IQR, 1.5–3.2] and 10.6 ml/min/100 ml [IQR, 6.7–14.9]. The median values of SUVmax-tumor
and SUVmean-tumor were respectively 39 [IQR, 22.9–60.1] and 22.9 [IQR, 14.8–38.7]. The median values of
Ki-tumor was 16.9 ml/min/100 ml [IQR, 10.1–30.0]. The median values of TLR-Ki and TSR-Ki were higher than
TLRmean and TSRmean (9.2 [IQR, 6.1–13.1] versus 5.3 [IQR, 3.3–7.2]; and 1.9 [IQR, 1–3] versus 1.5 [IQR,
0.8–2.5] (p < 0.001 both), respectively).
The median value of KSR was 0.65 [IQR, 0.52–0.93] with a wide range of values from 0.19 to 2.79. The KSR
median value increased significantly when Ki also increased (p < 0.001). (Fig. 3).
According to PET system, the median value of SUVmax-liver was significantly higher in the Vision PET
system group than in the mCT PET system group (8.3 [IQR, 7.6–9.8] vs 7.4 [IQR, 6.1–8.8], p = 0.027) (Table 3).
There was no difference between the others static and dynamic parameters according to the 2 PET systems
(Tables 3, 4).
Scientific Reports | (2021) 11:4727 | https://doi.org/10.1038/s41598-021-83965-9 7
Vol.:(0123456789)www.nature.com/scientificreports/
Figure 3. KSR evolution according to Ki intervalls (0–20, 20.1–40, 40.1–60, and > 60 ml/min/100 ml). KSR was
defined as the ratio between Ki-tumor to SUVmean-tumor (KSR).
Parameters SUVmax (median [IQR]) SUVmean (median [IQR]) Ki (in ml/min/100 ml) (median [IQR])
Liver
PET system
mCT 7.4 [6.1–8.8] 4.8 [3.3–5.3] 2.4 [1.4–3.0]
Vision 8.3 [7.6–9.8] 5.5 [4.3–6.1] 2.7 [1.7–3.3]
p-value 0.027 0.060 0.357
SSA therapy
SSA+ 4.7 [4.4–6.9] 2.7 [2.4–3.7] 1.3 [0.8–1.5]
SSA− 8.1 [7.3–9.3] 5.0 [4.4–5.9] 2.7 [2.2–3.3]
p-value 0.001 0.002 < 0.001
Spleen
PET system
mCT 24.8 [14.9–32.4] 19.9 [11.8–25.5] 10.4 [6.7–15.8]
Vision 26.6 [18.4–34.5] 21.3 [13.4–27.5] 11.3 [6.0–14.4]
p-value 0.687 0.605 0.769
SSA therapy
SSA+ 12.8 [10.5–15.5] 9.9 [8.1–11.4] 5.7 [3.7–6.8]
SSA− 29.6 [24.8–34.8] 24.3 [19.9–28] 13.9 [10.3–17.9]
p-value < 0.001 < 0.001 < 0.001
Table 3. Median values of physiological parameters according to PET system and SSA therapy. Bold
characters corresponded to p valuewww.nature.com/scientificreports/
Parameters SUVmax (median [IQR]) SUVmean (median [IQR]) Ki (in ml/min/100 ml) (median [IQR])
Tumor
PET system
mCT (n = 39) 36.5 [22.8–58.4] 22.1 [14.2–39.1] 17.9 [10.6–32.9]
Vision (n = 22) 42.3 [32.3–64.6] 25.3 [19.2–38.1] 15.3 [10.0–24.0]
p-value 0.599 0.702 0.323
Embryologic origin
Foregut (n = 34) 50.6 [36.3–85.1] 30.6 [21.2–49.4] 26.3 [13.4–34.7]
Midgut (n = 21) 22.4 [17.9–43.6] 13.7 [10.5–26.4] 9.6 [5.0–16.1]
p-value < 0.001 < 0.001 < 0.001
Histologic grade
1 (n = 18) 44.2 [27.3–58.3] 26.7 [16.2–39.3] 19.0 [9.8–32.0]
2 (n = 29) 36.5 [22.7–53.7] 22.1 [13.7–31.0] 16.4 [9.9–24.5]
p-value 0.511 0.525 0.620
SSA therapy
SSA+ (n = 19) 33.2 [22.5–44.2] 20.2 [13–26.7] 12.6 [8.4–17.6]
SSA− (n = 42) 43.1 [26.6–71.2] 27.8 [16–40.3] 20.1 [11.7–33.0]
p-value 0.083 0.0977 0.027
Table 4. Median values of tumoral parameters according to the cohort characteristics. Bold characters
corresponded to p valuewww.nature.com/scientificreports/
Figure 4. Correlation between SUVmean and Ki for physiological and tumoral uptakes in the whole cohort and
according to PET system.
Parameters Linear regression Non-linear regression
Physiological
Liver
Ki-mean/SUVmean 0.07 0.55
Spleen
Ki-mean/SUVmean 0.44 0.68
Tumoral
Ki-mean/SUVmean 0.40 0.71
Ratios
TLR-Ki/TLRmean 0.75 0.79
TSR-Ki/TSRmean 0.63 0.76
Table 5. Coefficient of determination (R2) between static and dynamic parameters using a linear and a non-
linear regression.
Scientific Reports | (2021) 11:4727 | https://doi.org/10.1038/s41598-021-83965-9 10
Vol:.(1234567890)www.nature.com/scientificreports/
Figure 5. Correlation between TLRmean/TLR-Ki and TSRmean/TSR-Ki in the whole cohort and according to
PET system. *Red circle correspond to the 2 bones lesions of patient 58.
that the Ki may be a more robust and reproducible parameter especially for the liver uptake graduation that
represent a reference in current practice for the quantification of SSTR expression by NETs. No other data are
currently available in the literature on the comparison of DWB 68Ga-DOTATATE PET/CT acquisition according
to different PET systems.
Then, we analysed the tumoral uptake and the correlation between SUVs and Ki values as already investigated
in other studies, but in smaller cohorts of patients with divergent conclusions. In two studies conducted by the
same team, authors concluded to a non-linear relationship between the SUV and Ki-tumor values recorded on
both dynamic single-bed 68Ga-DOTATOC and 68Ga-DOTATATE PET/CT in patients with metastatic NET/
NECs13,15 So, Velikyan et al. hypothesized that beyond a Ki > 20 ml/min/100 ml, SUV values did not increase.
On the contrary, in a study including 20 patients with metastatic NETs who underwent a dynamic single-bed
68
Ga-DOTATOC PET/CT acquisition before PRRT, Van Binnebeek et al. reported a linear relationship between
Ki and SUVmean ( R2 = 0.77). Nevertheless, the non-linear regression was not considered in the m ethodology16.
In our study, we tested these two approachs to assess the relationship between static and dynamic parameters.
First, we investigated the KSR according to the Ki value and showed that its median value increased significantly
when Ki was higher than 20 ml/min/100 ml (p < 0.001). Then, we highlighted that a non-linear regression was
more consistent to fit the relationship between SUVmean and Ki-tumor ( R2 = 0.71 versus 0.40 using a linear
regression), but also for the liver and spleen uptakes. Thereby, our findings are more in line with those found by
Velikyan et al. and Ilan et al., even if our coefficient of determination was slightly lower but remaining h igh13,15.
Performing the correlation analysis with only one lesion per patient (lesion with the highest Ki value), the results
remained similar (supplemental Fig. 1). According to PET system, we highlighted that non-linear regression was
also consistent to fit the relationship in both PET systems (R2 = 0.69 and R2 = 0.86 in analog and Vision system,
respectively). These results support the hypothesis suggesting that the SUV only partially reflects the SSTR density
in highly expressing SSTR tumors and may lead to an underestimation.
One hypothesis to explain this phenomenon of non-linear correlation is that the bioavailability of the peptide
in plasma could be a limiting factor for radiotracer uptake in patients with high tumor burden and high expres-
sion of SSTR due to the “sink effect”29. In this situation, a rapid plasma clearance of the radiotracer is observed
resulting in a low concentration of plasma activity. Then, the “sink effect” will result in apparent saturation of the
SUV values14, unlike those of the Ki since plasma concentrations are taken into account for its calculation. Thus,
Ilan et al. evaluated this concept on the assumption that the tumor-to-blood ratio (TBR) may be a better static
parameter to assess the expression of SSTRs. Thereby, they showed an excellent correlation ( R2 = 0.98) between
Scientific Reports | (2021) 11:4727 | https://doi.org/10.1038/s41598-021-83965-9 11
Vol.:(0123456789)www.nature.com/scientificreports/
Figure 6. Correlation between SUVmean and Ki for physiological and tumoral uptakes according to SSA
treatment.
tumor Ki and TBR values with a linear regression. The authors concluded that TBR better reflected the density
of SSTR than the SUV alone and therefore could be the optimal measurement tool for the semi-quantitative
assessment of tumor uptake of 68Ga-DOTATOC and 68Ga-DOTATATE15. In our method, we did not assess this
TBR approach. However, we used the liver and spleen uptakes as references to calculate both static and dynamic
TLR and TSR ratios. Regarding the correlation between TLRmean and TLR-Ki, the relationship appeared also
linear (R2 = 0.75) in our cohort and the results were not difference in both PET systems. On the contrary, we found
discordant results fitting the relationship between TSRs ratios with slightly higher correlation with a non-linear
regression model than with the linear one ( R2 = 0.76 versus 0.63, respectively). Using linear regression model
according to PET system, we observed that TSRmean and TSR-Ki exhibited a strong correlation in the digital
PET system subgroup (R2 = 0.94) but not in the mCT (R2 = 0.04). These discrepancy results are mainly explained
by the profile of a 51-years-old female patient belonging to the mCT subgroup. Indeed, we observed very low
TSRmean values but high corresponding TSR-Ki values in this patient, that have probably affected the correlation
analysis (Fig. 5D). A potential explanation could be related to the associated treatment scheme. Indeed, this was
the only patient treated with a targeted-therapy (everolimus) and without SSA treatment at the time of PET/CT
Scientific Reports | (2021) 11:4727 | https://doi.org/10.1038/s41598-021-83965-9 12
Vol:.(1234567890)www.nature.com/scientificreports/
Figure 7. Correlation between TLRmean/TLR-Ki and TSRmean/TSR-Ki according to SSA treatment. *Red
circle correspond to the 2 bones lesions of patient 58.
acquisition. To our hypothesis, this treatment scheme may have a greater impact on the SUVmean-tumor than on
the Ki-tumor value, as the associated anti-angiogenic effect may lead to a significant decrease in TSRmean but not
in TSR-Ki. Another explanation is that the two lesions with the highest discrepancy results were bone metastases
which could have a particular biodistribution pattern. Retrospectively, in excluding this patient from the cor-
relation analysis, we finally found a significant higher coefficient of determination R2 with the linear regression
model, increasing from 0.04 to 0.84 (supplementary Fig. 2). Consequently, we think that the interpretation of the
SUV value in 68Ga-DOTATOC-PET/CT should be particularly careful and recommend further explorations in
the comparison of static and dynamic quantitative approaches for the therapeutic response assessment in patients
treated with everolimus. In summary, our results are supporting a non-linear relationship between SUVmean
and Ki parameter and a linear relationship between TLRmean/TSRmean and TSR-Ki/TSRmean. We also found
that these relationship seems not affected by the PET system used even if R2 appear slighty lower in analog versus
digital PET system. That could be explained by their different intrinsic performances, the difference in our DWB
acquisition protocol (i.e. step and shoot acquisition for mCT and continuous bed motion for Vision) and finally
due to the difference between Ki calculation according to the two PET systems.
To assess if DWB acquisition can provide additional information in patients with WD-NETs, we also per-
formed a preliminary analysis according to our cohort characteristics. Our results showed that SUV or Ki
values were not statistically different in patients with G1 versus G2 NETs (or with Ki-67% ≥ 5% versus < 5%).
These results are consistent with the literature. Indeed, some studies showed that SUVmax values were inversely
correlated with Ki-67 expression and tumor grade when including both NETs and NECs (G1/G2 versus G3).
However, this correlation does not exist when comparing only G1 and G2 NETs. In a retrospective study involving
126 patients with a gastroenteropancreatic NET undergoing a 68Ga-DOTATATE PET/CT, mean SUVmax values
were significantly lower in G3 (12.8 ± 12.3) than in G1/G2 sub-groups (29.2 ± 28.6 and 26.0 ± 16.2, respectively;
p < 0.05)30. In a study including 49 patients with a pancreatic NETs/NECs, Partelli et al. found median SUVmax
values in 68Ga-DOTANOC-PET/CT even higher in the G2 than in the G1 sub-groups (53.5 and 31.5 respectively),
while the median SUVmax value was 16.5 in the G3 pancreatic NETs s ubgroup31. In our cohort, the Ki-tumor
values followed the same trends and therefore did not appear to be more discriminating. In our per-primary
tumor origin analysis, patients with p-NET had significantly higher SUVs and Ki values compared to patients
with si-NETs (p < 0.001) that was already suggested in the literature by Campana et al.32 and O’Toole et al.33.
According to SSA treatment, we found that both static and dynamic physiological uptake, decreased with the
presence of an ongoing SSA treatment which is consistent with the literature data. Indeed, in a recent series of
Scientific Reports | (2021) 11:4727 | https://doi.org/10.1038/s41598-021-83965-9 13
Vol.:(0123456789)www.nature.com/scientificreports/
21 patients with metastatic NETs undergoing 68Ga-DOTATATE PET/CT before and after SSA initiation, mean
splenic and hepatic SUVmax decreased significantly between the two scans from 30.3 to 23.1 and 10.3 to 8.0
(p < 0.0001), respectively34. In our cohort, Ki-liver and Ki-spleen values appeared to follow the same trend with
SUV parameters. Regarding our correlation analysis, we found that R 2 values in SSA- patients were lower for
2
liver and spleen uptakes using a non linear regression while R were comparable between SSA+ and SSA− groups
for tumor uptake (R2 = 0.63 and 0.72), respectively. Regarding TLR ratios and using a linear regression, R2 were
comparable between SSA+ and SSA− while we found a high discrepancy result for TSR ratios ( R2 = 0.95 versus
0.15, respectively). As for mCT subgroup analysis, these results are also partially explained by the patient treated
with everolimus (see above and supplementary Fig. 2).
To our knowledge, this is the first prospective study assessing a whole-body dynamic 68Ga-DOTATOC-PET/
CT acquisition that makes possible to measure the Ki values for all the lesions included in the field of view. This
offers interesting perspectives in terms of diagnostic, prognostic and therapeutic evaluation in NETs, which are
tumors with a high prevalence of metastatic disease at the time of diagnosis.
Our study presents several limitations. Firstly, our cohort is monocentric and our population is heterogene-
ous, including patients with localized and metastatic NETs from different primary origins and with different
ongoing treatments. Secondly, we did not perform arterial blood samples to adjust our input function. Neverthe-
less, several study showed that the input function can be determinated non invasively within different validated
methods16,35. To our mind, DWB acquisition needs to remain as minimally invasive as possible to be implemented
in clinical routine. Finally, we used the left ventricular VOI in our study to assess the input function. Using the
descending thoracic aorta to generate the IF as previously r eported13–15 could have been a better option. Thus,
we retrospectively performed a supplementary work on 17 other control patients included in the GAPETNET
study, who underwent the DWB acquisition on the PET Vision system. And we did not found any significant
difference in Ki values whatever the IF estimation method (left ventricular vs descending aorta VOI) and the
Patlak analysis (automated vs graphical) used (supplemental Table 1).
In conclusion, our study is the first study showing the feasibility of a DWB acquisition in 68Ga-DOTATOC-
PET/CT in both analog and digital PET systems. The comparison of the parameters obtained on the two PET
systems suggests that Ki may be a more robust parameter especially for assessing liver uptake. Our findings
confirm that the correlation between the tumoral SUVmean and Ki values follows a non-linear relationship as
already described in previous studies. Our exploratory analysis suggests that combining SUV-derived with Ki-
derived metrics could lead to a better characterization of the physiological and tumoral tracer uptake, providing
in-vivo additional quantitative value in the characterization of SSTR expression in WD-NETs. Future results
of our prospective prognostic trial will surely allow us to better understand the behavior of the WD-NETs and
their biological environment with Ki values.
Data availability
The datasets analysed during the current study are available from the corresponding author on reasonable request.
Received: 6 November 2020; Accepted: 4 February 2021
References
1. Krenning, E. P. et al. Somatostatin receptor scintigraphy with [111In-DTPA-D-Phe1]- and [123I-Tyr3]-octreotide: The Rotterdam
experience with more than 1000 patients. Eur. J. Nucl. Med. 20, 716–731 (1993).
2. Barrio, M. et al. The impact of somatostatin receptor-directed PET/CT on the management of patients with neuroendocrine tumor:
A systematic review and meta-analysis. J. Nucl. Med. 58, 756–761 (2017).
3. Graham, M. M., Gu, X., Ginader, T., Breheny, P. & Sunderland, J. J. 68Ga-DOTATOC imaging of neuroendocrine tumors: A
systematic review and metaanalysis. J. Nucl. Med. 58, 1452–1458 (2017).
4. Zaidi, H. & Karakatsanis, N. Towards enhanced PET quantification in clinical oncology. Br. J. Radiol. 91, 20170508 (2017).
5. Olsen IH, Langer SW, Federspiel BH, Oxbøl J, Loft A, Berthelsen AK, et al. 68Ga-DOTATOC PET and gene expression profile
in patients with neuroendocrine carcinomas: strong correlation between PET tracer uptake and gene expression of somatostatin
receptor subtype 2. Am. J. Nucl. Med. Mol. Imaging. 6, 59–72 (2016).
6. Haug, A. R. et al. Quantification of immunohistochemical expression of somatostatin receptors in neuroendocrine tumors using
68Ga-DOTATATE PET/CT. Radiologe. 50, 349–354 (2010).
7. Koch, W. et al. Treatment with octreotide in patients with well-differentiated neuroendocrine tumors of the ileum: Prognostic
stratification with Ga-68-DOTA-TATE positron emission tomography. Mol. Imaging. 13, 1–10 (2014).
8. Sharma, R. et al. 68Ga-DOTATATE PET/CT parameters predict response to peptide receptor radionuclide therapy in neuroen-
docrine tumours. Radiother. Oncol. 141, 108–115 (2019).
9. Gabriel, M. et al. 68Ga-DOTA-Tyr3-octreotide PET for assessing response to somatostatin-receptor–mediated radionuclide therapy.
J. Nucl. Med. 50, 1427–1434 (2009).
10. Haug, A. R. et al. 68Ga-DOTATATE PET/CT for the early prediction of response to somatostatin receptor-mediated radionuclide
therapy in patients with well-differentiated neuroendocrine tumors. J. Nucl. Med. 51, 1349–1356 (2010).
11. Kratochwil, C. et al. SUV of [68Ga]DOTATOC-PET/CT predicts response probability of PRRT in neuroendocrine tumors. Mol.
Imaging Biol. 17, 313–318 (2015).
12. Rahmim, A. et al. Dynamic whole-body PET imaging: Principles, potentials and applications. Eur. J. Nucl. Med. Mol. Imaging. 46,
501–518 (2019).
13. Velikyan, I. et al. Quantitative and qualitative intrapatient comparison of 68Ga-DOTATOC and 68Ga-DOTATATE: Net uptake
rate for accurate quantification. J. Nucl. Med. 55, 204–210 (2014).
14. Ilan, E. et al. Parametric net influx rate images of 68 Ga-DOTATOC and 68 Ga-DOTATATE: Quantitative accuracy and improved
image contrast. J. Nucl. Med. 58, 744–749 (2017).
15. Ilan, E., Velikyan, I., Sandström, M., Sundin, A. & Lubberink, M. Tumor-to-blood ratio for assessment of somatostatin receptor
density in neuroendocrine tumors using 68Ga-DOTATOC and 68Ga-DOTATATE. J. Nucl. Med. 61, 217–221 (2020).
16. Van Binnebeek, S. et al. Dynamic 68Ga-DOTATOC PET/CT and static image in NET patients. Correlation of parameters during
PRRT. Nuklearmedizin. 55, 104–114 (2016).
Scientific Reports | (2021) 11:4727 | https://doi.org/10.1038/s41598-021-83965-9 14
Vol:.(1234567890)www.nature.com/scientificreports/
17. Faggiano, A. et al. Natural history of gastro-entero-pancreatic and thoracic neuroendocrine tumors. Data from a large prospective
and retrospective Italian epidemiological study: The NET management study. J. Endocrinol. Investig. 35, 817–823 (2012).
18. Karakatsanis, N. A. et al. Dynamic whole-body PET parametric imaging: I. Concept, acquisition protocol optimization and clinical
application. Phys. Med. Biol. 58, 7391–7418 (2013).
19. Karakatsanis, N. A., Lodge, M. A., Zhou, Y., Wahl, R. L. & Rahmim, A. Dynamic whole-body PET parametric imaging: II. Task-
oriented statistical estimation. Phys. Med. Biol. 58, 7419–7445 (2013).
20. Karakatsanis, N. A. et al. Generalized whole-body Patlak parametric imaging for enhanced quantification in clinical PET. Phys.
Med. Biol. 60, 8643–8673 (2015).
21. Karakatsanis, N. A., Casey, M. E., Lodge, M. A., Rahmim, A. & Zaidi, H. Whole-body direct 4D parametric PET imaging employ-
ing nested generalized Patlak expectation-maximization reconstruction. Phys. Med. Biol. 61, 5456–5485 (2016).
22. Hu, J. et al. Design and implementation of automated clinical whole body parametric PET with continuous bed motion. Trans.
Radiat. Plasma Med. Sci. 696–707 (2020).
23. Karakatsanis, N., Casey, M., Knešaurek, K., Fayad, Z., & Kostakoglu, L. SUV/Patlak-4D whole-body PET/CT dynamic and para-
metric imaging: clinical demonstration and validation of SUV synthesis from dynamic passes. In 2017 IEEE Nuclear Science
Symposium and Medical Imaging Conference (NSS/MIC) (2017).
24. Thuillier, P. et al. Clinical assessment of 177Lu-DOTATATE quantification by comparison of SUV-based parameters measured
on both post-PRRT SPECT/CT and 68Ga-DOTATOC PET/CT in patients with neuroendocrine tumors: A feasibility study. Clin.
Nucl. Med. 46, 111–118 (2021).
25. Chen, K. et al. Noninvasive quantification of the cerebral metabolic rate for glucose using positron emission tomography,
18F-fluoro-2-deoxyglucose, the Patlak method, and an image-derived input function. J. Cereb. Blood Flow Metab. 18, 716–723
(1998).
26. Henze, M. et al. PET imaging of somatostatin receptors using [68GA]DOTA-D-Phe1-Tyr3-octreotide: First results in patients
with meningiomas. J. Nucl. Med. 42, 1053–1056 (2001).
27. Koukouraki, S. et al. Comparison of the pharmacokinetics of 68Ga-DOTATOC and [18F]FDG in patients with metastatic neu-
roendocrine tumours scheduled for 90Y-DOTATOC therapy. Eur. J. Nucl. Med. Mol. Imaging. 33, 1115–1122 (2006).
28. Patlak, C. S., Blasberg, R. G. & Fenstermacher, J. D. Graphical evaluation of blood-to-brain transfer constants from multiple-time
uptake data. J. Cereb. Blood Flow Metab. 3, 1–7 (1983).
29. Beauregard, J.-M., Hofman, M. S., Kong, G. & Hicks, R. J. The tumour sink effect on the biodistribution of 68Ga-DOTA-octreotate:
Implications for peptide receptor radionuclide therapy. Eur. J. Nucl. Med. Mol. Imaging. 39, 50–56 (2012).
30. Yu, J. et al. The correlation between [68Ga]DOTATATE PET/CT and cell proliferation in patients with GEP-NENs. Mol. Imaging
Biol. 21, 984–990 (2019).
31. Partelli, S. et al. The role of combined 68Ga-DOTANOC and 18FDG PET/CT in the management of patients with pancreatic neu-
roendocrine tumors. Neuroendocrinology 100, 293–299 (2014).
32. Campana, D. et al. Standardized uptake values of 68Ga-DOTANOC PET: A promising prognostic tool in neuroendocrine tumors.
J. Nucl. Med. 51, 353–359 (2010).
33. O’Toole, D. et al. The analysis of quantitative expression of somatostatin and dopamine receptors in gastro-entero-pancreatic
tumours opens new therapeutic strategies. Eur. J. Endocrinol. 155, 849–857 (2006).
34. Cherk, M. H., Kong, G., Hicks, R. J. & Hofman, M. S. Changes in biodistribution on 68Ga-DOTA-octreotate PET/CT after long
acting somatostatin analogue therapy in neuroendocrine tumour patients may result in pseudoprogression. Cancer Imaging. 18,
3 (2018).
35. Ohtake, T. et al. Noninvasive method to obtain input function for measuring tissue glucose utilization of thoracic and abdominal
organs. J. Nucl. Med. 32, 1432–1438 (1991).
Author contributions
Each author has contributed to the submitted work as follows: V.K., P.Y.S., R.A. are the guarantors of the paper.
P.T., D.B., N.K., R.A. designed the study. P.T. realized statistics. J.P.M., K.A. ensured the follow-up of patients.
F.B.B., S.H. ensured the preparation of radiotracer. P.T., N.K., R.A. drafted the manuscript. P.T., D.B., R.A. did
the interpretation of data. V.K., P.Y.S., R.A., N.K., R.L.P., U.S. revised the manuscript for intellectual content.
Funding
This research did not receive any specific grant from any funding agency in the public, commercial or not-for-
profit sector.
Competing interests
The authors declare no competing interests.
Additional information
Supplementary Information The online version contains supplementary material available at https://doi.
org/10.1038/s41598-021-83965-9.
Correspondence and requests for materials should be addressed to P.T.
Reprints and permissions information is available at www.nature.com/reprints.
Publisher’s note Springer Nature remains neutral with regard to jurisdictional claims in published maps and
institutional affiliations.
Open Access This article is licensed under a Creative Commons Attribution 4.0 International
License, which permits use, sharing, adaptation, distribution and reproduction in any medium or
format, as long as you give appropriate credit to the original author(s) and the source, provide a link to the
Creative Commons licence, and indicate if changes were made. The images or other third party material in this
article are included in the article’s Creative Commons licence, unless indicated otherwise in a credit line to the
material. If material is not included in the article’s Creative Commons licence and your intended use is not
permitted by statutory regulation or exceeds the permitted use, you will need to obtain permission directly from
the copyright holder. To view a copy of this licence, visit http://creativecommons.org/licenses/by/4.0/.
© The Author(s) 2021
Scientific Reports | (2021) 11:4727 | https://doi.org/10.1038/s41598-021-83965-9 15
Vol.:(0123456789)You can also read