Public Comment Period for Revisions to the Michigan State Implementation Plan
←
→
Page content transcription
If your browser does not render page correctly, please read the page content below

Public Comment Period for Revisions to the Michigan State
Implementation Plan
The Michigan Department of Environment, Great Lakes, and Energy (EGLE) opened a
public comment period for revisions to the Michigan State Implementation Plan (SIP) on
May 17, 2021, which will remain open until 9:00 p.m. EDT on June 30, 2021. The
purpose of the public comment period and virtual public hearing, if requested, are to
allow all interested parties an opportunity to comment on the proposed SIP revision.
Proposed SIP Revision:
State Implementation Plan Submittal for Regional Haze Second
Planning Period.
In the proposed SIP revision, EGLE is demonstrating compliance with the
requirement for an updated Regional Haze plan to comply with the Clean
Air Act.
The public is encouraged to review the proposed SIP revision and present comments
through the end of the public comment period. All statements received during the public
comment period will be considered by the Air Quality Division (AQD) prior to submitting
the SIP revision to the United States Environmental Protection Agency. Once all
comments are considered, EGLE may submit the SIP revision as written, submit it with
minor changes, or make major changes that require an additional public comment
period.
Submitting Comments:
There are several ways to submit comments on the proposed SIP revisions.
Email your comment to irviner@michigan.gov. Please include “Comments
on SIP Revision” in the subject line.
Mail your comment to Robert Irvine, EGLE, Air Quality Division, SIP
Development Unit, P.O. Box 30260, Lansing, Michigan 48909-7760.
At a public hearing, if held.
If requested in writing by June 8, 2021, a virtual public hearing will be held on June
15, 2021 at 6:00 p.m., with information on how to attend posted on the AQD’s
webpage at Michigan.gov/Air. If requested, the virtual public hearing will be
preceded by an informational session.
NOTE: The comment period deadline was extended from June 15th to June 30th
per a request.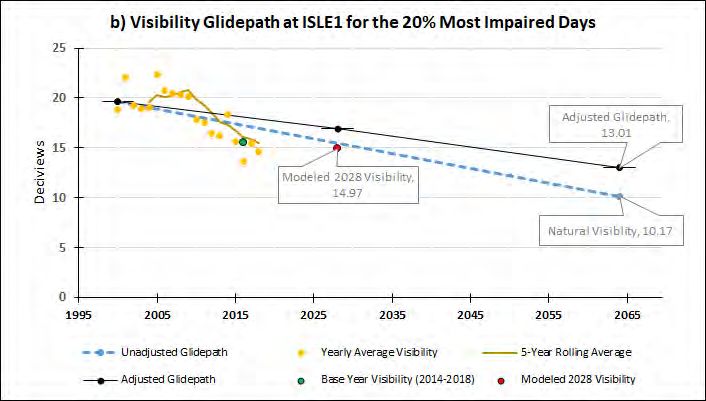
Individuals without internet access and who are interested in receiving printed copies of
    the documents related to the proposed SIP revision or who need accommodations or
    other assistance to effectively participate in the hearing should contact Lorraine
    Hickman at 517-582-3494 or HickmanL@michigan.gov.

    This public notice is given in accordance with federal regulations for the SIP.

NOTE: The Department of Environment, Great Lakes, and Energy (EGLE) has closed its offices and other
facilities to visits from the public to help mitigate the spread of COVID-19. Necessary public
meetings/hearings will be postponed to the extent possible or held virtually. When held virtually, every attempt
will be made to accommodate and include individuals from diverse groups, including, but not limited to
translation for those with limited English proficiency and provide call in numbers for those without internet
access. Other options will also be considered on a case-by-case basis.

     Michigan’s Environmental Justice Policy promotes the fair, non-discriminatory treatment and meaningful involvement of Michigan’s
      residents regarding the development, implementation, and enforcement of environmental laws, regulations, and policies by this
      state. Fair, non-discriminatory treatment intends that no group of people, including racial, ethnic, or low-income populations, will
     bear a disproportionately greater burden resulting from environmental laws, regulations, policies, and decision-making. Meaningful
    involvement of residents ensures an appropriate opportunity to participate in decisions about a proposed activity that will affect their
                                                          environment and/or health.
Michigan Department of Environment, Great Lakes, and Energy
Air Quality Division
STATE IMPLEMENTATION PLAN SUBMITTAL
FOR
REGIONAL HAZE
SECOND PLANNING PERIOD
Michigan Department Environment, Great Lakes, and Energy
Air Quality Division
P.O. Box 30260
Lansing, Michigan 48909-7760
http://www.michigan.gov/air
May 2021Table of Contents
Page
List of Acronyms ..................................................................................................................... ii-iv
Executive Summary ................................................................................................................... 1
1 Introduction.................................................................................................................. 2
1.1 General Background .................................................................................................... 2
1.2 Michigan’s Regional Haze Class 1 Areas .................................................................... 2
1.3 EGLE’s Reasonable Approach – 2018-2028 Planning Period...................................... 3
2 Specific Components of the SIP .................................................................................. 6
Figure 1 Visibility Trends at Class 1 Areas in the LADCO Region ............................................ 6
Figure 2 Visibility Glidepath at Isle Royale for the 20% Most Impaired Days ...........................23
Figure 3 Visibility Glidepath at Seney for the 20% Most Impaired Days ..................................23
Figure 4 Source Region Contribution to Visibility in Class 1 Areas on the 20% Most Impaired
Days..........................................................................................................................26
Table 1 Natural Conditions, 2000-2004 baseline visibility, observed 2014-2018 visibility,
2028 projected visibility, and 2028 unadjusted glidepath value on the 20% most impaired
days, at Isle Royale and Seney Class 1 areas ........................................................................... 7
Table 2 Natural conditions, 2000-2004 baseline visibility, observed 2014-2018 visibility, 2028
projected visibility, and 2028 unadjusted glidepath value on the 20% Cleanest days at Isle
Royale and Seney Class 1 areas ............................................................................................... 7
Table 3 Source Apportionment Modeling Results – Upper Midwest .......................................... 8
Table 4 Base and future year deciview values on the 20% most impaired days at Class 1 areas
within the LADCO region for the base model period (2014-2018) and future year (2028) and
compared to 2000-2004 conditions ...........................................................................................24
Table 5 Base and future year deciview values on the 20% clearest days at Class 1 areas within
the LADCO region for the base model period (2014-2018) and future year (2028) and compared
to 2000-2004 conditions ............................................................................................................25
Appendix A – LADCO Modeling and Data Analysis TSD
Appendix B – Point source inventory components used for the 2016 alpha Q/d analysis
Appendix C – MANE-VU 2017 letter to upwind states
Appendix D – Public and FLM Comments and EGLE responses
iLIST OF ACRONYMS
Acronym Description
AFGD Advanced flue gas desulfurization
AOI Area of influence
ASOA Anthropogenic secondary organic aerosol
AQD Air Quality Division
B20% Best 20 percent (days of visibility)
BACT Best Available Control Technology
BART Best Available Retrofit Technology
BC Boundary conditions
Bext Light extinction
BOWA, Boundary Waters Canoe Area Wilderness
BWCA
BSOA Biogenic secondary organic aerosol
CAA Clean Air Act
CAIR Clean Air Interstate Rule
CALPUFF California Puff Model
CAMR Clean Air Mercury Rule
CAMx Comprehensive Air Quality Model with extensions
CEED Center for Energy and Economic Development
CENRAP Central Regional Air Planning Association
CFR Code of Federal Regulations
CM Coarse mass
CMAQ Community Multiscale Air Quality Modeling System
Commission Grand Canyon Visibility Transport Commission
DAA Dry absorption addition
DSI Dry Sorbent Injection
EC Elemental carbon
ECR EC/R Incorporated consulting firm
EFGR External flue gas recirculation
EGU Electric generating unit
EIMP Empire Iron Mining Partnership
ENVIRON ENVIRON International Corporation
EPA United States Environmental Protection Agency
EPC Escanaba Paper Company
FGD Flue gas desulfurization
f(RH) Relative Humidity adjustment factor
FLM Federal Land Manager
FPRM Primary particulate (i.e., soil, crustal and metals)
FS Forest Service
FWS Fish and Wildlife Service
HAPs Hazardous Air Pollutants
ICI Institutional, commercial, and industrial
IDF Indirect firing system
IFGR Induced flue gas recirculation
IMPROVE lnteragency Monitoring of Protected Visual Environments
1PM Integrated Planning Model
ISLE1 Isle Royale National Park
iiAcronym Description
LADCO Lake Michigan Air Directors Consortium
LNB Low NOx Burner
LTO Low temperature oxidation
km kilometers
LTS Long-term strategy
MACT Maximum Achievable Control Technology
MANE-VU Mid-Atlantic, Northeast Visibility Union
MARAMA Mid-Atlantic Regional Air Management Association
DNRE Michigan Department of Natural Resources and Environment
MDOT Michigan Department of Transportation
Mm-1 Inverse Megameters
MM5 Mesoscale Meteorological Model, 5th Generation (developed by
Pennsylvania State University / National Center for Atmospheric
Research PSU/NCAR)
MMBtu Million British thermal units
MOBILE6 MOBILE Vehicle Emission Modeling Software Version 6
MPCA Minnesota Pollution Control Agency
MRPO Midwest Regional Planning Organization
NAAQS National Ambient Air Quality Standards
NEI National Emissions Inventory
NESCAUM Northeast State for Coordinated Air Use Management
NH4 Ammonium
N03 Nitrate
NOx Nitrogen oxides
NOV Notice of Violation
non-EGU Non-electrical generating units
NPS National Parks Service
NS New Source Review
obs Observed
oc Organic carbon
OMC Organic mass carbon
OTB On-the-books
p80 80th percentile
PJFF Pulse jet fabric filter
PM Particulate matter
PM10 Particulate matter with aerodynamic diameters less than 10 microns
PM2.5 Particulate matter with aerodynamic diameters less than 2.5 microns
PMF Positive matrix factorization method
POC Particulate organic matter
PSAT Particulate Matter Source Apportionment Technology
PSD Prevention of Significant Deterioration
Q/D Emissions over distance (to Class 1 area)
REMSAD Regional Modeling Systems for Modeling and Deposition
RH Relative Humidity
RHR Regional Haze Rule
ROG Reactive Organic Gases
ROP Renewable operating permit
RPG Reasonable progress goal
iiiAcronym Description
RPO Regional Planning Organization
RRF Relative response factor
RVP Reid Vapor Pressure
SCR Selective catalytic reduction
SDA Spray dryer absorption
SENEY Seney Wilderness Area
SESARM Southeast State Air Resource Managers, Inc.
SIP State Implementation Plan
SMC St. Mary’s Cement
SMP Smoke Management Plan
SNCR Selective non-catalytic reduction
SO2 Sulfur dioxide
SO4 Sulfate
SOA Secondary organic aerosol
SSCC Smurfit Stone Container Corporation
TIP Tribal Implementation Plan
TMC Tilden Mining Company
tpy Tons per year
TSD Technical Support Document
URP Uniform rate of progress
VIP Visibility impairing pollutant
VISTAS Visibility Improvement State and Tribal Association of the Southeast
VOC Volatile organic compounds
VOYA Voyageurs National Park
W20% Worst 20 percent (days of visibility)
WRAP Western Regional Air Partnership
WWESP Wet walled electrostatic precipitator
ivExecutive Summary
Michigan is subject to requirements in the U. S. Environmental Protection Agency (EPA)
Regional Haze Rule (RHR) as described in 40 CFR 51.308(f). The first planning period for
Regional Haze spanned years 2008-2018, and the Michigan Department of Environment,
Great Lakes, and Energy (EGLE) submitted that State Implementation Plan (SIP) in 2010.
The Haze Rule requires states to update the SIP for subsequent 10-year planning periods,
and this SIP document represents the period from 2018-2028. The SIP is required to be
submitted to the EPA by July 31, 2021.
The RHR’s aim is to provide for natural visibility levels by 2064 at specified Class 1
areas. Michigan has two Class 1 areas subject to the requirements in the Haze Rule;
Isle Royale National Park and Seney Wilderness Area, both located in Michigan’s
Upper Peninsula. In developing this SIP, EGLE followed the most recent guidance as
found in the EPA’s “Guidance on Regional Haze State Implementation Plans for the Second
Implementation Period,” published in August 2019 (RH Guidance). This guidance allows
states to develop a SIP that is reasonable, both in assessing whether visibility
improvements are needed at the two Class 1 areas as well as in determining whether
additional emission reductions are needed at stationary sources potentially impacting the
Class 1 areas.
Visibility levels at Michigan’s two Class 1 areas are determined by federal air monitors in the
general vicinity of the Class 1 areas. EGLE relied on this data, and on modeling and data
analysis provided by the Lake Michigan Air Directors Consortium (LADCO) to develop much
of the core analysis in this SIP document. LADCO has provided detail on their work in their
Technical Support Document (TSD), which can be found in Appendix A to this document.
The modeling and data analysis information in this document is taken from the TSD
including some figures, tables, and text.
This SIP document provides a picture of past, current, and projected future visibility at Isle
Royale and Seney Class 1 areas, and shows what if any additional emissions reductions
are needed on stationary sources potentially impacting the areas during this 10-year
planning period. In this document EGLE provides a clear demonstration of: 1) monitoring
data for Isle Royale and Seney that has shown and continues to show visibility remaining
below the level needed to demonstrate reasonable progress in meeting the natural
condition goal in 2064. 2) LADCO modeling projecting visibility at the Class 1 areas to
remain below the reasonable progress level in 2028. 3) For these reasons, it is
unreasonable for EGLE to require additional emission reductions from the potentially
impacting sources identified with the Q/D analysis.
Figures 2 and 3 in Section 2 of this document depict the relationship between the actual
monitoring values, projected modeling values for 2028, and the reasonable progress line
(referred to as glidepath in this document) extending to the natural conditions targets for
2064.
Page 11 Introduction
1.1 General Background
Section 169A of the 1977 amendments to the Clean Air Act (CAA) established a
visibility protection program for the nation’s areas of “great scenic importance,”
otherwise known as Class 1 areas. CAA Section 169A established as a national goal
the “prevention of any future, and the remedying of any existing impairment of visibility
in mandatory Class 1 Federal areas which impairment results from man-made air
pollution.”
In 1999, the EPA promulgated the Regional Haze Rule (RHR) to establish more
comprehensive visibility protections in the nation’s Class 1 areas. The RHR required all
states submit regional haze SIPs every 10 years, and to review these SIPs every 5
years. For haze SIPs, the Clean Air Act sets “as a national goal the prevention of any
future, and the remedying of any existing, impairment of visibility in Class 1 areas which
impairment results from man-made air pollution.” There are 156 Class 1 areas, including
four in the LADCO region: Isle Royale National Park and Seney National Wildlife
Refuge in Michigan; and Boundary Waters Canoe Area and Voyageurs National Park in
Minnesota. The EPA’s visibility rule (64 FR 35714, July 1, 1999) requires reasonable
progress in achieving “natural conditions” by year 2064.
In January 2017, the EPA issued a final rule updating the regional haze program,
including revising portions of the visibility protection rule promulgated in 1980 and the
RHR. The 2017 rule clarifies obligations of the states and EPA during the second haze
implementation period, which tracks progress in improving visibility out to year 2028.
EGLE developed the technical basis for the SIP in conjunction with LADCO and other
member states (Minnesota, Wisconsin, Illinois, Indiana, and Ohio). LADCO provides
technical support to its member states and EGLE relied on LADCO photochemical
modeling to support this Regional Haze SIP. The data analysis of the monitoring data
for Class 1 areas is also provided by LADCO. This SIP document contains LADCO
modeling and data analysis as well as detailed descriptions of large emission sources in
the state that are estimated to have impacts on the two Class 1 areas in Michigan.
1.2 Michigan’s Regional Haze Class 1 Areas
Isle Royale National Park, Michigan’s largest wilderness area, is an island 571,790
acres in size, located in Lake Superior. Isle Royale was established as a national
park in 1940 by President Franklin D. Roosevelt and in 1976 was designated part of
the National Wilderness Preservation System. In 1981, Isle Royale was designated
an International Biosphere Reserve by the United Nations, giving it global scientific
and educational significance. Well known for its timber wolves and moose, Isle
Royale is the site of the longest running large mammal predator-prey study in the
world.
Page 2Seney Wilderness Area is 25,150 acres in size, and is located in the western
portion of Seney National Wildlife Refuge in Michigan’s Upper Peninsula. The
Refuge was established in 1935 and the Wilderness Area was designated by the
U.S. Congress in 1970. Seney’s “string bogs” provide a unique habitat to a large
variety of birds, mammals, and unusual plants.
1.3 EGLE’s Reasonable Approach – 2018-2028 Planning Period
The RHR and guidance provides states with flexibility in the approach to Regional Haze
SIP development.
EGLE recognizes the overall purpose of the Regional Haze program is to meet natural
visibility conditions at Class 1 areas by 2064 or show for each 10-year planning period
reasonable controls have been implemented or will be implemented even though the
natural visibility conditions cannot be met by 2064. For Michigan’s two Class 1 areas,
monitoring data continues to show visibility remains below the level needed to
demonstrate reasonable progress in meeting the natural condition goal in 2064 (see
Figures 2 and 3). This fact serves as the basis for the approach, taken by EGLE, that
no additional controls are needed on affected sources for this 10-year planning
period. This conclusion is reinforced by the fact that several coal-fired Electric
Generating Units (EGUs) will be shutting down before and shortly after the end of this
planning period in 2028, accounting for large additional reductions in SO 2 and NOx in
the state.
Excerpts from the RH Guidance are provided below in italics, followed by EGLE
commentary highlighting how the guidance provides EGLE with the flexibility described
above. EGLE has put key concepts in bold text.
“The purpose of this guidance document is to help states1 develop approvable
regional haze state implementation plans (SIPs) to protect visibility in mandatory
Class 1 Federal areas.2 This guidance document in particular applies to the SIPs
that are due to be submitted to the Environmental Protection Agency (EPA) by
July 31, 2021, for the second implementation period ending in 2028.3 The
required content of these SIPs is specified in 40 CFR 51.308(f), which was
revised in 2017.4 This document supports key principles of program
implementation, including supporting states in developing SIPs for complying
with the Clean Air Act’s (CAA) visibility requirements; reducing state planning
burdens; and leveraging emission reductions achieved through CAA and other
programs that further improve visibility in protected areas.”
EGLE emphasizes the EPA’s intent to reduce state planning burdens. EGLE has taken
the approach in this SIP that additional controls on affected sources are not necessary
for this planning period and taking this approach will reduce state planning burdens.
Page 3“Importantly, this guidance is intended to provide information about EPA’s
understanding of the discretion and flexibilities states have within the statutory
and regulatory requirements to develop Regional Haze SIPs, even where states’
approaches differ from those provided in this document. States retain the
discretion to develop Regional Haze SIP revisions that differ from the
recommendations in this guidance; however, states must ensure the Regional
Haze SIPs are consistent with applicable requirements of the CAA and EPA
regulations, and are the product of reasoned decision-making.”
The concept described in the paragraph above is a key to the approach taken by EGLE
in developing this SIP for the second Regional Haze planning period; the Regional Haze
program provides for a high level of flexibility to states in developing a SIP that is
reasonable. EGLE is taking the approach that the existing levels of control at affected
facilities, as well as future emissions reductions at EGUs, will result in continued
improvement in monitored visibility through 2028.
“Reasoned decision-making is a core component of the Regional Haze
program, and thus of states’ Regional Haze SIP submissions. The EPA will
evaluate a state’s SIP revision to determine whether the state has
REASONABLY conducted the required analyses and engaged with the requisite
considerations in a manner that is consistent with the statutory visibility goal.”
As seen in Figures 2 and 3, EGLE continues to demonstrate reasoned decision-making
in preparing a SIP that does not impose unnecessary additional regulatory burdens on
affected facilities when current levels of emission control are adequate to meet
reasonable progress throughout the planning period. The RH Guidance highlights as a
basis of Regional Haze SIPs that states allow for reasonableness in development of the
SIP. The paragraph below from the RH Guidance strongly emphasizes flexibility and
reasonable decision-making as key concepts of the Haze program.
“The CAA and the Regional Haze Rule provide a process for states to follow to
determine what is necessary to make reasonable progress in Class 1 areas. As a
general matter, this process involves a state evaluating what emission control
measures for its own sources, groups of sources, and/or source sectors13 are
necessary in light of the four statutory factors, five additional considerations
specified in the Regional Haze Rule,14 and possibly other considerations
(e.g., visibility benefits of potential control measures, etc.). States have discretion
to balance these factors and considerations in determining what control
measures are necessary to make reasonable progress. The preamble to the
1999 Regional Haze Rule stated: “The flexibility for State discretion is, of course,
exactly what the regional haze rule provides.” 64 FR 35760. This guidance is
intended to help states exercise their discretion in SIP development for the
second implementation period. “Importantly, there is no specified outcome
or amount of emission reduction or visibility improvement that is directed
as the reasonable amount of progress for any Class 1 area.”
Page 4This SIP documents EGLE’s analysis of the continued improvements in visibility at Isle
Royale and Seney Class 1 areas and the modeled improvement in 2028. To suggest
additional controls may be appropriate at the affected facilities to potentially further
lower visibility impacts, ignores the reality that these sources have been and are facing
negative financial impacts from the COVID-19 downturn and normal market stresses for
these types of industries. For years, the paper industry has struggled to remain afloat
because of international competition. In fact, many such operations have closed in
Michigan over the last several decades. The steelmaking industry likewise has
struggled for many years because of foreign competition, marginalizing the need for iron
ore mining. Under these conditions, the most reasonable approach for addressing
visibility in this planning period is taken by EGLE; focusing on the past, current,
and future visibility levels remaining below the reasonable progress glidepath
and not evaluating additional controls at the affected facilities.
Page 52 Specific Components of the SIP
The following are key steps in developing a Regional Haze SIP for the second
implementation period as delineated in the RH Guidance. Excerpts from the guidance
are italicized. Following each stated step requirement, EGLE provides the necessary
information to address the requirement.
A. Ambient Data Analysis
• Identify the 20 percent most anthropogenically impaired days and the 20 percent
clearest days; and determine baseline, current, and natural visibility conditions for each
Class 1 area within the state. 40 CFR 51.308(f)(1).
Figure 1 shows the visibility trends at the Isle Royale and Seney Class 1 areas over the
past 18 years. The four upper lines represent the most impaired days and the four lower
lines are the clearest days. Trends for the most impaired days are significantly
downward and trends for the clearest days are moderately downward. This can be
largely attributed to reductions in sulfate and nitrate levels resulting from power plants
reducing their coal combustion. Further reductions in these pollutants are expected to
occur through 2028 and beyond as more coal-fired power plants in the region shut
down.
Figure 1 - Visibility Trends at Class 1 Areas in the LADCO Region
Table 1 contains the deciview values for baseline, current, and natural conditions
visibility for the 20 percent most impaired days at Isle Royale and Seney. Isle Royale
values are 19.63, 15.54, and 10.17, respectively. The Seney values are 23.58, 17.57,
and 11.11, respectively.
Page 6Table 1 - Natural conditions, 2000-2004 baseline visibility, observed 2014-2018
visibility, 2028 projected visibility, and 2028 unadjusted glidepath value on the
20% most impaired days at Isle Royale and Seney Class 1 areas
Observed 2028
Natural Observed Projected 2028
2000-2004 Unadjusted
Conditions 2014-2018 2028 20% Unadjusted
IMPROVE Baseline 20% Glidepath
20% Most 20% Most Most Impairment
Site ID Most 20% Most
Impaired Impaired Impaired (dv)
Impaired Impaired
Days (dv) Days(dv) Days (dv) (A) (A-B)
Days (dv) Days (dv) (B)
ISLE1 10.17 19.63 15.54 14.97 15.85 -0.88
SENE1 11.11 23.58 17.57 16.94 18.59 -1.65
Table 2 contains the deciview values for baseline, current, and natural conditions visibility
for the cleanest days at Isle Royale and Seney. The Isle Royale values are 6.77, 5.3, and
3.72, respectively. The Seney values are 7.14, 5.27, and 3.74, respectively.
Table 2 - Natural conditions, 2000-2004 baseline visibility, observed 2014-2018
visibility, 2028 projected visibility, and 2028 unadjusted glidepath value on the
20% Cleanest days at Isle Royale and Seney Class 1 areas
Observed 2028 2028
Natural Observed Projected
2000-2004 Unadjusted Unadjusted
IMPROVE Conditions 2014-2018 2028 20%
Baseline 20% Glidepath Impairment
Site ID 20% Clearest 20% Clearest Clearest Days
Clearest Days 20% Clearest (dv)
Days (dv) Days(dv) (dv) (A)
(dv) Days (dv) (B) (A-B)
ISLE1 3.72 6.77 5.3 5.1 2.84 2.26
SENE1 3.74 7.14 5.27 5.05 2.96 2.09
B. Determination of Affected Class 1 Areas in Other States
• Determine which Class 1 area(s) in other states may be affected by the state’s own
emissions.
EGLE does not significantly impact Class 1 areas in other states. LADCO has
performed source apportionment modeling that shows Michigan’s visibility impacts at
Class 1 areas in other parts of the country in 2028. The two closest Class 1 areas are in
Minnesota; Voyageurs, and Boundary Waters. Michigan impacts on visibility at these
two areas is only 2 percent each, which is shaded in Table 3.
Page 7Table 3 - Source Apportionment Modeling Results - Upper Midwest
Percent source contributions to
Source region Source contributions to 2028
2028 visibility at IMPROVE Sites
tags visibility at IMPROVE Sites (Mm-1)
(%)
IMPROVE Sites ISLE1 SENE1 BOWA1 VOYA2 ISLE1 SENE1 BOWA1 VOYA2
Total Bext (Mm-1) 50.5 60.7 45.3 47.7 100% 100% 100% 100%
Rayleigh 12.0 12.0 11.0 12.0 24% 20% 24% 25%
Sea salt (SS) 0.2 0.2 0.1 0.2 0% 0% 0% 1%
Biogenic 3.2 3.7 2.9 3.0 6% 6% 7% 6%
ICBC 10.0 11.1 8.9 8.9 20% 18% 20% 19%
Fire 1.5 1.1 1.6 2.5 3% 2% 3% 5%
Int'l anthro emis 2.0 2.4 1.5 1.6 4% 4% 3% 3%
Tribal 0.0 0.0 0.0 0.0 0% 0% 0% 0%
Offshore 0.1 0.1 0.0 0.0 0% 0% 0% 0%
West 0.6 0.8 0.8 0.7 1% 1% 2% 1%
Northeast 0.4 1.2 0.2 0.2 1% 2% 0% 0%
Southeast 0.2 0.5 0.1 0.1 0% 1% 0% 0%
IL 2.3 3.4 0.8 1.0 5% 6% 2% 2%
WI 3.5 4.5 2.2 1.7 7% 7% 5% 4%
IN 1.2 2.9 0.5 0.6 2% 5% 1% 1%
OH 0.6 1.5 0.4 0.5 1% 3% 1% 1%
MN 2.4 1.7 6.2 6.5 5% 3% 14% 14%
MI 3.3 6.5 0.8 0.7 7% 11% 2% 2%
IA 1.3 1.3 1.8 1.7 3% 2% 4% 4%
MO 1.4 1.3 0.8 0.9 3% 2% 2% 2%
AR 0.3 0.4 0.2 0.3 1% 1% 1% 1%
LA 0.1 0.1 0.1 0.0 0% 0% 0% 0%
TX 1.3 0.5 1.2 1.0 3% 1% 3% 2%
OK 0.4 0.2 0.6 0.6 1% 0% 1% 1%
KS 0.3 0.4 0.5 0.5 1% 1% 1% 1%
NE 0.9 0.8 0.9 1.0 2% 1% 2% 2%
ND 0.7 0.7 0.8 0.9 1% 1% 2% 2%
SD 0.2 0.2 0.3 0.3 0% 0% 1% 1%
WV 0.1 0.3 0.1 0.1 0% 1% 0% 0%
KY 0.3 0.8 0.1 0.2 1% 1% 0% 0%
RPO and other aggregated groups
Natural 4.7 4.9 4.5 5.5 9% 8% 10% 11%
LADCO 13.2 20.6 10.9 11.1 26% 34% 24% 23%
WRAP 0.6 0.8 0.8 0.7 1% 1% 2% 1%
CenSARA 6.0 5.0 6.0 6.0 12% 8% 13% 13%
VISTAS 0.6 1.7 0.3 0.4 1% 3% 1% 1%
Page 8Michigan emission impacts at other more distant Class 1 areas in the states of
Kentucky, Tennessee, West Virginia, Virginia, New Jersey, New Hampshire, Vermont,
and Maine are also minimal, in the 1 to 3 percent range. The basis of this information is
in the LADCO TSD in Appendix A of this document.
The Mid-Atlantic/Northeast Visibility Union (MANE-VU) organization is comprised of a
number of eastern states. They sent a letter to Michigan and other upwind states in
2017 identifying large emission sources in the states that MANE-VU wanted further
controlled as a response to the RHR. The intent is to improve visibility at Class 1 areas
in MANE-VU states. MANE-VU identified the Belle River and St. Clair Power Plants in
Michigan.
Section 8a of the RH Guidance notes a downwind state with a Class 1 area may
request an upwind state adopt specific measures that the downwind state believes are
reasonable. The guidance goes on to state such requests do not by themselves obligate
the other state to take the requested action for its SIP submission to be approvable. In
response to the MANE-VU letter, EGLE points out all of the emissions from the St. Clair
Power Plant will be eliminated in 2022 when the facility shuts down. This large reduction
in emissions more than addresses any small impacts Michigan sources have on
visibility at Class 1 areas in MANE-VU. The MANE-VU letter is found in Appendix C of
this SIP document.
C. Selection of Sources for Analysis
• Select the emission sources for which an analysis of emission control measures will
be completed in the second implementation period and explain the bases for these
selections. For the purpose of this source selection step, a state may consider
estimated visibility impacts (or surrogate metrics for visibility impacts), the four statutory
factors, the five required factors listed in section 51.308(f)(2)(iv), and other factors that
are reasonable to consider.
EPA guidance provides several methods for determining sources of emissions that may
be impacting Michigan’s Class 1 areas’ visibility. EGLE relied on the Q/D method to
identify sources in the state that were subject to review for possible 4-factor analysis.
LADCO did the analysis for EGLE and the other LADCO states, and the methodology is
described in a LADCO memo, located in Appendix B.
Because of the large number of sources in the state, EGLE screened out those not
significantly impacting the two monitors by only looking at sources with a Q/D value of
4 tons per year per kilometer (tpy/km) and greater. This cutoff represents approximately
80 percent of emissions from Michigan sources impacting Michigan’s two Class 1 areas.
The sources identified by the Q/D analysis are three paper manufacturing facilities, a
lime kiln facility, an iron ore mine, and a cement manufacturer. The paper manufac-
turers are Neenah in Munising, Verso in Quinnesec, and Verso in Escanaba. The lime
facility is Graymont in Gulliver, and the cement facility is St. Marys in Charlevoix.
Several power plants are also covered; DTE Monroe in Monroe, DTE Belle River in St.
Clair, Consumers Energy Campbell in West Olive, and Consumers Energy Karn in
Essexville.
Page 9Emissions from each of these sources generally total several hundred tons per year of
SO 2 and/or NOx. At each emission source there are one or more emission units. The
emission units found at these sources as listed below are boilers, recovery furnaces,
lime kiln, grate kiln, cement kiln, and EGUs. The units represent the large emission
points at the affected Q/D sources. There may be other units at these sources that have
small amounts of emissions and are therefore not further analyzed.
Neenah
Boilers
Neenah paper mill has two boilers that are used to produce steam, Boiler #1 and Boiler
#2.
Boiler #1 is a spreader stoker boiler that can burn coal and natural gas. The boiler
capacity is 202 million British thermal units per hour (MMBTU/hr) heat input. The boiler
was installed on 01/01/1958 and modified in 1997 and on 05/01/2015.
A new baghouse was installed on this boiler in 1996 to meet the 0.30 pound per 1,000
pound particulate limit. A spray dry absorber (SDA) was installed on the boiler in 2015
to reduce emissions of acid gas hazardous air pollutants (HAPs). The boiler is a
Compliance Assurance Monitoring (CAM) subject emission unit subject to the
requirements of 40 CFR Part 64.
Boiler #2 is a Riley Stoker boiler only capable of burning #2 fuel oil. Boiler capacity is
202 MMBTU/hr heat input. The boiler produces 150,000 lbs. of steam per hour and was
installed in 1970. The unit is considered “limited use” and is used only as a backup to
Boiler #1 if it becomes unavailable for any reason.
Verso Quinnesec
Boilers
Verso uses two power boilers; the Waste Fuel Boiler and the Package Boiler. The
boilers produce steam for energy generation and to provide heat for the pulping and
paper making processes. The mill operates steam-driven turbines to produce a portion
of the electricity required by the facility.
Waste Fuel Boiler – The boiler was installed in 1981 with nominal rated heat input
capacity of 625 MMBtu/hr. It is a combination fuel boiler capable of burning wood
refuse, coal, and natural gas to produce steam which is supplied to the steam turbines
and processes at the mill. The Waste Fuel Boiler is equipped with an oxygen (O 2 ) trim
system to maintain excess air at the desired level in the boiler. The waste fuel boiler is
also an incineration device for dilute vent gases and/or. concentrated vent gases.
The Waste Fuel Boiler is an existing source with respect to Boiler MACT in the
subcategory of stokers/sloped grate/other units designed to burn wet biomass/bio-
based solid fuel. It is controlled with electrostatic precipitator, multicyclone collector, flue
gas recirculation, and over-fired air.
Page 10Package Boiler – The boiler was installed in 1989 with a nominal rated heat input
capacity of 419 MMBtu/hr. It is a natural gas-fired boiler that supplies steam to the
steam turbine and mill processes. The Package Boiler is designed to combust natural
gas and is equipped with an O 2 trim system to maintain excess air at the desired level in
the boiler. The Package Boiler is typically used as a backup boiler and is not run
continuously. The Package Boiler is an existing source with respect to Boiler MACT in
the subcategory of units designed to burn gas 1 fuels. As such, the Package Boiler is
not subject to emissions limits or operating limits under the Boiler MACT.
Recovery Furnace
Chemical Recovery Furnace – The furnace burns organic or lignin laden filtrates (black
liquor) from the pulp digester and pulp washing processes to recover pulp cooking
chemicals. The Recovery Furnace also produces steam for energy generation and heat
for the pulp and paper making processes. It is rated for 600,000 pounds of steam per
hour (1036 MMBtu per hour heat input). The furnace is also capable of burning salt
cake/electrostatic precipitator (ESP) hopper solids and natural gas. It is also an
incineration point for vent gases (containing total reduced sulfur [TRS] compounds) from
the pulping processes. Emissions are controlled by an ESP.
Verso Escanaba
Boilers
Verso uses four power boilers to produce steam for energy generation and to provide
heat for the pulping and papermaking processes; #7, #8, #9, and #11. The mill operates
steam-driven turbines to produce a portion of the electricity required by the facility.
The #7 Boiler is a Riley boiler rated for 150,000 pounds of steam per hour
(approximately 154 million BTU per hour heat input) that provides steam for mill
processes. The #7 Boiler burns natural gas and fuel oil. It was installed in 1947.
The #8 Boiler is a Combustion Engineering boiler rated for 450,000 pounds of steam
per hour (approximately 594 million BTU per hour heat input) that provides steam for
mill processes and steam turbine-generator sets for producing electricity. A Flue Gas
Recirculation system was installed on the # 8 Boiler in 2003 for compliance with the
NOx emission limitations specified in Michigan Air Pollution Control Rule 336.1801. The
#8 Boiler burns natural gas and fuel oil. It was installed in 1968 and was modified in
1978. It was subject to best available retrofit technology (BART) in the previous
Regional Haze SIP per 40 CFR 52.1183(i).
The #9 Boiler is a Babcock & Wilcox boiler rated for 250,000 pounds of steam per hour
(approximately 360 million BTU per hour heat input) that provides steam for mill
processes and steam turbine-generator sets for producing electricity. The #9 Boiler
burns primarily wood residue but may also burn natural gas and paper cores. The #9
Boiler emissions are controlled by a multicyclone dust collector and two wet scrubbers.
It was installed in 1970. It was subject to BART in the previous Regional Haze SIP per
40 CFR 52.1183(i).
Page 11The #11 Boiler is an ABB Combustion Engineering combination fuel boiler rated for
750,000 pounds of steam per hour (approximately 1,040 million BTU per hour heat
input) that provides steam for mill processes and steam turbine-generator sets for
producing electricity. The #11 Boiler burns natural gas and pulverized coal from four
tangentially located windboxes. The boiler also burns wood residue, wastewater
treatment plant residuals, and tire-derived fuel from a traveling grate located at the
bottom of the unit. Emissions are controlled by an over-fired air system, multiclone dust
collector, and an ESP. It was installed in 1981 and modified in 1986 and 2012.
Recovery Furnace
The #10 Chemical Recovery Furnace is used to regenerate chemicals used in the Kraft
process. The #10 Recovery Furnace is rated for 565,000 pounds of steam per hour
(approximately 950 million BTU per hour heat input), and burns black liquor, natural
gas, #6 fuel oil, ultra-low sulfur diesel, and used oil. Also, the #10 Recovery Furnace
receives and incinerates high volume low concentration noncondensable gases from
the Digester System, Brownstock System, Evaporator System, and Chemical Recovery
Furnace System. The secondary air forced-draft air handling fan on the Recovery
Furnace has been modified. It is controlled by an ESP. The furnace was subject to
BART in the previous Regional Haze SIP per 40 CFR 52.1183(i).
Graymont
Lime Kiln
Kiln #1 is a single rotary kiln with preheater and Neimis style cooler. The kiln is fired with
a mixture of coal and petroleum coke. The preheater/cooler acts as a sulfur dioxide
absorption device. Several fabric filter baghouses are used at the plant for particulate
matter control. The plant can produce no more than 584,000 tons of limestone feed per
year based upon a 12-month rolling time period. The kiln was installed in 2007.
Tilden Mine
Grate Kilns
Grate Kiln #1 Indurating Furnace dries and preheats pellets on a traveling grate and
heats the pellets in a rotary kiln for final induration. The kiln is fired with coal, natural
gas, or used oil. Dry ESPs provide control for particulate matter. The main burners are
rated at 590 million BTU per hour heat input. Kiln #1 was built in 1974 and is subject to
a federal implementation plan requiring compliance with federal visibility protection
regulations that require BART per 40 CFR 52.1183(k)(1)(i).
Grate Kiln #2 Indurating Furnace dries and preheats pellets on a traveling grate and
heats the pellets in a rotary kiln for final induration. Grate Kiln #2 is fired with coal,
natural gas, or used oil. Dry ESPs provide control for particulate matter. Kiln #2 main
burners are rated at 590 million BTU per hour heat input. Kiln #2 was built in 1978.
Page 12St. Marys Cement
Cement Kiln
The in-line kiln system, which includes a preheater tower and rotary kiln, was recently
modified pursuant to a Permit to Install issued in 2016. Materials from the silo are fed to
the preheater tower and calcined. The source of heat for this reaction is generated in
both the calciner and kiln. The kiln is the location where the feed is heated to a point
where the calcined feed is melted and then cooled to start the formation of clinker. A
tertiary duct transfers hot exhaust gases from the clinker cooler to the calciner portion of
the preheater tower.
Prior to the precalciner and kiln, the in-line Raw Mill kiln system uses a proportioning
system for grinding and mixing sources of iron, silica, calcium, and alumina. These raw
materials are added to the Raw Mill where the material is ground, and heated creating a
kiln feed mixture, which is conveyed to EUBLENDSILO for blending and storage. The
kiln feed is transferred from EUBLENDSILO via the kiln feed belt scale, elevator, and
fed to the upper stages of the pre-heating tower.
Control equipment associated with the in-line kiln system includes conditioning towers
prior to downstream equipment (for modulating temperatures), selective non-catalytic
reduction (SNCR), the main stack baghouse, bypass stack baghouse and other smaller
baghouses. The calciner and kiln have been designed to use traditional solid and liquid
fuels and various alternative fuels including asphalt flakes, plastic, and small quantities
of cellulose fiber. The kiln was subject to BART in the previous Regional Haze SIP per
40 CFR 52.1183(h).
DTE Belle River (1 & 2)
Electric Generating Units
The Belle River Power Plant operates under Renewable Operating Permit (ROP) No.
MI-ROP-B2796-2015b. The Belle River Power Plant has two EGUs, No. 1 and No. 2.
Pulverized coal is the primary fuel for both boilers. Boiler No. 1 and Boiler No. 2 are
each 697 megawatt (MW) nominally rated, dry bottom coal-fired boilers equipped with
low NOx burners, over-fire air, dry cold-side ESP, dry sorbent injection (DSI), and
activated carbon injection (ACI). Particulate emissions from the power plant are
controlled through the use of ESPs and baghouses. continuous emissions monitoring
systems (CEMS) are installed to measure gas flow, sulfur dioxide, carbon dioxide,
nitrogen oxides and opacity.
Other SO 2 emission sources at Belle River are the Peaking Units consisting of five
2.5 MW each diesel electric generators and three 82.4 MW each combustion turbine
electric generators. Also, there are the East China Peaking Units consisting of four
82.4 MW each combustion turbine electric generators. All these units are other sources
of SO 2 emissions at the power plant but are miniscule compared to Unit Nos. 1 and 2.
Page 13Consumers Energy Campbell (1, 2, 3)
Electric Generating Units
The Campbell Power Plant operates under ROP No. B2835-2020. There are 3 boilers
that together produce approximately 1,450 megawatts (net) per hour.
Boiler #1 is a 2,490 MMBTU per hour pulverized coal dry bottom, tangential-fired boiler
with fuel oil startup capabilities. Emissions are currently controlled by low-NOx burners,
sorbent injection (ACI or other sorbent for mercury control), DSI (hydrated lime or other
sorbent), and a pulse-jet fabric filter (PJFF) baghouse. This boiler was installed in1958.
Boiler #2 is a 3560 MMBTU per hour pulverized coal wall-fired (converted from cell
burner) boiler with fuel oil startup capability. Emissions are controlled by low-NOx
burners, SCR, sorbent injection (ACI or other sorbent for mercury control), DSI
(hydrated lime or other sorbent), and a PJFF baghouse. This boiler was installed in
1963.
Boiler #3 is an 8,240 MMBTU per hour pulverized coal dry bottom, wall-fired boiler with
fuel oil startup capability. Emissions are controlled by low-NOx burners, selective
catalytic reduction (SCR), sorbent injection (ACI or other sorbent for mercury control),
spray dryer absorption (SDA), and PJFF baghouse. This boiler was installed in 1974.
DTE Monroe (1-4)
Electric Generating Units
The Monroe Power Plant operates, under MI-ROP-B2816-2019, four coal-fired cell
burner boilers, which have a total nominal capacity of 3,280 megawatts at a maximum
heat input of 7,624 MMBtu per hour for each unit on a fuel input basis. A low NOx
burner system was installed in the boilers in 1994 and a new generation of low-NOx
burners were installed on Units 1, 2, 3, and 4 in March 2006, March 2005, August 2006,
and November 2005, respectively. Low-NOx burners, over-fire air, reduced emissions
fuel sorbent system, SCR, dry wire ESP, and wet flue gas desulfurization systems
control the emissions from each boiler. In addition, each stack is equipped with a
continuous emission monitoring system for the measurement of SO 2 , NOx, particulate
matter, and carbon dioxide emissions.
Consumers Energy Karn (1-4)
The Karn Power Plant operates under MI-ROP-B2840-2014c. Boilers #1 and #2 are
each 2,500 million BTU per hour, dry bottom tangential coal-fired boilers with fuel oil
startup capabilities and supplemental co-firing for flame stabilization and mill outages.
Low NOx burners were installed in 1998. Particulate emissions are currently controlled
by PJFFs, which replaced two ESPs (in series). To comply with the NOx Budget
Trading Program/CAIR Program, SCR and/or the accumulation of adequate NOx
allowances are utilized. An SDA and sorbent injection control SO 2 , mercury, acid gases,
and air toxics.
Boiler #3 is a 7,290 million BTU per hour natural gas and fuel oil-fired boiler (i.e., dual
fuel), and Boiler #4 is an 8,030 million BTU per hour natural gas and fuel oil-fired boiler;
Page 14i.e., dual fuel. SO 2 emissions from Boilers #3 and #4 are controlled via fuel blending,
and NOx emissions are controlled via low NOx burner technology.
D. Characterization of Factors for Emission Control Measures
• Identify potential emission control measures for the selected sources, develop data on
the four statutory factors and on visibility benefits if they will be considered.
EGLE has been working on the 2021 Haze SIP in conjunction with LADCO and the
LADCO states. A LADCO workgroup has been having calls since 2018, looking at
modeling and considering which sources in each state have the most impact on one or
more of the Class 1 areas in the region. As stated in the previous section, this
evaluation begins with a Q/D analysis for each stationary source in the state. Some of
the states, including Michigan, are using the value of 4 tpy/km and above as the cutoff
for sources to consider for analysis.
The next step for considering whether additional controls are reasonable for the affected
source is a 4-factor analysis on large emission units within each of the sources above
the Q/D cutoff. The RHR describes the 4-factors as remaining useful life of the unit, cost
to further control the unit, time needed to implement control, and energy/non-air quality
environmental impacts to further control the unit.
The units listed in the previous section are the units that were evaluated. Only the units
that had several hundred tons of NOx and/or SO 2 per year were evaluated via the
4-factors because smaller units at a source would contribute little to haze issues at the
Class 1 areas.
In the following part of this report, more recent data from 2018, is used in the
descriptions of emissions at the large units located at the facilities. The age of each unit
is given; the majority of the affected units are 30 or more years old. Adding additional
controls to these older units may not be reasonable. However, the primary reason
EGLE has chosen not to evaluate the affected units for further control is current and
future visibility at Isle Royale and Seney Class 1 areas remains below the glidepath
(see Figures 2 and 3). EGLE more fully describes taking this reasonable approach in
Section 2.3 of this document.
Neenah
Boilers
Boiler #1 emissions in 2018 were 258 tons of NOx and 475 tons of SO 2 , qualifying this
boiler for further 4-factor analysis because of the large emission total. The analysis
follows:
Remaining Useful Life – Boiler #1 was installed on 01/01/1958, making it 62 years old.
Therefore, the remaining useful life may be minimal and is evaluated by the company
on a year-to-year basis.
Page 15Cost to Further Control – Boiler #1 was modified in 1997 with a baghouse to control
particulates. On 05/01/2015 another modification was made to install an SDA control for
HCl and some SO 2 . The boiler’s age and low haze levels in this 10-year SIP cycle
suggest no additional controls are needed at this time to address regional haze.
Time Needed to Implement Control – Because no additional control is considered
reasonable for this boiler, this factor is nonapplicable (NA).
Energy/non-air Quality Environmental Impacts - NA
Boiler #2 emissions in 2018 were 0 because it did not operate. The boiler is considered
“limited use” and is used only as a backup to Boiler #1 if it becomes unavailable for any
reason. For this reason, the boiler does not qualify for further 4-factor analysis. Further,
this boiler was installed in 1970, making it a 50-year-old boiler, and any further control
may be considered unreasonable for purposes of the Regional Haze SIP.
Verso Quinnesec
Boilers
WASTE FUEL BOILER emissions in 2018 were 429 tons of NOx and 145 tons of SO 2 ,
qualifying this boiler for further 4-factor analysis review because of the large emission
total. The analysis follows:
Remaining Useful Life – The boiler was installed in 1981, making it 39 years old.
Therefore, the remaining useful life may be minimal and is evaluated by the company
on a year-to-year basis.
Cost to Further Control – The boiler is controlled with electrostatic precipitator,
multicyclone collector, flue gas recirculation, and over-fired air. The age of the boiler
and the low haze levels suggest no additional controls are needed at this time to
address regional haze.
Time Needed to Implement Control – NA
Energy/non-air Quality Environmental Impacts – NA
PACKAGE BOILER emissions in 2018 were 15 tons of NOx because it operated very
little, and it therefore does not qualify for further 4-factor analysis. Further, this boiler
was installed in 1989, making it a 31-year-old boiler. The boiler’s age and low haze
levels in this 10-year SIP cycle suggest no additional controls are needed at this time to
address regional haze.
Recovery Furnace
CHEMICAL RECOVERY FURNACE emissions were 642 tons of NOx in 2018,
qualifying this recovery furnace for further 4-factor analysis review because of the large
emission total. The analysis follows:
Page 16Remaining Useful Life – The furnace was installed in 1981, making it 39 years old.
Therefore, the remaining useful life may be minimal and is evaluated by the company
on a year-to-year basis.
Cost to Further Control – The chemical recovery furnace is controlled by an ESP. The
furnace employs staged combustion air – primary through quaternary – to aid in
minimizing NOx emissions. The age of the furnace and the low haze levels in this
10-year SIP cycle suggest no additional controls are needed at this time to address
regional haze.
Time Needed to Implement Control – NA
Energy/non-air Quality Environmental Impacts – NA
Verso Escanaba
Boilers
#7 BOILER emissions in 2018 were 9 tons of NOx, because it is a backup boiler and is
operated very little. For this reason, it does not qualify for further 4-factor analysis.
Further, this boiler was installed in 1947, making it a 73-year-old boiler, and any further
control may be considered unreasonable for purposes of regional haze.
#8 BOILER emissions in 2018 were 254 tons of NOx, qualifying this boiler for further
4-factor analysis review because of the large emission total. This boiler was a BART
unit in the 2010 Regional Haze SIP. The 4-factor analysis follows:
Remaining Useful Life - #8 Boiler was installed in 1968 and was modified in 1978,
making it 52 years old. Therefore, the remaining useful life may be minimal and is
evaluated by the company on a year-to-year basis.
Cost to Further Control – A Flue Gas Recirculation system was installed on the #8
Boiler in 2003 for compliance with the NOx emission limitations specified in Michigan Air
Pollution Control Rule 336.1801. This boiler was a BART unit in the prior Regional Haze
SIP and has undergone a FIP analysis by the EPA. Because of the age of the boiler and
recent BART requirements it is unreasonable to require further control.
Time Needed to Implement Control – NA
Energy/non-air Quality Environmental Impacts – NA
#9 BOILER emissions in 2018 were 165 tons of NOx, qualifying this boiler for further
4-factor analysis review because of the emission total. This boiler was a BART unit in
the 2010 Regional Haze SIP. The 4-factor analysis follows:
Remaining Useful Life – #9 Boiler was installed in 1970, making it 50 years old.
Therefore, the remaining useful life may be minimal and is evaluated by the company
on a year-to-year basis.
Page 17Cost to Further Control – #9 Boiler emissions are controlled by a multicyclone dust
collector and two wet scrubbers. This boiler was a BART unit in the prior Regional Haze
SIP and has undergone a FIP analysis by the EPA. Because of the boiler’s age and
recent BART requirements, it is unreasonable to require further control.
Time Needed to Implement Control – NA
Energy/non-air Quality Environmental Impacts – NA
#11 BOILER emissions in 2018 were 530 tons of NOx and 700 tons of SO 2 , qualifying
this boiler for further 4-factor analysis review because of the large emission total. The
analysis follows:
Remaining Useful Life – #11 Boiler was installed in 1981, making it 39 years old. It was
modified in 1986 and 2012. Therefore, the remaining useful life may be minimal and is
evaluated by the company on a year-to-year basis.
Cost to Further Control – #11 Boiler emissions are controlled by an over-fired air
system, multicyclone dust collector, and ESP. The age of the boiler and the low haze
levels in this 10-year SIP cycle suggest no additional controls are needed at this time to
address regional haze.
Time Needed to Implement Control – NA
Energy/non-air Quality Environmental Impacts – NA
Recovery Furnace
#10 RECOVERY FURNACE emissions in 2018 were 479 tons of NOx and 15 tons of
SO 2 , qualifying this furnace for a 4-factor analysis. The analysis follows:
Remaining Useful Life – The furnace was installed in 1972 and was updated in 1994
and 2014, making it 49 years old. Therefore, the remaining useful life may be minimal
and is evaluated by the company on a year-to-year basis.
Cost to Further Control – The secondary air forced-draft air handling fan on the
Recovery Furnace has been modified. The age of the furnace and the low haze levels in
this 10-year SIP cycle suggest no additional controls are needed at this time to address
regional haze.
Time Needed to Implement Control – NA
Energy/non-air Quality Environmental Impacts- NA
Graymont
Lime Kiln
The SINGLE ROTARY KILN emissions in 2018 were 275 tons of NOx and 24 tons of
SO 2 , qualifying this furnace for a 4-factor analysis. The analysis follows:
Page 18Remaining Useful Life – The kiln was installed in 2007, so it can be considered to have
a reasonable remaining useful life.
Cost to Further Control – The kiln includes a preheater and Neimis style cooler. The
preheater/cooler acts as an SO 2 absorption device. Several fabric filter baghouses are
used at the plant for particulate matter control. The low haze levels in this 10-year SIP
cycle suggest no additional controls are needed at this time to address regional haze.
Time Needed to Implement Control – NA
Energy/non-air Quality Environmental Impacts – NA
Tilden Mine
Grate Kilns
GRATE KILN #1 was subject to a BART analysis in the 2008-2018 haze SIP planning
period. It is currently undergoing FIP compliance based on EPA evaluations, and
therefore, EGLE is not doing an assessment on Kiln #1 for this second planning period.
GRATE KILN #2 emissions in 2018 were 4,500 tons of NOx and 322 tons of SO 2 ,
qualifying this kiln for a 4-factor analysis. The analysis follows:
Remaining Useful Life – The kiln was installed in 1978, which makes it 42 years old.
The company states the kilns represent a substantial capital investment and are
maintained to preserve their useful life as long as there is economically available ore for
Tilden to process. Per Cliffs’ 2020 SEC 10k report, Tilden has proven and probable
reserves to support at least another 25 years of operation at full operating capacity.
These values may be extended based on identification of future economically available
ores and/or operating years at less than full capacity.
Cost to Further Control – Existing controls on the kiln are dry ESPs. The low haze levels
in this 10-year SIP cycle suggest no additional controls are needed at this time to
address regional haze.
Time Needed to Implement Control – NA
Energy/non-air Quality Environmental Impacts – NA
St. Marys Cement
Cement Kiln
The in-line kiln system emissions in 2018 were 1,322 tons of NOx and 2,031 tons of
SO 2 , qualifying this emission unit for a 4-factor analysis. The analysis follows:
Remaining Useful Life – The in-line kiln system has been modified since 2016, so it can
be considered to have a long-term remaining useful life.
Page 19You can also read


