Publication details CLUM_50m_2020 2021-02-25 2020-12-18 - Catchment Scale Land Use of Australia - Update December 2020
←
→
Page content transcription
If your browser does not render page correctly, please read the page content below
Publication details

Title:

Catchment Scale Land Use of Australia – Update December 2020

Alternative Title:
CLUM_50m_2020

Date published:
2021-02-25

Date prepared:
2020-12-18

Preview:

                                                               1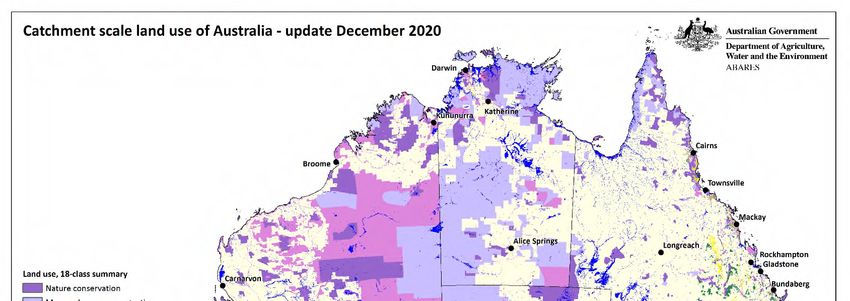
Abstract:
The Catchment Scale Land Use of Australia – Update 2020 dataset is the national compilation of catchment scale land use data
available for Australia (CLUM), as at December 2020. It replaces the Catchment Scale Land Use of Australia – Update
December 2018. It is a seamless raster dataset that combines land use data for all state and territory jurisdictions, compiled at
a resolution of 50 metres by 50 metres. The CLUM data shows a single dominant land use for a given area, based on the
primary management objective of the land manager (as identified by state and territory agencies). Land use is classified
according to the Australian Land Use and Management Classification version 8. It has been compiled from vector land use
datasets collected as part of state and territory mapping programs through the Australian Collaborative Land Use and
Management Program. Catchment scale land use data was produced by combining land tenure and other types of land use
information, fine-scale satellite data and information collected in the field. The date of mapping (2008 to 2019) and scale of
mapping (1:5,000 to 1:250,000) vary, reflecting the source data, capture date and scale. Date and scale of mapping are
provided in a supporting dataset.

What’s new?
Updates include more current data and or reclassification of existing data.

The following areas have more current data since the December 2018 version: Burnett-Mary and Fitzroy natural resource
management (NRM) regions in Queensland (2017 from 2009); Sydney basin in New South Wales (2017 from 2003); the state
of Tasmania (2019 from 2015).

The following areas include some reclassification; the Darwin-Litchfield and Katherine areas in Northern Territory, rural
residential areas in New South Wales.

Users should update any references or links to previous CLUM datasets in their databases.

Descriptive information

Authors:
Australian Bureau of Agricultural and Resource Economics and Sciences (ABARES)

Acknowledgements:
This dataset was compiled by Australian Bureau of Agricultural and Resource Economics and Sciences (ABARES) within the
Australian Government Department of Agriculture, Water and the Environment as part of the Australian Collaborative Land
Use and Management Program (ACLUMP).

ACLUMP, of which ABARES is a partner, is a consortium of Australian Government, and state and territory government
partners that promotes the development of nationally consistent land use, land cover and land management practice
information for Australia. This consortium of Australian and state and territory government partners is critical to providing
nationally consistent land use mapping at both catchment and national scale, underpinned by common technical standards
including an agreed national land use classification. ACLUMP provides a national land use data directory and the maintenance
of land use datasets on Australian and state government data repositories. More information on ACLUMP is available at
www.abares.gov.au/landuse.

Datasets were provided by: the New South Wales Department of Planning, Industry and Environment; the Northern Territory
Department of Environment, Parks and Water Security; the Queensland Department of Environment and Science; the South
Australian Department of Environment and Water; the Tasmanian Department of Primary Industries, Parks, Water and
Environment; the Victorian Department of Jobs, Precincts and Regions; and the Department of Primary Industries and
Regional Development, Western Australia.

Constraints

LEGAL CONSTRAINTS ASSOCIATED WITH THE MATERIAL

Limitation on the use of the material:
The Australian Government acting through ABARES has exercised due care and skill in the preparation and compilation of the
information and data set out in this publication. Notwithstanding, ABARES, its employees and advisers disclaim all liability,
including liability for negligence, for any loss, damage, injury, expense or cost incurred by any person as a result of accessing,
using or relying upon any of the information or data set out in this publication to the maximum extent permitted by law.

Constraints on using the material:
Copyright

                                                                                                                                 2
Other constraints:
Licence type: Copyright
(c) Commonwealth of Australia 2021
All material in this publication is licensed under a Creative Commons Attribution 4.0 Australia Licence, save for content
supplied by third parties, logos and the Commonwealth Coat of Arms.
Citation:
This publication (and any material sourced from it) should be attributed as:
ABARES 2021, Catchment Scale Land Use of Australia – Update December 2020, Australian Bureau of Agricultural and
Resource Economics and Sciences, Canberra, February, CC BY 4.0, DOI: 10.25814/aqjw-rq15.
Additional information about this material
Purpose for which the material was obtained:
This catchment scale land use dataset provides the best available land use mapping information for Australia’s regions as at
December 2020. It is used by the Department of Agriculture, Water and the Environment, state agencies and regional natural
resource management groups to address issues such as agricultural productivity and sustainability, biodiversity conservation,
biosecurity, land use planning, natural disaster management and natural resource monitoring and investment. The data vary
in date of mapping (2008 to 2019) and scale (1:5,000 to 1:250,000).
How to use this data:
Use this data to:
- Zoom in to a region to identify, map and analyse land use
- Inform on land use categories such as irrigated horticulture and dryland cropping, grapes, cotton, cereals, sugar and
tree fruits in a region (for more detail on commodities see the complementary vector dataset Catchment Scale Land
Use of Australia – Commodities – December 2020)
- Extract or combine with other spatial datasets to provide new insights and analysis concerning land use in Australia
Do not use this data to:
- Derive national statistics. The Land use of Australia data series should be used for this purpose.
- Calculate land use change
It is not possible to calculate land use change statistics between annual CLUM national compilations as not all regions are
updated each year; land use mapping methodologies, precision, accuracy and source data and satellite imagery have improved
over the years; and the land use classification has changed over time. It is only possible to calculate change when earlier land
use datasets have been revised and corrected to ensure that changes detected are real change and not an artefact of the
mapping process.
Progress status of this material:
Completed
Maintenance and Update Frequency:
As needed (approximately annual)
KEYWORD(S)
ANZLIC Search Words:
AGRICULTURE
AGRICULTURE Crops
AGRICULTURE Horticulture
AGRICULTURE Irrigation
AGRICULTURE Livestock
FORESTS
FORESTS Agroforestry
FORESTS Natural
FORESTS Plantation
HERITAGE Natural
HUMAN ENVIRONMENT
LAND
LAND Topography
LAND Use
VEGETATION
VEGETATION Structural
WATER
3WATER Lakes
WATER Surface
WATER Wetlands
General Keywords:
Australian Collaborative Land Use and Management Program (ACLUMP)
Land use
Mapping
TOPICS
ABARES Topic categories:
Agriculture
Land Use
Environment and Natural Resource Management
Models, Risk, Spatial Data and Datasets
ISO topic categories:
Farming
Environment
inlandWaters
PlanningCadastre
SPATIAL EXTENT(S)
Extent
Description of spatial extent:
Australian Land
Spatial bounding box included in:
North: -1010000 m; South: -4847000 m; East: 21220000 m; West: -1888000 m.
Spatial area included in:
Australian Mainland. Australia excluding external territories.
Projection:
EPSG: 3577
Coordinate reference details in Well-Known Text:
PROJCS["GDA94 / Australian Albers",
GEOGCS["GDA94",
DATUM["D_GDA_1994",
SPHEROID["GRS_1980",6378137,298.257222101]],
PRIMEM["Greenwich",0],
UNIT["Degree",0.017453292519943295]],
PROJECTION["Albers"],
PARAMETER["standard_parallel_1",-18],
PARAMETER["standard_parallel_2",-36],
PARAMETER["latitude_of_origin",0],
PARAMETER["central_meridian",132],
PARAMETER["false_easting",0],
PARAMETER["false_northing",0],
UNIT["Meter",1]]
4DATA PACKAGE CONTENTS
Table 1: Description of CLUM data package
File name File description
raster_clum_50m1220m.zip Catchment Scale Land Use of Australia (CLUM) – raster package
(Esri grid and supporting files).
geotiff_clum_50m1220m.zip Catchment Scale Land Use of Australia (CLUM) – raster package
(GeoTIFF format and supporting files).
shapefile_date_scale_clum_50m1220m.zip Catchment Scale Land Use of Australia (CLUM) – date and scale of
mapping shapefile package (Esri shapefile).
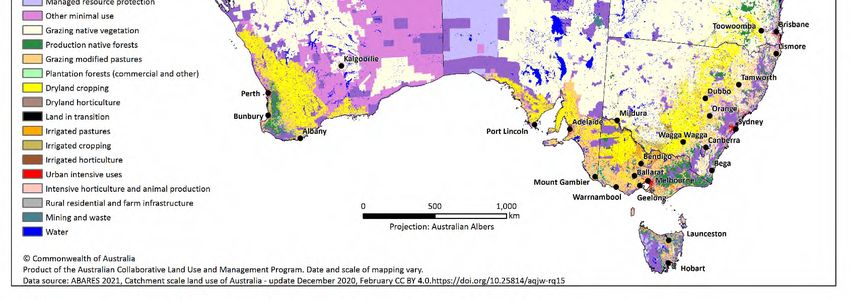
CLUM_map_December2020_ALUM_18class.png Land use map showing the CLUM dataset, based on the Australian
Land Use and Management (ALUM) 18-class summary
classification. Map produced in landscape format suitable for
printing at A4 size.
CLUM_map_December2020_ALUM_secondary.png Land use map showing the CLUM dataset, based on the ALUM
secondary classes. Map produced in landscape format suitable for
printing at A4 size.
CLUM_map_December2020_ALUM_agricultural_industries.png Land use map showing the CLUM dataset, based on the Australian
Land Use and Management (ALUM) agricultural industries
classification. Map produced in landscape format suitable for
printing at A4 size.
CLUM_map_December2020_dateofmapping.png This map shows the year land use was mapped in the vector data
used to compile the CLUM raster. Map produced in landscape
format suitable for printing at A4 size.
CLUM_map_December2020_scaleofmapping.png This map shows the mapping scale of the source vector data used
to compile the CLUM raster. Map produced in landscape format
suitable for printing at A4 size.
CLUM_map_December2020_areasupdatedsince2018.png This map shows the areas updated since the CLUM December
2018 release. Map produced in landscape format suitable for
printing at A4 size.
DATA DICTIONARY
Table 2: Attributes of the CLUM raster datasets (raster_clum_50m1220m.zip and geotiff_clum_50m1220m.zip)
Field name Field description Code values
VALUE ALUM code as a three digit integer. First digit is primary code, second digit Integer numeric value.
is secondary code, and third digit is tertiary code. Range: 100 to 663
COUNT Count of the number of raster cells in each class of VALUE Integer count.
TERTV8 ALUM tertiary code and description as a string. Text, width 254
Examples:
1.1.1 Strict nature reserves
6.6.3 Estuary/coastal waters - intensive use
SECV8 ALUM secondary code and description as a string. Text, width 254
Examples:
1.1 Nature conservation
6.6 Estuary/coastal waters
PRIMV8 ALUM primary code and description as a string. Text, width 254
Examples:
1 Conservation and natural environments
6 Water
CL18 Description of the corresponding class in the simplified 18 class land use Text, width 254
classification.
Examples:
Nature conservation
Other protected areas including indigenous uses
Urban intensive uses
Water
AGIND Description of agricultural industries. See table A4 for list. Text, width 254
Examples:
5Field name Field description Code values
Grazing native vegetation
Horticulture
Note: All ALUM codes refer to the Australian Land Use and Management Classification, version 8.
Table 3: Attributes of the CLUM date and scale of mapping polygon shapefile
(shapefile_date_scale_clum_50m1220m.zip)
Field name Field description Code values
FID Internal feature number that uniquely identifies each polygon Integer numeric value.
Shape Internal feature geometry (“polygon”) Geometry
date The year for which land use was mapped in the vector catchment scale land Integer numeric value.
use data provided by state and territory agencies Range 2008 to 2019
scale The scale at which land use was mapped in the vector catchment scale land String, width 15
use data provided by state and territory agencies. One of:
1:5,000, 1:10,000, 1:20,000, 1:25,000, 1:50,000, 1:100,000, 1:250,000
Scale code Scale as a numeric code Integer
RESPONSIBILITY FOR THIS MATERIAL
Custodian
Department of Agriculture, Water and the Environment:
Australian Bureau of Agricultural and Resource Economics and Sciences
Data Manager
GPO Box 858
CANBERRA CITY
Australian Capital Territory 2601 AUSTRALIA
Voice: +61 2 6272 3933
dataman@awe.gov.au
Publisher
Department of Agriculture, Water and the Environment:
Australian Bureau of Agricultural and Resource Economics and Sciences
GPO Box 858
CANBERRA CITY
Australian Capital Territory 2601 AUSTRALIA
Voice: +61 2 6272 3933
dataman@awe.gov.au
CONTACT(S) WHEN ENQUIRING ABOUT THIS MATERIAL
Point Of Contact
Department of Agriculture, Water and the Environment:
Australian Bureau of Agricultural and Resource Economics and Sciences
Data Manager
GPO Box 858
CANBERRA CITY
Australian Capital Territory 2601 AUSTRALIA
Voice: +61 2 6272 3933
dataman@awe.gov.au
PROCESS USED TO GENERATE THIS MATERIAL
Lineage Statement
Lineage:
ABARES has produced this raster dataset from vector catchment scale land use data provided by state and territory agencies,
as follows: Catchment Scale Land Use Mapping for the Australian Capital Territory 2012; 2017 NSW Land Use v1.2; Land Use
Mapping Project of the Northern Territory, 2016 – Current; Land use mapping – 1999 to Current – Queensland (June 2019);
[South Australia] Land Use (ACLUMP) (2017); Tasmanian Land Use 2019; Victorian Land Use Information System [VLUIS]
62016-17; Catchment Scale Land Use Mapping for Western Australia 2018. Links to land use mapping datasets and metadata
are available at the ACLUMP data download page at agriculture.gov.au/abares/aclump/land-use/data-download.
State and territory vector catchment scale land use data were produced by combining land tenure and other types of land use
information, fine-scale satellite data and information collected in the field, as outlined in 'Guidelines for land use mapping in
Australia: principles, procedures and definitions, 4th edition' (ABARES 2011). The Northern Territory, Queensland, South
Australia, Tasmania, Victoria and Western Australia were mapped to version 8 of the ALUM classification (‘The Australian
Land Use and Management Classification Version 8’, ABARES 2016).
The Australian Capital Territory was mapped to version 7 of the ALUM classification and converted to version 8 using a look-
up table based on Appendix 1 of ABARES (2016). Victoria converted the VLUIS vector data to the ALUM classification, based
on an agreed method using Valuer General Victoria land use codes, land cover and land tenure information.
ABARES converted all contributing polygon datasets to rasters based on the ALUM code using a model in ESRI ArcMap 10.6.
These datasets were then mosaicked and clipped to the GEODATA COAST 100K coastline (Geoscience Australia 2004).
NODATA voids in Adelaide were filled with Australian Bureau of Statistics 2016 mesh blocks land use attributes with
modifications based on: 1:250 000 scale topographic data for built up areas from GEODATA TOPO 250K Series 3 (Geoscience
Australia 2006) and National Aviation Facilities (Geoscience Australia 2012). All other NODATA voids were filled using the
ArcGIS focal statistics command.
Land use classification
The Australian Land Use and Management (ALUM) Classification version 8 is a three-tiered hierarchical structure. There are
five primary classes, identified in order of increasing levels of intervention or potential impact on the natural landscape.
Water is included separately as a sixth primary class. Primary and secondary levels relate to the principal land use. Tertiary
classes may include additional information on commodity groups, specific commodities, land management practices or
vegetation information. The primary, secondary and tertiary codes work together to provide increasing levels of detail about
the land use. Land may be subject to concurrent uses. For example, while the main management objective of a multiple-use
production forest may be timber production, it may also provide conservation, recreation, grazing and water catchment land
uses. In these cases, production forestry is commonly identified in the ALUM code as the prime land use.
The primary classes of land use in the ALUM Classification are:
1. Conservation and natural environments—land used primarily for conservation purposes, based on maintaining the
essentially natural ecosystems present
2. Production from relatively natural environments—land used mainly for primary production with limited change to
the native vegetation
3. Production from dryland agriculture and plantations—land used mainly for primary production based on dryland
farming systems
4. Production from irrigated agriculture and plantations—land used mostly for primary production based on irrigated
farming systems
5. Intensive uses—land subject to extensive modification, generally in association with closer residential settlement,
commercial or industrial uses
6. Water—water features (water is regarded as an essential aspect of the classification, even though it is primarily a
land cover type, not a land use).
Positional Accuracy:
The scale of the source data varies from 1:5,000 to 1:250,000. The operational scales of catchment scale mapping vary
according to the intensity of land use activities and landscape context. Scales range from 1:5,000 and 1:25,000 for irrigated
and peri-urban areas, to 1:100,000 for broadacre cropping regions and 1:250,000 for the semi-arid and arid pastoral zone.
Refer to the metadata of the individual source land use mapping dataset for specific measures of accuracy.
Attribute Accuracy:
The methods for mapping and classifying land use adhere to the standards outlined in 'Guidelines for land use mapping in
Australia: principles, procedures and definitions, 4th edition' (ABARES 2011) with the exception that most of the mapping was
attributed to the newest version of ‘The Australian Land Use and Management Classification Version 8’ (ABARES 2016).
Datasets mapped to version 7 of the ALUM Classification were converted to version 8 using a look-up table based on Appendix
1 in ABARES (2016). The date of mapping generally reflects the intensity of land use. The most current mapping occurs in
intensive agricultural areas; older mapping generally occurs in the semi-arid and pastoral zones.
Logical Consistency:
All input polygon datasets were checked for topological consistency.
Completeness:
Complete. NODATA voids were filled with ancillary data and modelling, as described in lineage.
7Information about the product description
Parties responsible for description
Description custodian
Department of Agriculture, Water and the Environment:
Australian Bureau of Agricultural and Resource Economics and Sciences
Data Manager
GPO Box 858
CANBERRA CITY
Australian Capital Territory 2601 AUSTRALIA
Voice: +61 2 6272 3933
dataman@awe.gov.au
Description publisher
Department of Agriculture, Water and the Environment:
Australian Bureau of Agricultural and Resource Economics and Sciences
GPO Box 858
CANBERRA CITY
Australian Capital Territory 2601 AUSTRALIA
Voice: +61 2 6272 3933
dataman@awe.gov.au
Description originator
Department of Agriculture, Water and the Environment:
Australian Bureau of Agricultural and Resource Economics and Sciences
Forest and Land Sciences
GPO Box 858
CANBERRA CITY
Australian Capital Territory 2601 AUSTRALIA
Voice: +61 2 6272 3933
dataman@awe.gov.au
Additional Metadata
References
ABARES 2011, Guidelines for land use mapping in Australia: principles, procedures and definitions, A technical handbook
supporting the Australian Collaborative Land Use and Management Program, 4th edition, Australian Bureau of Agricultural
and Resource Economics and Sciences, Canberra.
ABARES 2015, Addendum to the Guidelines for land use mapping in Australia: principles, procedures and definitions, 4th
edition, Australian Bureau of Agricultural and Resource Economics and Sciences, Canberra.
ABARES 2016, The Australian Land Use and Management Classification Version 8 , Australian Bureau of Agricultural and
Resource Economics and Sciences, Canberra.
ABARES 2021, Catchment Scale Land Use of Australia – Commodities – Update December 2020, Australian Bureau of
Agricultural and Resource Economics and Sciences, Canberra, CC BY 4.0. DOI: 10.25814/jhjb-c072
ABARES 2021, Land Use Data Download, Australian Bureau of Agricultural and Resource Economics and Sciences, Canberra.
Australian Bureau of Statistics 2016, 1270.0.55.001 - Australian Statistical Geography Standard (ASGS): Volume 1 - Main
Structure and Greater Capital City Statistical Areas, July 2016, Australian Bureau of Statistics, Canberra.
Geoscience Australia 2004, GEODATA COAST 100K 2004, Geoscience Australia, Canberra.
Geoscience Australia 2006, GEODATA TOPO 250K Series 3, Geoscience Australia, Canberra.
Geoscience Australia 2012, National Aviation Facilities, Geoscience Australia, Canberra.
8APPENDIX 1 – Colour tables
Table A1: Secondary land use classification symbology as RGB and hexadecimal colour values (Land use, secondary
classification.lyr)
VALUE SECV8 Red Green Blue Hex Colour
100; 110; 111; 112; 113; 114; 115; 1.1 Nature conservation 150 102 204 #9666CC
116; 117
120; 121; 122; 123; 124; 125 1.2 Managed resource protection 201 190 255 #C9BEFF
130; 131; 132; 133; 134 1.3 Other minimal use 222 135 221 #DE87DD
200; 210 2.1 Grazing native vegetation 255 255 229 #FFFFE5
220; 221; 222 2.2 Production native forests 41 137 68 #298944
310; 311; 312; 313; 314 3.1 Plantation forests 173 255 181 #ADFFB5
300; 320; 321; 322; 323; 324; 325 3.2 Grazing modified pastures 255 211 127 #FFD37F
330; 331; 332; 333; 334.; 335; 336; 3.3 Cropping 255 255 0 #FFFF00
337; 338
340; 341; 342; 343; 344; 345; 346; 3.4 Perennial horticulture 171 135 120 #AB8778
347; 348; 349
350; 351; 352; 353 3.5 Seasonal horticulture 87 58 64 #573A40
360; 361; 362; 363; 364; 365 3.6 Land in transition 0 0 0 #000000
410; 411; 412; 413; 414 4.1 Irrigated plantation forests 236 255 224 #ECFFE0
400; 420; 421; 422; 423; 424 4.2 Grazing irrigated modified pastures 255 170 0 #FFAA00
430; 431; 432; 433; 434; 435; 436; 4.3 Irrigated cropping 201 184 84 #C9B854
437; 438
440; 441; 442; 443; 444; 445; 446; 4.4 Irrigated perennial horticulture 156 84 46 #9C542E
447; 448; 449
450; 451; 452; 453; 454 4.5 Irrigated seasonal horticulture 79 43 23 #4F2B17
460; 461; 462; 463; 464; 465 4.6 Irrigated land in transition 52 52 52 #343434
510; 511; 512; 513; 514; 515 5.1 Intensive horticulture 255 201 190 #FFC9BE
520; 521; 522; 523; 524; 525; 526; 5.2 Intensive animal production 255 135 190 #FF87BE
527; 528
530; 531; 532; 533; 534; 535; 536; 5.3 Manufacturing and industrial 115 76 0 #734C00
537; 538
540; 541 5.4.0, 5.4.1 Urban residential 255 0 0 #FF0000
542; 543; 544; 545 5.4.2, 5.4.3, 5.4.4, 5.4.5 Rural residential and 156 156 156 #9C9C9C
farm infrastructure
500; 550; 551; 552; 553; 554; 555 5.5 Services 155 0 0 #9B0000
9VALUE SECV8 Red Green Blue Hex Colour
560; 561; 562; 563; 564; 565; 566; 5.6 Utilities 255 127 127 #FF7F7F
567
570; 571; 572; 573; 574; 575 5.7 Transport and communication 168 0 0 #A80000
580; 581; 582; 583; 584 5.8 Mining 71 130 143 #47828F
590; 591; 592; 593; 594; 595 5.9 Waste treatment and disposal 41 73 82 #294952
610; 611; 612; 613; 614 6.1 Lake 0 0 255 #0000FF
600; 620; 621; 622; 623 6.2 Reservoir/dam 0 197 255 #00C5FF
630; 631; 632; 633 6.3 River 0 112 255 #0070FF
640; 641; 642; 643 6.4 Channel/aqueduct 0 77 168 #004DA8
650; 651; 652; 653; 654 6.5 Marsh/wetland 115 178 255 #73B2FF
660; 661; 662; 663 6.6 Estuary/coastal waters 190 210 255 #BED2FF
Note: Codes refer to the Australian Land Use and Management (ALUM) Classification, version 8.
Table A2: Simplified 18-class land use classification symbology as RGB and hexadecimal colour values (Land use, 18-
class summary.lyr)
VALUE CL18 Red Green Blue Hex Colour
100; 110; 111; 112; 113; 114; 115; 116; Nature conservation 150 102 204 #9666CC
117
120; 121; 122; 123; 124; 125 Managed resource protection 201 190 255 #C9BEFF
130; 131; 132; 133; 134 Other minimal use 222 135 221 #DE87DD
200; 210 Grazing native vegetation 255 255 229 #FFFFE5
220; 221; 222 Production native forests 41 137 68 #298944
300; 320; 321; 322; 323; 324; 325 Grazing modified pastures 255 211 127 #FFD37F
310; 311; 312; 313; 314; 410; 411; 412; Plantation forests 173 255 181 #ADFFB5
413; 414
330; 331; 332; 333; 334; 335; 336; 337; Dryland cropping 255 255 0 #FFFF00
338
340; 341; 342; 343; 344; 345; 346; 347; Dryland horticulture 171 135 120 #AB8778
348; 349; 350; 351; 352; 353
360; 361; 362; 363; 364; 365; 460; 461; Land in transition 0 0 0 #000000
462; 463; 464; 465
400; 420; 421; 422; 423; 424 Irrigated pastures 255 170 0 #FFAA00
430; 431; 432; 433; 434; 435; 436; 437; Irrigated cropping 201 184 84 #C9B854
438
10VALUE CL18 Red Green Blue Hex Colour
440; 441; 442; 443; 444; 445; 446; 447; Irrigated horticulture 156 84 46 #9C542E
448; 449; 450; 451; 452; 453; 454
500; 530; 531; 532; 533; 534; 535; 536; Urban intensive uses 255 0 0 #FF0000
537; 538; 540; 541; 550; 551; 552; 553;
554; 555; 560; 561; 562; 563; 564; 565;
566; 567; 570; 571; 572; 573; 574; 575
510; 511; 512; 513; 514; 515; 520; 521; Intensive horticulture and animal 255 201 190 #FFC9BE
522; 523; 524; 525; 526; 527; 528 production
542; 543; 544; 545 Rural residential and farm infrastructure 178 178 178 #B2B2B2
580; 581; 582; 583; 584; 590; 591; 592; Mining and waste 71 130 143 #47828F
593; 594; 595
600; 610; 611; 612; 613; 614; 620; 621; Water 0 0 255 #0000FF
622; 623; 630; 631; 632; 633; 640; 641;
642; 643; 650; 651; 652; 653; 654; 660;
661; 662; 663
Note: Codes refer to the Australian Land Use and Management (ALUM) Classification, version 8.
Table A3: Agricultural industries classification symbology as RGB and hexadecimal colour values (Land use,
agricultural industries.lyr)
VALUE AGIND Red Green Blue Hex Colour
210 Grazing native vegetation 217 214 207 #D9D6CF
300; 320; 321; 322; 323; 324; 325; 360; Grazing modified pastures 205 213 70 #CDD546
361; 362; 363; 364; 365; 400; 420; 421;
422; 423; 424; 460; 461; 462; 463; 464;
465
330; 331; 332; 333; 334; 335; 336; 337; Cropping 114 136 26 #72881A
338; 430; 431; 432; 433; 434; 435; 436;
437; 438
340; 341; 342; 343; 344; 345; 346; 347; Horticulture 230 0 0 #E60000
348; 349; 350; 351; 352; 353; 440; 441;
442; 443; 444; 445; 446; 447; 448; 449;
450; 451; 452; 453; 454
510; 511; 512; 513; 514; 515; 520; 521; Intensive plant and animal industries 115 223 255 #73DFFF
522; 523; 524; 525; 526; 527; 528
100; 110; 111; 112; 113; 114; 115; 116; Other uses 255 255 255 #FFFFFF
117; 120; 121; 122; 123; 124; 125; 130;
131; 132; 133; 134; 220; 221; 222, 310;
311; 312; 313; 314; 410; 411; 412; 413;
414; 500; 530; 531; 532; 533; 534; 535;
536; 537; 538; 540; 541; 550; 551; 552;
553; 554; 555; 560; 561; 562; 563; 564;
565; 566; 567; 570; 571; 572; 573; 574;
575; 542; 543; 544; 545; 580; 581; 582;
583; 584; 590; 591; 592; 593; 594; 595;
600; 610; 611; 612; 613; 614; 620; 621;
622; 623; 630; 631; 632; 633; 640; 641;
642; 643; 650; 651; 652; 653; 654; 660;
661; 662; 663
Note: Codes refer to the Australian Land Use and Management (ALUM) Classification, version 8.
11You can also read