PVAAS Methodologies: Measuring Growth & Projecting Achievement - COMMONWEALTH OF PENNSYLVANIA DEPARTMENT OF EDUCATION
←
→
Page content transcription
If your browser does not render page correctly, please read the page content below
PVAAS Methodologies: Measuring
Growth & Projecting Achievement
                August 2021

       COMMONWEALTH OF PENNSYLVANIA
          DEPARTMENT OF EDUCATION
                 333 Market Street
            Harrisburg, PA 17126-0333
              www.education.pa.gov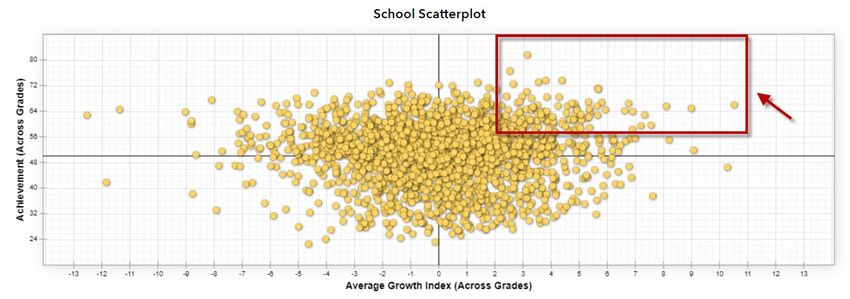
Commonwealth of Pennsylvania
                                            Tom Wolf, Governor

                                        Department of Education
                                         Noe Ortega, Secretary

                            Office of Elementary and Secondary Education
                                      Sherri Smith, Deputy Secretary

                          Bureau of Curriculum, Assessment, and Instruction
                                       Brian Campbell, Director

                              Division of Assessment and Accountability
                                          Brian Truesdale, Chief

The Pennsylvania Department of Education (PDE) does not discriminate in its educational programs,
activities, or employment practices, based on race, color, national origin, [sex] gender, sexual orientation,
disability, age, religion, ancestry, union membership, gender identity or expression, AIDS or HIV status, or
any other legally protected category. Announcement of this policy is in accordance with State Law
including the Pennsylvania Human Relations Act and with Federal law, including Title VI and Title VII of
the Civil Rights Act of 1964, Title IX of the Education Amendments of 1972, Section 504 of the
Rehabilitation Act of 1973, the Age Discrimination in Employment Act of 1967, and the Americans with
Disabilities Act of 1990.

The following persons have been designated to handle inquiries regarding the Pennsylvania Department
of Education’s nondiscrimination policies:

For Inquiries Concerning Nondiscrimination in Employment:
Pennsylvania Department of Education
Equal Employment Opportunity Representative
Bureau of Human Resources
Voice Telephone: (717) 783-5446

For Inquiries Concerning Nondiscrimination in All Other Pennsylvania Department of Education
Programs and Activities:
Pennsylvania Department of Education
School Services Unit Director
333 Market Street, 5th Floor, Harrisburg, PA 17126-0333
Voice Telephone: (717) 783-3750, Fax: (717) 783-6802

If you have any questions about this publication or for additional copies, contact:

Pennsylvania Department of Education
Bureau of Curriculum, Assessment, and Instruction
333 Market Street, 5th Floor, Harrisburg, PA 17126-0333
Voice: (717) 787-8913
education.pa.gov

All Media Requests/Inquiries: Contact the Office of Press & Communications at (717) 783-9802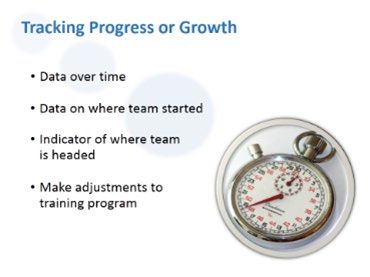
Table of Contents
What Does PVAAS Provide to Educators?................................................................................. 4
Concept of Growth: What is meant by academic growth? .......................................................... 5
   A Growth Analogy................................................................................................................... 6
   Measuring Growth with PVAAS .............................................................................................. 7
Measuring Growth with High Achieving Groups of Students......................................................10
   Statewide Evidence ...............................................................................................................11
Measuring Academic Growth during a Transition of Pennsylvania’s Assessment System .........13
   How can schools be expected to make growth if there is a gap year in state assessments, or
   if achievement changes significantly statewide? ....................................................................13
   Visual Example ......................................................................................................................14
Growth Standard Methodology - Measuring Growth in ELA and Math, Grades 4-8 ...................16
   Conceptual Look at Measuring Growth in ELA and Math, Grades 4-8 ...................................16
   More Detailed Look at Measuring Growth in ELA and Math, Grades 4-8 ...............................18
Predictive Methodology - Measuring Growth in Science and Keystone Content Areas..............21
   Conceptual Look at Measuring Growth in Science and the Keystone Content Areas.............21
   More Detailed Look at Measuring Growth in Science and the Keystone Content Areas ........23
Projection Methodology – Estimating Projections to Students’ Achievement on Future
Assessments ............................................................................................................................26
   A More Detailed Look at the Projection Methodology ............................................................28
Statistical Considerations ..........................................................................................................31
   Dealing with Missing Data .....................................................................................................31
   Accounting for Student Demographics...................................................................................32
Pennsylvania Reporting Rules ..................................................................................................34
Resources.................................................................................................................................36
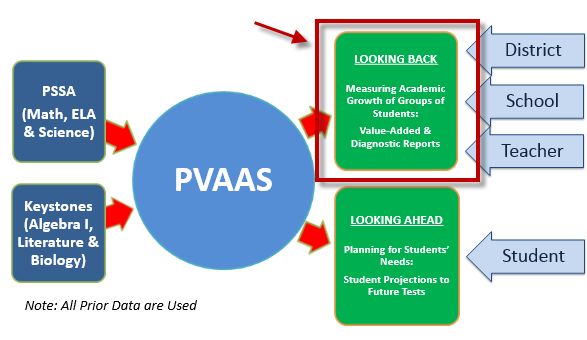
What Does PVAAS Provide to Educators?
PVAAS provides a wealth of information to educators through a variety of reports within a web-
based system. This information can be divided into two main categories – measuring growth
and projecting achievement.

First, PVAAS provides information on the academic growth students have made in the most
recently tested school year. This is what we call “looking back” information as it helps districts,
schools, and teachers assess how their educational programs and instructional strategies are
impacting the academic growth, or progress, of groups of students. This “looking back”
information is about the growth of groups of students, NOT individual students, and is available
at the district, school, and teacher levels. In PVAAS, there are two ways of measuring growth
depending on whether or not Pennsylvania’s state assessments (PSSA and Keystones) are
administered in consecutive years in the same subject. Both ways of measuring growth are
discussed in detail in later sections.

Second, PVAAS provides information on students’ possible academic performance, or
achievement, on future assessments (PSSA, Keystones, Advanced Placement, ACT, PSAT,
and SAT) – called PVAAS Student Projections. This is what we call “looking ahead” information
as it helps districts, schools, and teachers plan appropriately for the needs of its students –
including decisions regarding intervention placement, enrichment opportunities, course
selection, and differentiated instruction. This “looking ahead” information is available for
educators at an individual student level, or for grade-level groups and demographic student
groups. Details for projecting student achievement are discussed in a later section.

Revised August 2021                                                                                   4
Concept of Growth: What is meant by academic growth?
When talking about the academic growth for groups of students, it is important to first
understand what is meant conceptually about growth versus achievement before getting into the
more specific details of how growth is measured in PVAAS.

While PVAAS does not provide measures of growth for individual students, it is helpful to
understand the concept of academic growth by imagining a child’s physical growth curve. Every
year, a child stands up against the wall; the parent puts a ruler on his/her head and measures
the child’s height at ages 2, 3, 4, and so on.

From these data points, the parent can construct a graph to illustrate the height of the child and
then use these points to construct a graph of the growth of the child, as you see at bottom left.
Often, parents discover that this growth curve does not resemble the smooth line seen on a
pediatrician’s chart. Instead, there are “dimples” and “bubbles” in this constructed graph.
Children may have growth spurts. In addition, errors of measurement are possible; the child
may not have stood straight, or the parent did not hold the ruler 100% level.

Now apply the same process to education. The graph, at bottom right, measures growth for the
same group of students for each grade. Imagine that a school has been testing students’
annually in math and that the scores from these tests are used to construct each student
group’s math growth curve. The curve for any student will likely exhibit a pattern of dimples and
bubbles similar to the physical growth curve seen for an individual child. However, if by
aggregating the information on many students, we discover a dimple effect occurring in 4th
grade math with a group of students, then the dimple is evidence that the “standards-aligned
system” for 4th grade math may need to be examined.

Revised August 2021                                                                              5
A Growth Analogy
Consider another analogy, measuring the athletic progress or growth of track relay teams. Let’s
consider two relay teams. We’ll call them Team A and Team B. Each team is comprised of
individual runners whose individual times contribute to the overall speed of the team. In terms of
achievement:
    1. Team A has never placed in the top half of all teams at a track meet.
   2. Team B, however, has always placed in one of the top two spots.
Obviously, given their achievement level, Team A’s coach wants his team to grow and improve.
But Team B’s coach also wants his team to grow and improve. So, how can both coaches track
their team’s progress or growth over time?

First, they’d need to know their team’s data – that is, their running times – for each race. On any
given day, an individual runner’s time, and therefore the overall team’s time, can vary. For an
accurate picture of the impact of their techniques and training regimen, the coaches would need
to use the times from all races over a period of time to know where the team started and how
the team has progressed. The ongoing data can be used to adjust the team’s training program.

A reasonable goal for many coaches would be to at least have their team maintain their speed
over time. Regardless of their starting speed, no coach would want their team to lose ground or
decrease their speed. Ideally, all coaches would be happy if their team was able to increase
their speed. Perhaps the team can even make enough progress to break their team record. So,
the coaches of both Team A – whose achievement is not where the coach wants it to be, and
Team B – whose coach is proud of their current achievement, can assess whether their team
has been maintaining its speed over time, increasing its speed over time, or losing speed over
time.

The coaches need to track both achievement – how fast the team is, AND growth – how much
the team has progressed, in order to know whether the team is improving, maintaining, or falling
behind. This holds true whether the team is low-achieving, or high-achieving.

Revised August 2021                                                                               6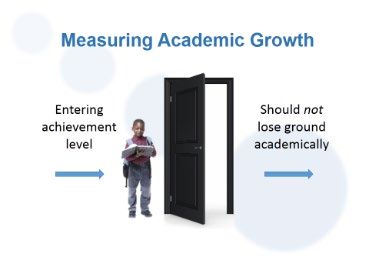
Connecting this analogy of track relay teams to how academic growth is measured for groups of
students, we recognize that there are:
1. teachers, schools, and districts in Pennsylvania whose students are more similar to relay
Team B – their students tend to score in the higher ranges on the state assessments,
AND
2. teachers, schools, and districts in Pennsylvania whose students are more similar to relay
Team A – their students tend to not be where they need to be academically
Just like the track relay teams, no teacher, school, or district wants their students to lose ground
or show a decrease in their achievement.
Measuring Growth with PVAAS
Each year across Pennsylvania, the academic performance of students is evaluated using
Pennsylvania’s state assessments. Each year, districts and schools receive information
regarding the achievement results for their students in the grades and subjects in which they
were assessed. This information includes the number and percentage of students who
performed in each of the four academic performance ranges – Advanced, Proficient, Basic, and
Below Basic. Achievement data from previous years is also included. But, because these data
are based on different groups of students each year, it’s sometimes challenging for teachers,
schools, and districts to use the data to make fair comparisons. This is the purpose of PVAAS –
to help educators make more fair comparisons.
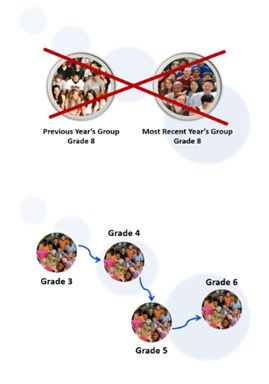
PVAAS uses the state assessment data to measure the academic growth of groups of students
from year to year at the district, school, and teacher levels. As illustrated below, PVAAS does
NOT compare the achievement of one group of students in a particular subject and grade with
the previous year’s students in that same subject and grade.
Revised August 2021 7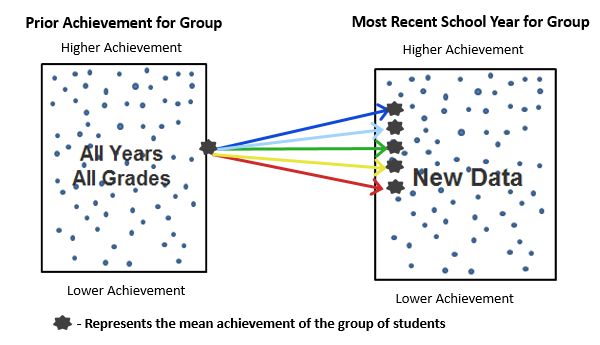
For example, the achievement of the most recent group of students in 8th grade Math is NOT
compared to the achievement of the previous year’s group of 8th grade Math students.
Rather, PVAAS measures the growth of each distinct group of students as they progress
through grade levels over time. It compares the group’s most recent academic achievement to
their own prior academic achievement in order to assess their growth over time.

Additionally, PVAAS does NOT use the percentages of students at various academic
performance levels to measure growth. Each performance level contains a range of scores, and
students move around within these ranges, as well as between ranges.

PVAAS uses students’ scores, rather than their academic performance level across grades and
subjects to generate a reliable estimate of the true achievement level of a group of students.
Then, these estimates of achievement are compared to estimate growth for a group of students.
Just as track coaches can track their team’s progress, with PVAAS, educators can track what’s
happening with groups of students as they move through the educational system. PVAAS color-
coding within the reporting lets educators easily see if the average achievement of a group
increases, decreases, or remains approximately the same over time.

In Pennsylvania, growth is assessed against the growth standard, which is based on the
philosophy that, regardless of the entering achievement of a group of students, they should not
lose ground academically.

Revised August 2021                                                                               8
If educators see that the PVAAS growth measure for a group of students is
color-coded yellow or red, it indicates that there is moderate or significant
evidence that the group of students did not meet the growth standard (i.e.,
the group lost ground academically).
This should be cause for concern for educators; they would want to ask some
questions about curriculum alignment, effective instructional practices,
ongoing formative assessment, placement of students in appropriate courses
and the existence of appropriate academic opportunities for struggling
students or students who may need enrichment.
If educators see that the growth measure for a group of students is color-
coded green, it indicates that the group of students met the growth standard
– or, on average, the achievement of the group was maintained.
In this case, educators would want to determine if green is good
enough for that group of students.
If the achievement of the group is high, then many teachers, schools,
and districts may say “that green is good.” However, even with a
green, there are certainly opportunities for students to increase their
average achievement and for educators to support students in
making academic growth.
If the group of students is lower achieving, some educators might say
that it’s good that the group did not slip further behind. However,
most educators would agree that green is not sufficient, or good
enough, for a lower achieving group of students since this means that
the group would simply be maintaining a lower level of achievement.
For students with lower achievement, the goal of teachers, schools,
and districts should be to raise the achievement of the student group.
If educators see that the growth measure for a group of students is color-
coded with dark blue or light blue, it indicates that there is moderate or
significant evidence that the group of students exceeded the growth
standard (i.e., the group gained ground academically).
Even higher achieving groups of students can earn a light blue or dark blue.
Remember, the achievement is an average for the group, so not every
student in the group is achieving the highest possible score every year.
Because of this, teachers, schools, and districts in Pennsylvania with high
achieving groups of students can also gain ground.
Teachers, schools, and districts need both achievement data AND growth data to get the
complete picture of student learning!
Revised August 2021 9
Measuring Growth with High Achieving Groups of Students
It is important to remember that ANY group of students can meet or exceed the growth standard
as measured by PVAAS value-added analyses.
In PVAAS grades 4-8 Math and ELA reporting, meeting the growth standard is about
maintaining students’ achievement based on a specific group’s prior academic
performance.
In Science and Keystone content areas, meeting the growth standard is about meeting
predicted performance based on a specific group’s prior academic performance.
Meeting the growth standard in PVAAS does NOT mean increasing students’ achievement or
increasing students’ academic performance levels; rather it is about, at a minimum, maintaining
achievement. For low-achieving groups of students, meeting the growth standard (green in
PVAAS) may not be sufficient or acceptable in order for students to meet long-term
achievement goals of proficiency. However, for high-achieving groups of students, meeting the
growth standard (green in PVAAS) may be sufficient or acceptable.
Generally, there is a misconception that teachers, schools, and districts with higher-achieving
students cannot make academic growth or that it is harder for them to make academic growth.
First, we need to consider how high achievement is defined. Some educators may use the total
percentage of students who scored Proficient or higher; others may use the percentage of
students scoring Advanced; and others may use the average achievement of all students.
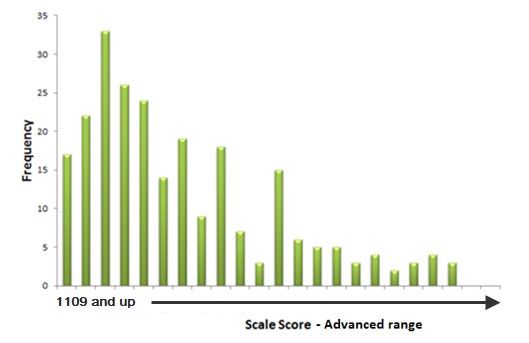
Consider an uncommon example where 100% of a school’s grade 7 students are performing at
the Advanced level in Math. Remember, the Advanced performance level is a range of scores,
and this range varies for each subject area and grade level. Using this hypothetical example,
the range of possible scores in the Advanced range is 1109 and above in any given year, with
many possible scores in between. So where do the students in our example school fall in the
distribution of scores at the Advanced level? The graphic shown below provides a look at the
distribution of scores in the Advanced range for our sample school. As you can see, the
distribution of scores is skewed towards the lower end of the Advanced range. There is certainly
room for students, on average, to maintain or increase their achievement. Furthermore, even
though all students are performing in the Advanced level, most students are performing at the
lower end of the Advanced range; only a few students are performing at the higher end of the
Advanced range.
When a school has a high percentage of students who are reaching proficiency, or even scoring
at the Advanced level, we cannot necessarily assume that all students are scoring at the highest
Revised August 2021 10point within the Advanced range. In fact, of the approximately 770,000 students assessed on
the PSSA in 2019:
less than 0.15% (less than 1005 students) scored at the highest point of the Advanced
range;
less than 0.01% (less than 80 students) scored at the highest point of the Advanced
range in Math two years in a row; and
0 students scored at the highest point of the Advanced range in ELA two years in a row.
For the Keystone tests, which were administered in the 2018-2019 school year, approximately
150,000 to 180,000 test scores were included in the PVAAS model for each subject. Of these
test scores:
less than 0.02% (less than 40 students) scored at the highest point of the Advanced
range in Algebra I;
less than 0.03% (less than 35 students) scored at the highest point of the Advanced
range in Biology; and
less than 0.01% (less than 15 students) scored at the highest point of the Advanced
range in Literature.
It is important to keep in mind that both the PSSA and Keystone exams meet the three
requirements to be used in PVAAS value-added analyses.
1. They demonstrate sufficient stretch so that students with low and high achievement can
both show growth.
2. They are aligned to state curriculum standards.
3. The scales are reliable from year to year.
In particular, Pennsylvania’s state assessments do provide sufficient stretch to discriminate not
only between proficiency and non-proficiency, but also to meaningfully discriminate between the
academic performance levels of Below Basic, Basic, Proficient, and Advanced. Remember,
regardless of the entering achievement of a group of students, they should NOT lose ground
academically! A reasonable goal would be to at least maintain the achievement of the student
group. Any group of students, even groups of students who are higher achieving, can make
academic growth!
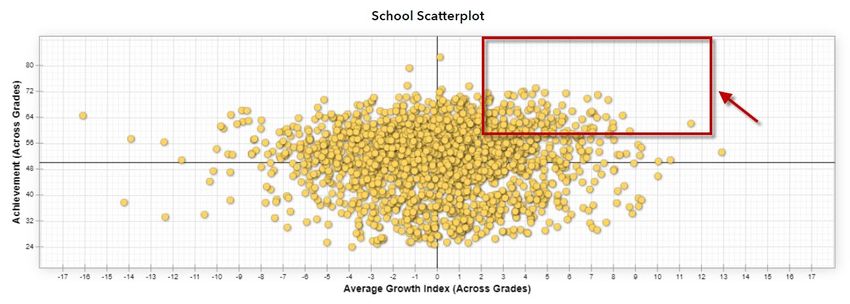
Statewide Evidence
There are groups of students with high achievement across Pennsylvania making high growth
each year. The PVAAS scatterplots, on the next page, provide evidence of this. In these
scatterplots, each dot represents a real Pennsylvania school, which has been placed on the
graph based upon the average achievement and the PVAAS Average Growth Index. For each
scatterplot:
1. The vertical green line represents that the group of students has meet the growth
standard
2. A PVAAS Average Growth Index significantly above zero (to the right of zero/green line)
indicates academic growth greater than the growth standard.
3. A PVAAS Average Growth Index significantly below zero (to the left of zero/green line)
indicates that the group of students did not meet the growth standard.
Revised August 2021 11MATH Rectangle showing schools with High Achievement & High Growth ELA Rectangle showing schools with High Achievement & High Growth Revised August 2021 12
Measuring Academic Growth during a Transition of Pennsylvania’s
Assessment System
PDE’s Executive Leadership, PDE’s Bureau of Assessment and Accountability, along with the
PVAAS Statewide Team, work with SAS® EVAAS® continuously as any changes are
considered, or implemented, with Pennsylvania’s statewide assessment system. This work is
done to ensure continued PVAAS reporting for Pennsylvania’s schools. The goal has always
been, and will continue to be, to provide fair, accurate, and meaningful value-added measures
for PA districts, schools, and educators.
Pennsylvania’s state assessment data is assessed annually to ensure the quality needed to
provide value-added reporting at all levels for all students, such as reliability and sufficient
stretch to measure the growth of students with higher and lower achievement.
When a gap year occurs in state assessments or a change is made in Pennsylvania’s state
standards or state assessments, or even if the assessment is being given for the first time in a
particular subject, academic growth as measured by PVAAS can be calculated – as long as
sufficient evidence exists regarding the relationships between and among the assessments, as
well as the strength of these relationships. Examples of these types of situations include, but are
not limited to:
A gap year in state assessments (which may occur with extended school closures)
Tests change in rigor, or have a change in level of difficulty
Tests are transitioned to be aligned to new academic standards
Tests given for the first time statewide in a particular subject, grade level, or course
Tests are shortened or lengthened
How can schools be expected to make growth if there is a gap year in state
assessments, or if achievement changes significantly statewide?
When a gap occurs in state assessments, such as with extended school closures, it is still
possible to measure the academic growth of groups of students in the year the assessments
resume – when growth is measured using the PVAAS methodologies. Just like when other
types of transitions or changes in testing occur, we may expect the achievement of student to
change as a result. Even if the statewide achievement or performance changes significantly,
PVAAS assesses whether a group of students exceeded, met, or fell short of the growth
standard. For example, when measuring growth for PSSA Math and ELA, the PVAAS growth
models analyze whether the group of students maintained their relative position on the
statewide distribution of scores relative to themselves. If the group of students maintains the
same relative position in the distribution of scores from one year to another (even if the overall
statewide distribution of scores is lower), then the group of students will have met the growth
standard.
SAS® EVAAS® does not use one, single model in its analyses. Rather, SAS® EVAAS® utilizes
multiple robust, longitudinal statistical models that are flexible and can accommodate for:
The use of both historical and current assessment data when tests change over time;
The use of all longitudinal data for each student, even when the historical assessment
data is on differing scales;
Revised August 2021 13 Students with missing test scores without introducing major biases that come from either
eliminating data from students or by using overly simplistic imputation procedures; and
Data challenges associated with both student and teacher mobility.
PVAAS (which is based upon the SAS® EVAAS® models) utilizes two general types of value-
added models to measure the academic growth students are making over time.
1. The growth standard methodology is used for tests given in consecutive grades, like the
PSSA Math and ELA assessments implemented in grades 3 through 8.
2. The predictive methodology is used when a test is given in non-consecutive grades, or
for other types of testing scenarios – like the PSSA Science or Keystone assessments.
Conceptually, growth compares the entering achievement of a group of students to their current
achievement. Both methodologies used to measure growth in PVAAS compare the growth of a
group of students to an expected amount of growth and provide information as to whether there
is statistical evidence that the group of students exceeded, met, or did not meet that expectation
of growth. No matter which type of methodology is used by SAS® EVAAS® to measure growth,
PVAAS analyzes the relationship between and among Pennsylvania’s state assessments when
determining the entering achievement of students and estimating growth for a group of students.
The use of PVAAS for assessing growth in all grades, subjects, and courses is predicated upon
the strong relationships that do in fact exist between and among Pennsylvania’s state
assessments. The multiple correlation coefficients between and among Pennsylvania’s state
assessments are very strong correlations, meaning that the relationship between these
assessments across subjects is strong. To illustrate using 2018-2019 data, the average multiple
correlation for:
PSSA Math using all prior test scores ranges from 0.82 to 0.86;
PSSA ELA using all prior test scores ranges from 0.80 to 0.84;
PSSA Science using all prior test scores ranges from 0.77 to 0.78; and
Keystones using all prior test scores ranges from 0.77 to 0.80.
Remember that correlations range between -1.0 and +1.0, with values of -1.0 and +1.0
indicating a perfect relationship, which are virtually unheard of in the real world. In general,
correlations above or below 0.6-0.7 are considered to indicate a strong relationship. (For more
information, reference the Psychometric Resource Centre, or How to Interpret a Correlation
Coefficient).
Visual Example
The following visuals demonstrate how growth is measured, and more importantly, how a group
of students can meet the growth standard if (1) the percentage of students reaching proficiency
is lower due to an assessment change, or (2) a gap year in state assessments occurs.
In Figure 1 below, the first vertical line represents what could be a year 1 distribution of Grade 6
scores, with scores at the top representing higher achievement while those at the bottom
represent lower achievement. The yellow star represents where the student group of Grade 6
students scored relative to the statewide distribution. The second vertical line represents the
year 2 distribution of Grade 7 scores. In year 2 of the example, fewer students scored proficient
Revised August 2021 14on the state assessment than in year 1, as represented by the yellow star. Remember, though, that the distribution of achievement of all students statewide is lower in the example – meaning fewer students were proficient in year 2 as compared to year 1. The question is, “Is the group of students at the same RELATIVE position in the distribution of statewide scores?” This is what PVAAS looks at to determine growth. Notice in this example that they are at the same relative position, which means this group of students met the growth standard, indicated by a green in PVAAS. In other words, these students “maintained their achievement.” Figure 2 represents a similar example with one difference. Like the example above, the first vertical line represents what could be a year 1 distribution of Grade 6 scores, with the yellow star represents where the student group of Grade 6 students scored relative to the statewide distribution in that year. The second vertical line, however, now represents the year 3 distribution of Grade 8 scores as a gap year in testing occurred in year 2. In year 3 of this example, fewer students scored proficient on the state assessment than in year 1, as represented by the yellow star. As in the prior example, the distribution of achievement of all students statewide is lower in our example – meaning fewer students were Proficient in year 3 as compared to year 1. The question again is, “Is the group of students at the same RELATIVE position in the distribution of statewide scores?” They are in fact at the same relative position, which means this group of students met the growth standard, indicated by a green in PVAAS. In other words, these students “maintained their achievement.” Revised August 2021 15
Growth Standard Methodology - Measuring Growth in ELA and Math,
Grades 4-8
As indicated in an earlier section, PVAAS provides information on the academic growth students
have made in the last school year. This helps districts, schools, and teachers assess how their
educational programs and instructional strategies are impacting the academic growth, or
progress, of groups of students.

PVAAS utilizes two different methodologies for measuring growth and estimating growth
measures for groups of students. These two ways of measuring growth are based on whether or
not the state assessments are administered in consecutive grade levels in the same subject.
This section details how growth is measured in ELA and Math in grades 4 through 8 where we
assess students in consecutive grade levels each year.

Conceptual Look at Measuring Growth in ELA and Math, Grades 4-8
When assessments are administered in consecutive grade levels as they are in Math and ELA
for grades 3 through 8, SAS® EVAAS® uses a Growth Standard Methodology to measure the
growth of a group of students. Each year, these students are tested with the PSSA. In the
graphic below, each dot represents a student in the group. Students in this group are going to
score anywhere along the achievement distribution from low to high achievement. To estimate
the achievement of this group of students, PVAAS uses all of the prior student level data from
all grades in both ELA and Math to estimate the average achievement of the group.

Revised August 2021                                                                          16
After the next round of testing in the following school year, PVAAS again uses all the prior data
for the group of students and adds the data from the most recent round of testing in order to get
a new estimate of the average achievement of the group.

Next, PVAAS compares the prior achievement of the student group to the new achievement of
the student group. This comparison allows us to estimate the academic growth the student
group has made in the past school year. Each Growth Measure is color-coded to ease in the
interpretation of growth for each group of students.

                 If the evidence indicates the achievement is roughly at the same point within
                 the distribution of scores as the previous year, this indicates that the group of
                 students maintained their achievement, which in PVAAS would be indicated
                 as Green – evidence that the student group met the growth standard.

                 If there is moderate evidence that the average achievement of this group of
                 students was at a higher point within the distribution of scores, this would
                 indicate that the group of students increased their average achievement
                 indicated with a Light Blue in PVAAS – moderate evidence that the student
                 group exceeded the growth standard.

Revised August 2021                                                                              17
Similarly, if there is significant evidence that the average achievement of this
group of students was at a higher point within the distribution of scores, this
would indicate that the group of students increased their average
achievement – indicated with a Dark Blue in PVAAS – significant evidence
that the student group exceeded the growth standard.
If there was moderate evidence that the average achievement of this group of
students was at a lower point within the distribution of scores, this would
indicate that the average achievement of the group of students slipped
indicated with a Yellow – moderate evidence that the student group did NOT
meet the growth standard.
Similarly, if there was significant evidence that the average achievement of this
group of students was at a lower point within the distribution of scores, this
would indicate that the average achievement of the group of students slipped –
indicated with a Red – significant evidence that the student group did NOT
meet the growth standard.
More Detailed Look at Measuring Growth in ELA and Math, Grades 4-8
For the PVAAS Growth Standard Methodology:
1. Using all of the available prior PSSA data in Math and ELA, PVAAS calculates a robust
estimate of achievement for a group of students.
2. The Growth Measure (or gain) from the previous year to the current year can then be
estimated.
3. The Growth Measure is then compared to the growth standard.
There are several important issues to consider when discussing how PVAAS calculates a
measure of growth using the Growth Standard Methodology. First, when measuring the gain
students make academically from one year to the next, we are measuring their growth by the
difference in their academic achievement in consecutive years or grade levels. This simple idea
becomes more complicated when we consider that the achievement scores from year to year
must be comparable, or in other words, on the same scale. In Pennsylvania, the PSSA scale
scores are NOT comparable from year to year as the scales are a bit different from year to year,
grade to grade, and subject to subject. To make these scores comparable from year to year,
SAS® EVAAS® converts all PSSA scale scores to NCEs in order for scores to be on the same
scale and be comparable from year to year, including during any transition of a state
assessment. The NCE distribution is similar to that for percentiles, with the important distinction
that the NCE distribution is an equal-interval scale such that moving from 50 to 60 represents
the same distance as moving from 70 to 80.
Second, if gain or academic growth is measured as the difference between consecutive years’
achievement, then it is critical that the achievement reflect the best estimate of students’ true
level of understanding and competency. While any single year PSSA score is an estimate of
achievement, it is still a single point in time. To obtain the best estimate of student achievement,
SAS® EVAAS® uses all of the prior Math and ELA data rather than just a single year or single
subject to obtain a better estimate of students’ true achievement each year.
Revised August 2021 18Let’s consider an analogy of why this is a best practice. Think about a teacher’s sample grade
book like we have below.
Quiz 1 Test 1 Quiz 2 Project 1 Test 2 Test 3 Final
Possible
Max Score 25 100 30 75 70 100 N/A
Joe 20 97 23 72 65 55 83
Maria 14 76 27 65 56 56 73.5
Elizabeth 21 96 25 60 64 78 86
We clearly would not use Joe’s last grade of 55 as the only score to represent his achievement
or understanding. For the same reason, we would not want to use only the last PSSA score
solely to represent a student’s achievement. Rather, PVAAS uses all of the Math and ELA data
for the group of students to estimate the true level of understanding and achievement. Scores in
both Math and ELA are used, as there is a strong relationship, or correlation, between students’
scores in these subjects statewide. The use of both subjects allows the Growth Measure to be
more reliable and accurate.
Third, how do we know that the estimated gain or academic growth is what we should expect to
see for a group of students? In Pennsylvania, academic growth is compared to the growth
standard, which is based on the philosophy that
despite the entering achievement of a group of
students, they should not lose ground
academically. The growth standard represents a
group of students maintaining their average
achievement as they move from grade to grade
in consecutive years. When thinking about this
standard, consider the physical growth chart for
young children as we have included at right. A
child is considered meeting the minimal
expectation for physical growth if they maintain
or improve their position in the distribution of
length/height as they grow from year to year.
Academically, this same concept applies. A
group of students meets the growth standard if
the group maintains its position in the statewide
database of achievement scores as the group
moves from grade to grade.
Once all achievement estimates are calculated, the gain (or Value-Added Growth Measure)
from the previous year to the current year can be calculated and compared to the growth
standard. If the current achievement of the student group is equal to the prior years’
achievement of the student group, then the difference between the two estimates of
achievement would be 0.0; in other words, students’ achievement was maintained from one
year to the next. This would be identified as a green in PVAAS indicating the group of students
met the growth standard.
All Growth Measures reported on the PVAAS reports are estimates. There is natural error
involved with any estimate, and this error, or variation, is expressed in terms of the Standard
Revised August 2021 19Error. The Standard Error allows you to determine the amount of evidence around the Growth
Measure to determine if significant growth, or a lack of growth, is in fact evident for the group of
students in question. One of the major functions of the Standard Error is that it allows us to
evaluate the significance or level of evidence that the estimate provides that the indicated
phenomenon is occurring. When we interpret a Growth Measure, we use the Standard Error to
determine if the level of evidence supports that the group of students in question has exceeded
or fallen short of the growth standard.
All five colors associated with the PVAAS Value-Added Growth Measure are explained below.
Dark Blue, or DB, is an indication that the Growth Measure is more than 2
standard errors above 0. There is significant evidence of exceeding the growth
standard.
Light Blue, or LB, is an indication that the Growth Measure is at least 1 but
less than 2 standard errors above 0. There is moderate evidence of exceeding
the growth standard.
Green, or G, is an indication that the Growth Measure is less than 1 standard
error above 0 and no more than 1 standard error below 0. There is evidence
of meeting the growth standard.
Yellow, or Y, is an indication that the Growth Measure is more than 1 but no
more than 2 standard errors below 0. There is moderate evidence of not
meeting the growth standard.
Red, or R, is an indication that the Growth Measure is more than 2 standard
errors below 0. There is significant evidence of not meeting the growth
standard.
For additional information on measuring growth using the SAS® EVAAS® statistical models on
which PVAAS is based, please reference the following resources.
1. Sanders, W. L., Saxton, A. M., and Horn, S. P. (1997). “The Tennessee Value-Added
Assessment System: A Quantitative, Outcomes-Based Approach to Educational
Assessment.” In Millman, J. (ed.) Grading Teachers, Grading Schools, Thousand Oaks,
CA: Sage Publications, pp. 137-162.
2. Technical Documentation of PVAAS Analyses (2020). Available at: Statistical Models
and Business Rules of PVAAS Analyses
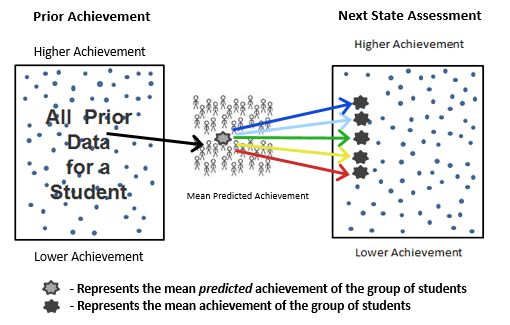
Revised August 2021 20Predictive Methodology - Measuring Growth in Science and Keystone Content Areas Remember, as indicated in earlier sections, PVAAS provides information on the academic growth students have made in the last school year. This helps districts, schools, and teachers assess how their educational programs and instructional strategies are impacting the academic growth of groups of students. PVAAS utilizes two different methodologies for measuring growth and estimating growth measures for groups of students. These two ways of measuring growth are based on whether or not the state assessments are administered in consecutive grade levels. This section details how growth is measured in Science and the Keystone content areas where students are not necessarily assessed in consecutive school years. Conceptual Look at Measuring Growth in Science and the Keystone Content Areas When the PSSA is not administered in consecutive grade levels as in Science or the Keystone content areas, SAS® EVAAS® uses a Predictive Methodology to measure the growth of a group of students. In these subjects, students are only assessed in specific grade levels or at the end of a specific course. In the graphic below, each dot represents a student in the group where prior state assessment data for that student are used. Those students are going to score along the achievement distribution from low to high achievement. PVAAS uses the student’s prior data (as outlined in the table in the subsequent section) to predict the scale score or achievement for a student on their next state assessment in the subject or content area of interest. These predicted scale scores for all students are used to calculate the mean or average predicted achievement for the student group. Revised August 2021 21
Next, these students are tested on the state assessment of interest. These students will again
score along the achievement distribution from low to high achievement. The average actual
achievement is calculated for the group. A comparison of the average actual achievement to the
average predicted achievement is then made to estimate the Growth Measure for the student
group.

.
Each Growth Measure is then color-coded to ease in the interpretation of growth.

                If the evidence indicates the achievement is roughly the same as what was
                predicted, this indicates that the group of students maintained their
                achievement, which in PVAAS would be indicated as Green – evidence that
                the student group met the growth standard.

               If there is moderate evidence that the average achievement of this group of
               students was higher than predicted, this would indicate that the group of
               students increased their average achievement indicated with a Light Blue in
               PVAAS – moderate evidence that the student group exceeded the growth
               standard.

Revised August 2021                                                                          22
Similarly, if there is significant evidence that the average achievement of this
group of students was higher than predicted, this would indicate that the
group of students increased their average achievement – indicated with a
Dark Blue in PVAAS – significant evidence that the student group exceeded
the growth standard.
If there was moderate evidence that the average achievement of this group of
students was lower than predicted, this would indicate that the average
achievement of the group of students slipped indicated with a Yellow –
moderate evidence that the student group did NOT meet the growth
standard.
Similarly, if there was significant evidence that the average achievement of
this group of students was lower than predicted, this would indicate that the
average achievement of the group of students slipped – indicated with a Red
– significant evidence that the student group did NOT meet the growth
standard.
More Detailed Look at Measuring Growth in Science and the Keystone
Content Areas
The methodology used to estimate growth for Science and the Keystone content areas is a
different methodology than what is used for estimating growth for ELA and Math in grades 4-8.
The reason behind the different methodology is that in Science and Keystone content areas we
do not necessarily test the same students in consecutive grade levels, whereas we do in the
subjects of ELA and Math in earlier grade levels.
Students who take the Science exam will have PSSA data in ELA and Math from prior years.
Additionally, students who take the Keystone exams will have PSSA data from prior years. The
Predictive Methodology used for estimating growth in these subjects uses all of that prior data
(across subjects) to calculate predicted scores for the student group. The predicted score for a
student is calculated by observing how all students with a similar prior testing history performed
on the test of interest, so we have an expectation of how that student should score. Growth is
then a function of the difference between the average predicted score of the student group and
the average actual score for the student group. Let’s take a closer look at this.
Each year, Pennsylvania state assessment data (PSSA and Keystone) are sent directly from
the test vendor to the SAS® EVAAS® team for PVAAS analyses. For the Predictive Methodology
discussed in this section, the PVAAS value-added analysis begins at the student level with the
collection of individual student data for a minimum of three prior data points (only exception is
grade 4 Science analyses where two data prior points are used). Note that each scale score in
each subject is considered a data point. By looking at the relationships between student scores,
PVAAS is able to predict future achievement for students. In other words, PVAAS predicts
students’ future achievement based on students’ past performances and the relationships
between those subjects.
You may be asking, “Are scores across subjects truly related? Is there a correlation across
subjects?” The answer to that is yes, students’ prior test scores are in fact related to the current
test we are investigating. In other words, the Keystone Algebra I test is highly related to PSSA
Revised August 2021 23Math scores in earlier grades. The Keystone Algebra I test is also related (perhaps to a lesser
extent) to PSSA ELA and Science scores in earlier grades. Each student’s prediction is based on
the student’s prior test scores, the relationship of those scores to the current year test, and the
average schooling experience in the state for the current year. In more technical terms, the
multiple correlation coefficient provides the correlation between the predicted score using all prior
test scores and the actual score itself. The multiple correlation coefficients between Keystones
and PSSA are very strong correlations, meaning that the PSSA provides good data for the
student predictions. To illustrate using 2018-2019 data, the average multiple correlation for:
PSSA Math using all prior test scores ranges from 0.82 to 0.86;
PSSA ELA using all prior test scores ranges from 0.80 to 0.84;
PSSA Science using all prior test scores ranges from 0.77 to 0.78; and
Keystones using all prior test scores ranges from 0.77 to 0.80.
Remember that correlations range between -1.0 and +1.0, with values of -1.0 and +1.0
indicating a perfect relationship, which are virtually unheard of in the real world. In general,
correlations above or below 0.6-0.7 are considered to indicate a strong relationship. (For more
information, reference the Psychometric Resource Centre, or How to Interpret a Correlation
Coefficient).
When calculating the predicted scores for students, PVAAS specifically utilizes the historical
state assessment data, when available, to predict future PSSA performances in Science and
future Keystone performances in Algebra I, Biology, and Literature. The table provided below
illustrates the data used for each subject.
Predicted Score IN… Prior Years’ Data Used to Calculate Predicted Score
PSSA Science All prior scores in PSSA Math, ELA, and Science (if available)
Keystone Algebra I All prior scores in PSSA Math, ELA, and Science (if available)
All prior scores in PSSA Math, ELA, and Science; and most
Keystone Biology
recent prior score in Keystone Algebra I (if available)
All prior scores in PSSA Math, ELA, and Science; and most
Keystone Literature
recent prior score in Keystone Algebra I and Biology (if available)
While the predicted scores for students are calculated, another analysis is run simultaneously to
compute the average of these same students’ actual scores. The Growth Measure is then
estimated by comparing the average of actual scores to the average of the predicted scores. If
students’ average actual score is equal to their average predicted score, then the Growth
Measure would be 0.0, or in other words, students scored as predicted given their previous
testing histories. This would be identified as a green in PVAAS indicating the group of students
met the growth standard. All five colors associated with the PVAAS Value-Added Growth
Measure are explained below.
Revised August 2021 24Dark Blue, or DB, is an indication that the Growth Measure is more than 2
standard errors above 0. There is significant evidence of exceeding the
growth standard.
Light Blue, or LB, is an indication that the Growth Measure is at least 1 but
less than 2 standard errors above 0. There is moderate evidence of
exceeding the growth standard.
Green, or G, is an indication that the Growth Measure is less than 1
standard error above 0 and no more than 1 standard error below 0. There is
evidence of meeting the growth standard.
Yellow, or Y, is an indication that the Growth Measure is more than 1 but no
more than 2 standard errors below 0. There is moderate evidence of not
meeting the growth standard.
Red, or R, is an indication that the Growth Measure is more than 2 standard
errors below 0. There is significant evidence of not meeting the growth
standard.
For additional information on measuring growth using the SAS® EVAAS® statistical models on
which PVAAS is based, please reference the following resources.
1. Sanders, W. L., Saxton, A. M., and Horn, S. P. (1997). “The Tennessee Value-Added
Assessment System: A Quantitative, Outcomes-Based Approach to Educational
Assessment.” In Millman, J. (ed.) Grading Teachers, Grading Schools, Thousand Oaks,
CA: Sage Publications, pp. 137-162.
2. Technical Documentation of PVAAS Analyses (2020). Available at: Statistical Models
and Business Rules of PVAAS Analyses
Revised August 2021 25Projection Methodology – Estimating Projections to Students’ Achievement on Future Assessments In addition to providing measures of academic growth, PVAAS provides projected scores for individual students on future assessments the students have NOT yet taken, as well as for students not yet Proficient on a Keystone exam. Projections are available to PSSA, Keystone, PSAT, SAT, ACT, and Advanced Placement (AP) exams, as well as the ACCESS for ELLs assessment given to English Learners. These projections can be used to predict a student’s current academic trajectory and may be used to guide counseling and intervention to increase students’ likelihood of future success. It can be useful to think about the PVAAS projections as being very similar to expectations we set in our everyday lives. Each day, whether we realize it or not, we generate expectations – about our work, our personal lives, and the world in general. These expectations are based on two things: information and experience. The individual student projections that are provided in PVAAS also rely on information and experience. In this case, the information is a student’s testing history, across grades and subjects. The experience is determined by students with similar prior achievement who have already taken the test of interest for the projection, so that students’ prior test scores across grades and subjects serve as predictors to their projection to a future assessment. Using this data, the projection model quantifies the projection in a precise and reliable way. In PVAAS, this means that projections indicate what is most likely to happen for a student academically, or in other words, how a student will most likely score on a future assessment if they continue on the same academic path. Revised August 2021 26
Most important to consider is that the projection methodology uses ALL of the available data in
both ELA and Math as predictors in its projection calculations. Additionally, prior Science data
are also used in predicting to all other subject areas and exams besides Math and ELA. The
table below illustrates the specific data used for each subject and exam.
Projection TO… Predictors Used in Calculating Student Projections
PSSA Math All prior scores in PSSA Math and ELA (if available)
PSSA ELA All prior scores in PSSA Math and ELA (if available)
PSSA Science All prior scores in PSSA Math, ELA, and Science (if available)
Keystone Algebra I All prior scores in PSSA Math, ELA, and Science (if available)
All prior scores in PSSA Math, ELA, and Science; and most
Keystone Biology
recent prior score in Keystone Algebra I (if available)
All prior scores in PSSA Math, ELA, and Science; and most
Keystone Literature
recent prior score in Keystone Algebra I and Biology (if available)
All prior scores in PSSA Math, ELA, and Science; and most
PSAT, SAT, ACT, and
recent prior score in Keystone Algebra I, Biology, and Literature
AP
(if available)
All prior ACCESS for ELLs domain scores in Listening, Speaking,
ACCESS for ELLs
Reading, and Writing
The reason the predictors listed above can be used in calculating projections is that students’
prior test scores are in fact related to the current test we are investigating. For example, the
Keystone Algebra I test is highly related to PSSA Math scores in earlier grades. The Keystone
Algebra I test is also related (perhaps to a lesser extent) to PSSA ELA and Science scores in
earlier grades. Each student’s projection is based on the student’s prior test scores, the
relationship of those scores to the current year test, and the average schooling experience in
the state for the current year. In more technical terms, the multiple correlation coefficient
provides the correlation between the predicted score using all prior test scores and the actual
score itself. The multiple correlation coefficients between Keystones and PSSA are very strong
correlations, meaning that the PSSA provides good data for the student predictions. To illustrate
using 2018-2019 data, the average multiple correlation for:
PSSA Math using all prior test scores ranges from 0.82 to 0.86;
PSSA ELA using all prior test scores ranges from 0.80 to 0.84;
PSSA Science using all prior test scores ranges from 0.77 to 0.78; and
Keystones using all prior test scores ranges from 0.77 to 0.80.
Remember that correlations range between -1.0 and +1.0, with values of -1.0 and +1.0
indicating a perfect relationship, which are virtually unheard of in the real world. In general,
correlations above or below 0.6-0.7 are considered to indicate a strong relationship. (For more
information, reference the Psychometric Resource Centre, or How to Interpret a Correlation
Coefficient).
Revised August 2021 27Projections can be made for any students with any set of available predictor scores defined in
the projection model. However, to protect against bias due to measurement error in the
predictors, projections are made only for students who have at least three available predictor
scores (with the exception of projections to grade 4 assessments in which two available
predictor scores are used). In addition to the projected score itself, the standard error of the
projection is calculated. Given a projected score and its standard error, it is possible to calculate
the probability that a student will reach a specified benchmark of interest. In the case of
Pennsylvania, probabilities of performing at a Basic level or higher, at a Proficient level or
higher, or at an Advanced level on a future PSSA or Keystone exam are calculated.
Probabilities of performing at or above specified college benchmarks on the PSAT, SAT, and
ACT are also calculated, as well as probabilities of scoring a 3 or higher, a 4 or higher, or a 5 on
an AP exam. These probabilities are calculated as the area above the benchmark cut score
using a normal distribution with its mean being equal to the projected score and its standard
deviation being equal to the standard error of the projected score.
A More Detailed Look at the Projection Methodology
The PVAAS Projection methodology is in fact quite complex and involves the use of many data
points across multiple subjects and multiple years. Let’s look at a more detailed perspective of
this methodology to provide further insight into this modeling process.
To do this, let’s consider an example. Suppose we wish to project the 8th grade Math score for a
student named Tyler. This student was new to Pennsylvania at the beginning of his 5th grade
year. To date, we have the following state assessment data available for Tyler from grades 5-7.
1. grade 5 Math and grade 5 ELA
2. grade 6 Math and grade 6 ELA
3. grade 7 Math and grade 7 ELA
First, we would create a projection model for 8th grade Math based on all of the students in the
state who have already taken 8th grade Math and have the same prior scores as Tyler. The next
step is to construct a formula, which can take all of those prior test scores and make the best
possible prediction for all the students in the state who have already taken 8th grade Math.
In this example:
Projected Score (Grade 8 Math) = a(grade 5 Math) + b(grade 5 ELA) + c(grade 6 Math)
+d(grade 6 ELA) + e(grade 7 Math) + f(grade 7 ELA) + g, where a, b, c, d, e, f, and g are
estimated numbers based on correlations across subjects, and grade 5 Math, grade 5
ELA, etc. are test scores.
To then calculate the projected 8th grade Math score for Tyler, we need to (1) substitute the
values of the test scores for Tyler into the formula, and (2) calculate the estimate of his 8th grade
Revised August 2021 28You can also read