Python Libraries for Data Analysis and Machine Learning - Xu Weiwen & Yang Haoran 2022-4-1
←
→
Page content transcription
If your browser does not render page correctly, please read the page content below
Python Libraries for Data
Analysis and Machine
Learning
Xu Weiwen & Yang Haoran
2022-4-1
Overview

▪ Environment Preparation for Python
▪ Python Libraries for Data Scientists
▪ Data Processing & Visualization Using Python
▪ Python for Basic Machine Learning Models
Environment Preparation for Python
We introduce
◦ Anaconda (https://www.anaconda.com/)
◦ Jupyter Notebook (https://jupyter.org/)
for Python environment.

Other alternatives:
 ◦ Text Editor + Command line
 ◦ IDE (Integrated Development Environment): PyCharm, Vscode, …
What is Anaconda?
The open-source Anaconda is the easiest way to perform Python/R data science
and machine learning on Linux, Windows, and Mac OS X. With over 19 million
users worldwide, it is the industry standard for developing, testing, and training
on a single machine, enabling individual data scientists to:
 ▪ Quickly download 7,500+ Python/R data science packages
 ▪ Analyze data with scalability and performance with Dask, NumPy, pandas,
 and Numba
 ▪ Visualize results with Matplotlib, Bokeh, Datashader, and Holoviews
 ▪ Develop and train machine learning and deep learning models with scikit-
 learn, TensorFlow, and Theano
Anaconda Installation
Please follow the instruction here to install the Anaconda (for Python 3.7)

https://www.anaconda.com/distribution/#download-section

It provides different versions to suit different OS. Please select the one you are
using.
Just install according to the default setting, and the environment variables will
be automatically configured after installation.
What is Jupyter Notebook?
The Jupyter Notebook is an open-source web application that allows you to
create and share documents that contain live code, equations, visualizations
and narrative text. Uses include: data cleaning and transformation, numerical
simulation, statistical modeling, data visualization, machine learning, and much
more.

Jupyter Notebook is included in the Anaconda.
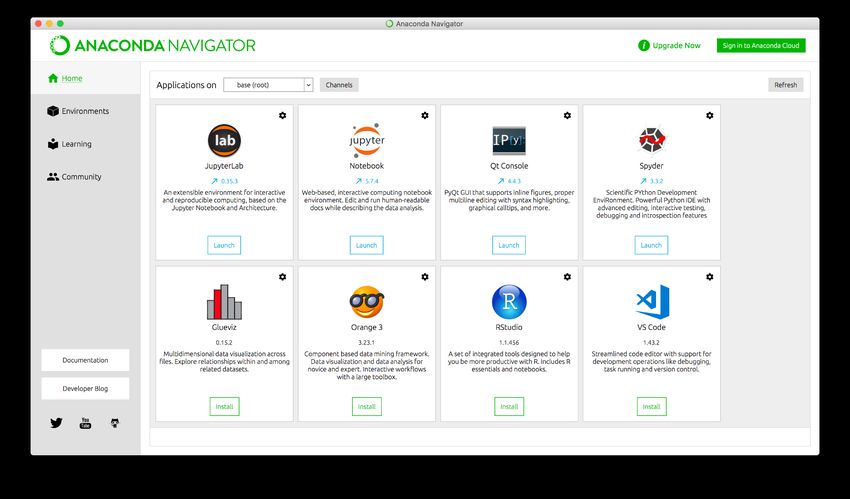
Basic Operation on Jupyter Notebook
After installing the Anaconda, open Anaconda-Navigator as below, and you can
find the Jupyter Notebook on the Anaconda. Then click Launch.

Basic Operation on Jupyter Notebook
Jupyter Notebook is presented as a website. Select the path, then under the
button “New”, choose “Python 3” to open a new python file.

Basic Operation on Jupyter Notebook
Type the code into the input box on Jupyter.
Get started learning Python: https://www.learnpython.org/
Basic Operation on Jupyter Notebook
Click “Run”.
The output will be shown in the blank area right below the input box.
Basic Operation on Jupyter Notebook
Jupyter Notebook will help you
save your code automatically in
“.ipynb” format.

If you want to save the code as
“.py” format.

Here, we just use “.ipynb”
format.
Python Libraries for Data Scientists
Python toolboxes/libraries for data processing:
 ◦ NumPy
 ◦ SciPy
 ◦ Pandas
Visualization libraries
 ◦ matplotlib
 ◦ Seaborn
Machine learning & deep learning
 ◦ Scikit-learn
 ◦ Tensorflow/Pytorch/Theano and many more …
Python Libraries for Data Scientists
NumPy:
 ▪ introduces objects for multidimensional arrays and matrices, as well as
 functions that allow to easily perform advanced mathematical and
 statistical operations on those objects

 ▪ provides vectorization of mathematical operations on arrays and matrices
 which significantly improves the performance

 ▪ many other python libraries are built on NumPy

Link: http://www.numpy.org/
Python Libraries for Data Scientists
SciPy:
 ▪ collection of algorithms for linear algebra, differential equations,
 numerical integration, optimization, statistics and more

 ▪ part of SciPy Stack

 ▪ built on NumPy

Link: https://www.scipy.org/scipylib/
Python Libraries for Data Scientists
Pandas:
 ▪ adds data structures and tools designed to work with table-like data
 (similar to Series and Data Frames in R)

 ▪ provides tools for data manipulation: reshaping, merging, sorting, slicing,
 aggregation etc.

 ▪ allows handling missing data

Link: http://pandas.pydata.org/
Python Libraries for Data Scientists
matplotlib:
 ▪ python 2D plotting library which produces publication quality figures in a
 variety of hardcopy formats

 ▪ a set of functionalities similar to those of MATLAB

 ▪ line plots, scatter plots, barcharts, histograms, pie charts etc.

 ▪ relatively low-level; some effort needed to create advanced visualization

Link: https://matplotlib.org/
Python Libraries for Data Scientists
Seaborn:
 ▪ based on matplotlib

 ▪ provides high level interface for drawing attractive statistical graphics

 ▪ Similar (in style) to the popular ggplot2 library in R

Link: https://seaborn.pydata.org/
Python Libraries for Data Scientists
SciKit-Learn:
 ▪ provides machine learning algorithms: classification, regression, clustering,
 model validation etc.

 ▪ built on NumPy, SciPy and matplotlib

Link: http://scikit-learn.org/
Loading Python Libraries

Press Shift+Enter to execute the jupyter cell, or just click
“Run”.

 19
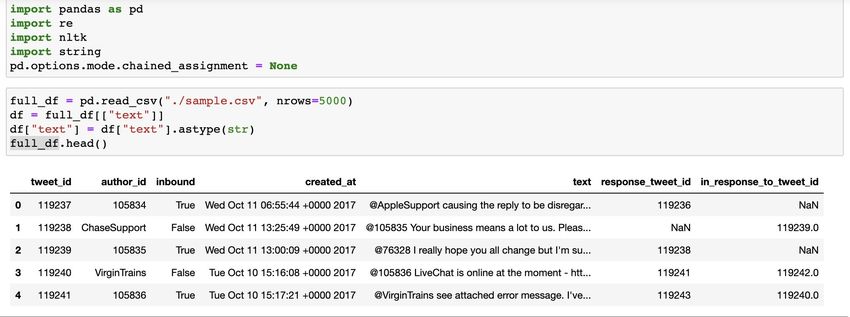
Reading data using pandas
There is a number of pandas commands to read other data formats:
pd.read_excel('myfile.xlsx',sheet_name='Sheet1', index_col=None, na_values=['NA'])
pd.read_stata('myfile.dta')
pd.read_sas('myfile.sas7bdat')
pd.read_hdf('myfile.h5','df')
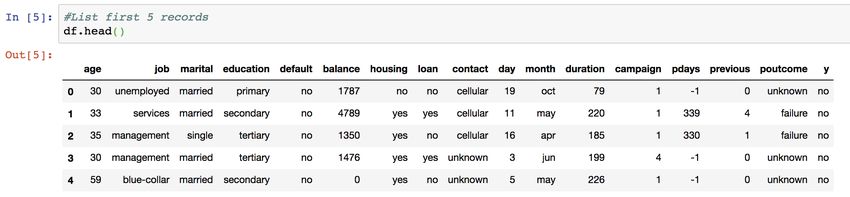
20Exploring data frames ✓ Try to read the first 10, 20, 50 records ✓ Try to view the last few records 21
Data Frame data types
Pandas Type Native Python Type Description
object string The most general dtype. Will be assigned to your column
 if column has mixed types (numbers and strings).
int64 int Numeric characters. 64 refers to the memory allocated to
 hold this character.
float64 float Numeric characters with decimals. If a column contains
 numbers and NaNs, pandas will default to float64, in case
 your missing value has a decimal.
datetime64, N/A (but see Values meant to hold time data. Look into these for time
timedelta[ns] the datetime module in series experiments.
 Python’s standard library)

 22
Data Frame data types

 23
Data Frames attributes
Python objects have attributes and methods.
df.attribute description
dtypes list the types of the columns
columns list the column names
axes list the row labels and column names
ndim number of dimensions

size number of elements
shape return a tuple representing the dimensionality
values numpy representation of the data

 24
Data Frames attributes

 25
Data Frames methods
Unlike attributes, python methods have parenthesis.
All attributes and methods can be listed with a dir() function: dir(df)
df.method() description
head( [n] ), tail( [n] ) first/last n rows
describe() generate descriptive statistics (for numeric columns only)
max(), min() return max/min values for all numeric columns

mean(), median() return mean/median values for all numeric columns

std() standard deviation

sample([n]) returns a random sample of the data frame
dropna() drop all the records with missing values

 26
Data Frames methods

 27
Data Frames methods

 28
Selecting a column in a Data Frame
 Note: If we want to select a column
 with a name as the attribute in
 DataFrames we should use method
 1.
 E.G., Since there is an attribute –
 rank in DataFrame, if we want to
 select the column ‘rank’, we should
 use df[‘rank’], and cannot use
 method 2, i.e., df.rank, which will
 return the attribute rank of the data
 frame instead of the column “rank”.

 29
Data Frame: filtering
To subset the data we can apply Boolean indexing. This indexing is commonly
known as a filter. For example if we want to subset the rows in which the age
value is greater than 50:

Any Boolean operator can be used to subset the data:
> greater; >= greater or equal;
< less;
Data Frames: Slicing
There are a number of ways to subset the Data Frame:
 • one or more columns
 • one or more rows
 • a subset of rows and columns

Rows and columns can be selected by their position or label

 35
Data Frames: Slicing
When selecting one column, it is possible to use single set of brackets, but the
resulting object will be a Series (not a DataFrame):

When we need to select more than one column and/or make the output to be a
DataFrame, we should use double brackets:

 36
Data Frames: Selecting rows
If we need to select a range of rows, we can specify the range using ":"

Notice that the first row has a position 0, and the last value in the range is
omitted:
So for 0:10 range the first 10 rows are returned with the positions starting with 0
and ending with 9

 37
Graphics to explore the data
Seaborn package is built on matplotlib but provides high level
interface for drawing attractive statistical graphics, similar to ggplot2
library in R. It specifically targets statistical data visualization

To show graphs within Python notebook include inline directive:

 46
Graphics
 description
histplot histogram
barplot estimate of central tendency for a numeric variable
violinplot similar to boxplot, also shows the probability density of the data
jointplot Scatterplot
regplot Regression plot
pairplot Pairplot
boxplot boxplot
swarmplot categorical scatterplot
factorplot General categorical plot

 47
Draw Histogram Using Matplotlib

 48
Draw Histogram Using Seaborn

 49
Python for Machine Learning
Machine learning: the problem setting:
In general, a learning problem considers a set of n samples of data and then tries to
predict properties of unknown data. If each sample is more than a single number and,
for instance, a multi-dimensional entry (aka multivariate data), it is said to have
several attributes or features.

We can separate learning problems in a few large categories:
• Supervised Learning (https://sklearn.org/supervised_learning.html#supervised-learning)
 • Classification
 • Regression
• Unsupervised Learning (https://sklearn.org/unsupervised_learning.html#unsupervised-
 learning)
 • Clustering
 55
Python for Machine Learning
Training set and testing set:

Machine learning is about learning some properties of a data set and applying
them to new data. This is why a common practice in machine learning to
evaluate an algorithm is to split the data at hand into two sets, one that we call
the training set on which we learn data properties and one that we call the
testing set on which we test these properties.

scikit-learn comes with a few standard datasets, for instance the iris and digits
datasets for classification and the boston house prices dataset for regression.

 56
Loading an example dataset

A dataset is a dictionary-like object that holds all the data and some metadata
about the data. This data is stored in the .data member, which is a (n_samples,
n_features) array. In the case of supervised problem, one or more response
variables are stored in the .target member.

 57
Loading an example dataset - digits
An example showing how the scikit-learn can be used to recognize images of
hand-written digits.

 58
Loading an example dataset - digits
For instance, in the case of the digits dataset, digits.data gives access to the
features that can be used to classify the digits samples:

and digits.target gives the ground truth for the digit dataset, that is the number
corresponding to each digit image that we are trying to learn:

 59
Learning and predicting
In the case of the digits dataset, the task is to predict, given an image, which
digit it represents. We are given samples of each of the 10 possible classes (the
digits zero through nine) on which we fit a classifier to be able to predict the
classes to which unseen samples belong.

In scikit-learn, a classifier for classification is a Python object that implements
the methods fit(X, y) and predict(T).

An example of a classifier is the class sklearn.svm.SVC, which implements
support vector classification. The classifier’s constructor takes as arguments
the model’s parameters.

 60
Learning and predicting
For now, we will consider the classifier as a black box:

Choosing the parameters of the model
In this example, we set the value of gamma manually. To find good values for
these parameters, we can use tools such as grid search and cross validation.

 61
Learning and predicting
For the training set, we’ll use all the images from our dataset, except for the
last image, which we’ll reserve for our predicting. We select the training set
with the [:-1] Python syntax, which produces a new array that contains all but
the last item from digits.data:

 62
Learning and predicting
Now you can predict new values. In this case, you’ll predict using the last image
from digits.data. By predicting, you’ll determine the image from the training set
that best matches the last image.

The corresponding image is:

 63
Text Processing
(English/Chinese)
Introduction

In any machine learning task, cleaning or preprocessing the data is as important
as model building if not more. And when it comes to unstructured data like text,
this process is even more important.

Hilarious !!!!
Want to know more. Checkout www.h2o.ai for additional information
thnks for readin the notebook
香港是一個國際化的大都市 \o/ :-)
9月16日 (9月16日)
Objective
• To understand the various text preprocessing steps with code examples
• Some of the common text preprocessing / cleaning steps are:
 English
 Chinese
 Lower casing
 Conversion between Full / Half width
 Removal of Punctuations
 Conversion between Traditional /
 Removal of Frequent / Rare words Simplified words

 Stemming / Lemmatization Chinese Word Segmentation

 Removal of emojis / emoticons

 Removal of URLs / HTML tags
Lower Casing

• This is more helpful for text featurization techniques like frequency, tfidf as it
 helps to combine the same words together thereby reducing the duplication
 and get correct counts / tfidf values.
• This may not be helpful when we do tasks like Part of Speech tagging (where
 proper casing gives some information about Nouns and so on) and Sentiment
 Analysis (where upper casing refers to anger and so on)
Lower Casing

Let’s use the “sample.csv” file as
an example. It has many
columns, while we are only
interested in the “text” column.

We create a new column with all
characters lower cased.

For string data structure, it has
built-in function called .lower()
Removal of Punctuations

One another common text preprocessing technique is to remove the
punctuations from the text data. This is again a text standardization process that
will help to treat 'hurray' and 'hurray!' in the same way.
We also need to carefully choose the list of punctuations to exclude depending
on the use case. For example, the string.punctuation in python contains the
following punctuation symbols
 !"#$%&\'()*+,-./:;?@[\\]^_{|}~`
We can add or remove more punctuations as per our need.
Removal of Punctuations We need to get a dictionary to store all kinds of punctuations, i.e. string.punctuation. Once we meet a punctuation in the input text, we will remove it to empty string.
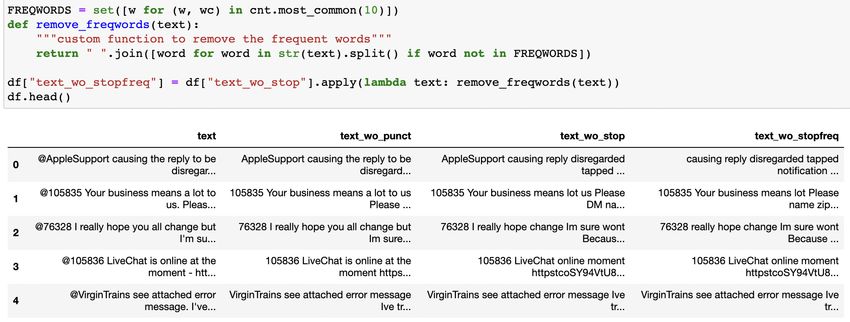
Removal of Frequent / Rare words
• stopwords
 Stopwords are commonly occuring words in a language like 'the', 'a' and so on. They can be removed from
 the text most of the times, as they don't provide valuable information for downstream analysis. In cases like
 Part of Speech tagging, we should not remove them as provide very valuable information about the POS.

 These stopword lists are already compiled for different languages and we can safely use them. For
 example, the stopword list for english language from the nltk package can be seen below.

• Domain specific frequent words
 But say, if we have a domain specific corpus, we might also have some frequent words which are of not so
 much importance to us. So we also need to remove other domain-specific frequent words

 If we use something like tfidf, this is automatically taken care of.
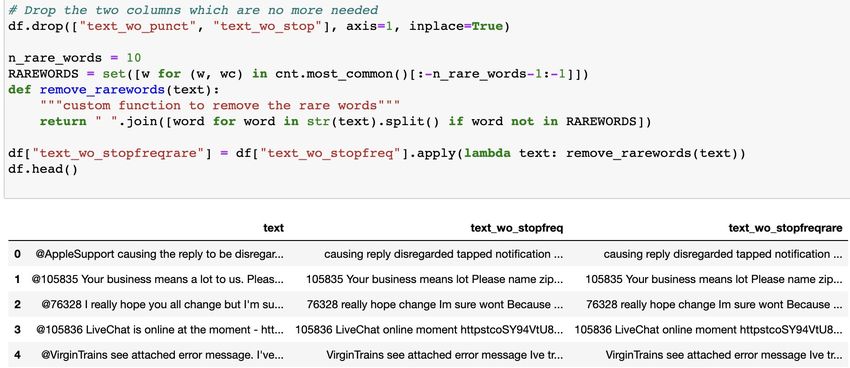
Removal of Frequent / Rare words (Cont)
• Rare word
 The volume of rare words are too small to affect the text analysis results.
 In addition, many rare words are just some noiseeeeeeeeeeeee.
 But sometimes, rare words are important, because they are some unique
 words for a particular domain.
Removal of Frequent / Rare words

 nltk is a package that defines some stop words for you.
Removal of Frequent / Rare words

First, count the frequency for each
word in your corpus.

Remove the most/least frequent
words according to a threshold “n"
( e.g. 10).
Stemming and lemmatization
• For grammatical reasons, documents are going to use different forms of a word, such as organize, organizes, and organizing. Additionally, there
 are families of derivationally related words with similar meanings, such as democracy, democratic, and democratization. In many situations, it
 seems as if it would be useful for a search for one of these words to return documents that contain another word in the set.

• The goal of both stemming and lemmatization is to reduce inflectional forms and sometimes derivationally related forms of a word to a common
 base form. For instance:

• am, are, is => be
• car, cars, car's, cars’ => car
• The result of this mapping of text will be something like:
• the boy's cars are different colors => the boy car be differ color
• However, the two words differ in their flavor. Stemming usually refers to a crude heuristic process that chops off the ends of words in the hope of
 achieving this goal correctly most of the time, and often includes the removal of derivational affixes. Lemmatization usually refers to doing things
 properly with the use of a vocabulary and morphological analysis of words, normally aiming to remove inflectional endings only and to return the
 base or dictionary form of a word, which is known as the lemma . If confronted with the token saw, stemming might return just s, whereas
 lemmatization would attempt to return either see or saw depending on whether the use of the token was as a verb or a noun. The two may also
 differ in that stemming most commonly collapses derivationally related words, whereas lemmatization commonly only collapses the different
 inflectional forms of a lemma. Linguistic processing for stemming or lemmatization is often done by an additional plug-in component to the indexing
 process, and a number of such components exist, both commercial and open-source.
Stemming and lemmatization

nltk also provides some quick
stem function for you.
Therefore, you do not need to
stem every word by yourself.
Stemming and lemmatization

Lemmatization requires additional
corpus called “wordnet” in nltk.

As a result, Lemmatization is
generally slower than stemming
process. So depending on the
speed requirement, we can choose
to use either stemming or
lemmatization.
Stemming and lemmatization

Advanced lemmatization
according to word’s Part-
of-Speech (POS) label.
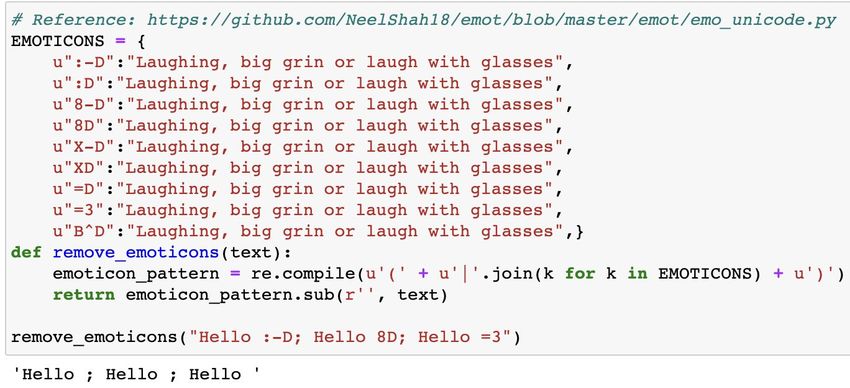
Removal of Emojis / Emoticons
With more and more usage of social media platforms, there is an explosion in the usage of
emojis and emoticons in our day to day life as well. Probably we might need to remove these
emojis for some of our textual analysis.

There is a minor difference between emojis and emoticons.

From Grammarist.com, emoticon is built from keyboard characters that when put together in
a certain way represent a facial expression, an emoji is an actual image.

 :-) is an emoticon

 is an emoji

Please note again that the removal of emojis / emoticons are not always preferred and
decision should be made based on the use case at hand.
Removal of Emojis / Emoticons
 In emojis removal, we use
 a useful python package
 “re” (regular expression).
 “re” allows us to find all
 sub-strings match the query
 regular expression.

In emoticons removal,
emoticons need to be
manually defined.
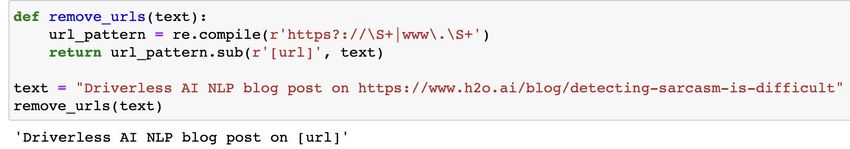
Removal of URLs / HTML tags
Next preprocessing step is to remove any URLs present in the data. For
example, if we are doing a twitter analysis, then there is a good chance that the
tweet will have some URL in it. Probably we might need to remove them for our
further analysis.
One another common preprocessing technique that will come handy in multiple
places is removal of html tags. This is especially useful, if we scrap the data from
different websites. We might end up having html strings as part of our text.
Removal of URLs / HTML tags

We use regular expression
to detect all urls in the
input text. And then
remove all of them.

An alternative is to replace
url to a special token called
‘[url]’ such that the
sentence is still
grammatically correct.
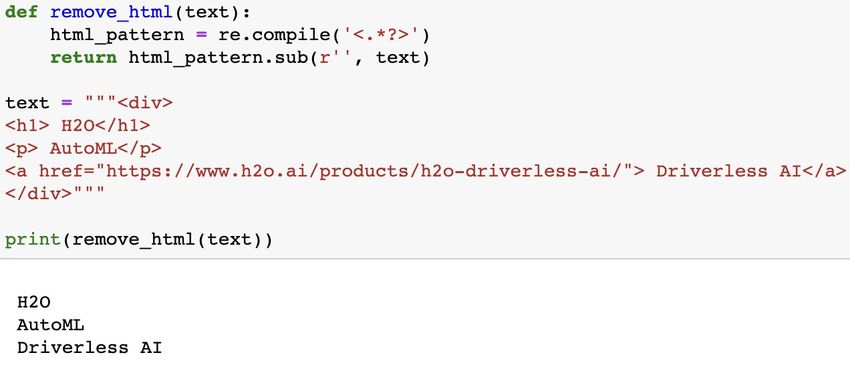
Removal of URLs / HTML tags

Similarly, we use regular
expression to remove all
HTML tags
Conversion between Full / Half width
In CJK (Chinese, Japanese and Korean) computing, graphic characters are
traditionally classed into fullwidth (in Taiwan and Hong Kong: 全形; in CJK: 全角
) and halfwidth (in Taiwan and Hong Kong: 半形; in CJK: 半角) characters.
Unlike monospaced fonts, a halfwidth character occupies half the width of a
fullwidth character, hence the name.
Halfwidth and Fullwidth Forms is also the name of a Unicode block U+FF00–
FFEF, provided so that older encodings containing both halfwidth and fullwidth
characters can have lossless translation to/from Unicode.

 9月16日
 9月16日
Conversion between Full / Half width

ord() would return the
ascII or unicode of a
character.
Conversion between Traditional / Simplified words
Traditional Chinese characters remain in common use in Taiwan, Hong
Kong and Macau, as well as in most overseas Chinese communities outside
Southeast Asia.
Simplified Chinese is widely used in mainland China and Singapore.
We do not want an input text to have both traditional and simplified Chinese
words, because it is hard for human readers to understand and it would also
create a duplicated mention of the same word.
Conversion between Traditional / Simplified words

You will need a dictionary
to record the traditional
and simplified version of
the words.
Chinese Word Segmentation
It's well known that Chinese is an ideographic language and there is no word
delimiter between words in written Chinese sentences. Chinese word
segmentation is to segment a Chinese sentence into some segment, where each
segment is a semantic unit.
Word segmentation becomes the very first task when processing Chinese text
and in turn the accuracy of word segmentation is essential to the performance of
the following procedures.
小明硕士毕业于中国科学院计算所,后在日本京都大学深造
小明/ 硕士/ 毕业/ 于/ 中国科学院/ 计算所/ ,/ 后/ 在/ 日本京都大学/ 深造
小明硕士/ 毕业/ 于/ 中国科/ 学院/ 计算/ 所/ ,/ 后/ 在/ 日本京都大学/ 深造
Chinese Word Segmentation

jieba(结巴)is the most
famous Chinese word
segmentation tool. Here we
use jibe for demonstration
purpose.

Other tools like thulac (made
by Tsinghua), spacy (made by
Stanford) are also very good.

jieba is not included in
Anaconda, you have to
manually install this library.
Text Classification with Python

Yang Haoran
2022-4-1
Overview
▪Movie Review Sentiment Classification
 ▪ train a classification model capable of predicting whether a given movie review is positive or negative.
▪Dataset
 ▪ Moview-review data collected by Cornell University
▪Text Preprocessing
 ▪ Mainly using NLTK and regular expression
 ▪ Converting Text to Numbers
▪Model training and Evaluation
 ▪ Naïve bayes, logistic regression…
 ▪ Confusion matrix…
Dataset
 You can download the sentiment classification dataset from the below Link or course website
 www.cs.cornell.edu/people/pabo/movie-review-data/review_polarity.tar.gz

Contains 1000 positive reviews and 1000
negative reviews.
Dataset
Text Preprocessing
A regular expression is a sequence of characters that specifies a search pattern in text. Usually such patterns
are used by string-searching algorithms for "find" or "find and replace" operations on strings, or for input
validation.

You can also convert the original dataset to pandas’ format, so that you can use pandas to process it.
r+’pattern’
Text Preprocessing \s: match A whitespace character

 \s+: match one or more ….

 [a-zA-Z]: match ASCII characters in the range
 from A to Z and in the range from a to z

 ^[a-zA-Z]: begin with char in a-z or A-Z
Converting Text to Numbers
We use tf-idf to represent a document.
tf: term frequency
Idf: inverse document frequency

max_features: maximum words we use. (Not using whole vocabulary since it may be very large)
we want to use 1500 most occurring words as features for training our classifier.
min_df: the minimum number of documents that should contain this feature. So we only include those
words that occur in at least 5 documents.
max_df: we should include only those words that occur in a maximum of 70% of all the documents. Words
that occur in almost every document are usually not suitable for classification because they do not provide
any unique information about the document.
Training and Evaluation
 Split the whole dataset to train and test set. The split fraction is 0.2.
You can also read