Python Molecular Viewer 1 - Written by Ruth Huey, Sargis Dallakyan and Michel Sanner
←
→
Page content transcription
If your browser does not render page correctly, please read the page content below
Python Molecular
          Viewer

Written by Ruth Huey, Sargis Dallakyan and Michel Sanner

                  The Sc ripp s R esea rch Ins ti tut e
                 Molecula r G raph ics Labora tor y
                    1055 0 N. Tor re y Pi nes Rd .
                 La Jolla, Califor nia 9 203 7-10 00
                                 USA
                           13 Jul y 20 07

                                                          1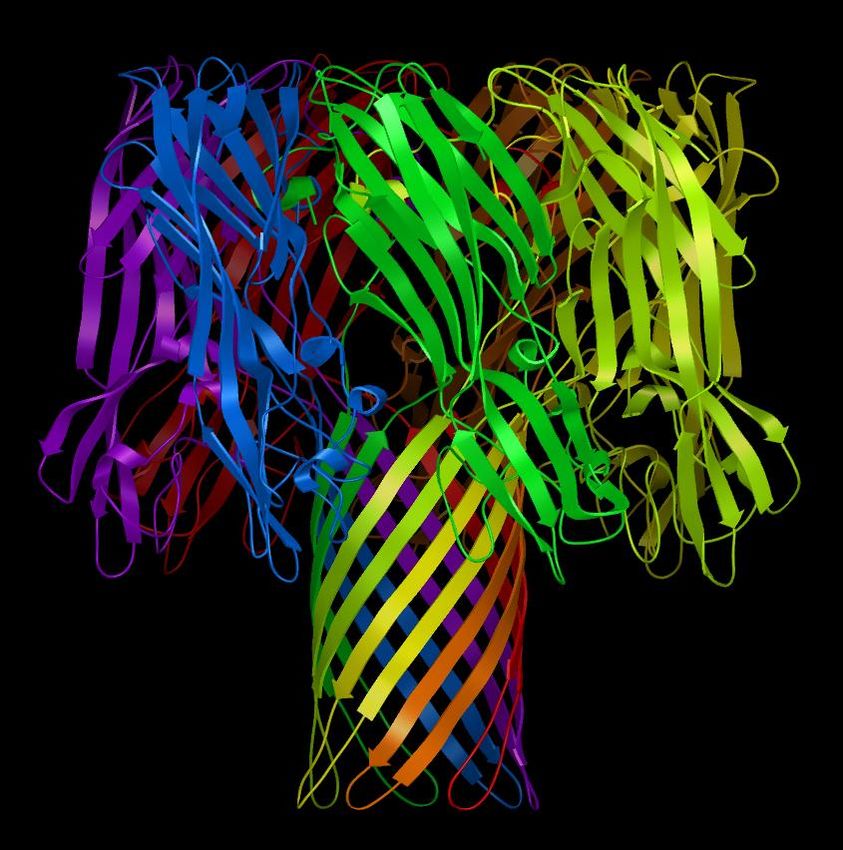
Contents

Co ntents ................................................................. 2

Introdu ction ............................................................ 4
   Before We Start… .................................................................4

FA Q – Fr equ ently Ask ed Q ue stions ............................ 5

Exer cise O ne : Gettin g Start ed: PM V B asic s ................ 8
  Procedure: ............................................................................9
  Summary: what have we learned? ........................................16
  Add-On: Binding Commands to Keys ...................................16

Hem olysin: Sec on dary Stru cture c olor ed by C hain. ..... 17
  Procedure: ..........................................................................17
  Summary: what have we learned? ........................................20
  Add-On: Color by Secondary Structure ................................21
  Add-On: Measure hemolysin beta barrel..............................21

HIV Prot ea se: Acti ve Site R esi due s a nd Inhibit or ........ 22
  Procedure: ..........................................................................23
  Summary: what have we learned? ........................................25
  Add-On: Using the DejaVu GUI ............................................25
  Add-On: Creating an mpeg video file ...................................26

HIV Prot ea se: Bin ding Site Surfac e Col ore d b y Prop erty
........................................................................... 28
   Procedure: ..........................................................................28
   Summary: what have we learned? ........................................32
   Add-On: Intermolecular Hydrogen bonds .............................33
   Add-On: Displaying Interactions ..........................................34

HMG -I(Y)-DN A: Seco nd ary Structu re ........................ 36
 Procedure: ..........................................................................36
 Add-On: Input files for 3D Models .......................................37

Postsc ript: C alculatin g el ectr ostatic p otenti al using
Ada ptive Pois so n B oltzma nn Solver (APB S). .............. 39
  Procedure: ..........................................................................39
  Procedure: ..........................................................................41

App en dix 1: Ad van ce d Displ ay Co ntrol via t h e
Dej aVu GUI. .......................................................... 46
  Procedure: ..........................................................................47

                                                                                        2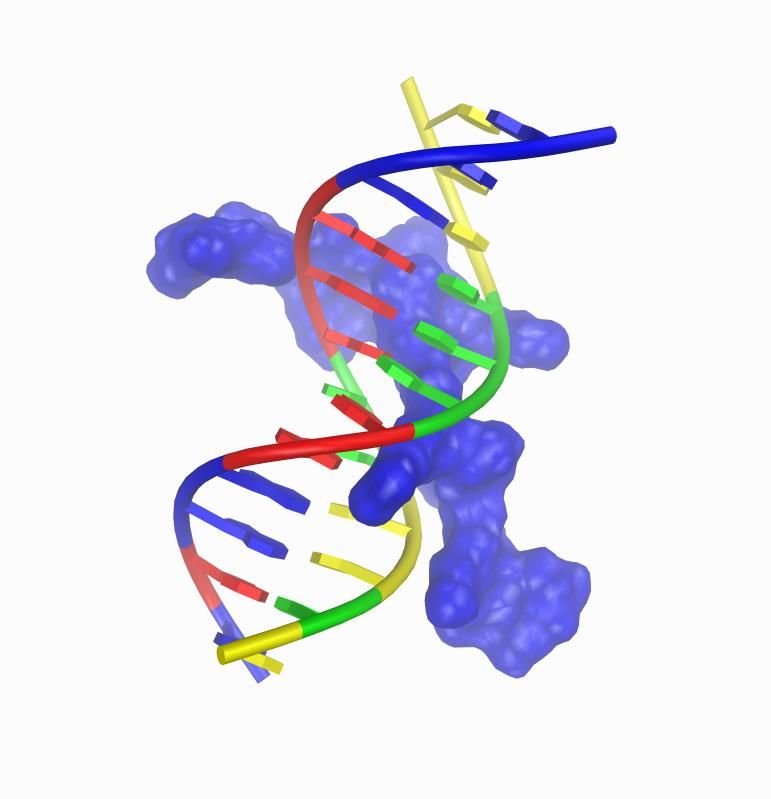
Summary: what have we learned? ........................................54

App en dix 2: Sele cting a sub set ............................... 55
  Procedure: ..........................................................................55
  Summary: what have we learned? ........................................59

App en dix 3: W orking with M olKit in P M V’s P ython sh ell
........................................................................... 61

App en dix 4: P MV StartU p Optio ns ........................... 64

App en dix 5: P MV M od ules ...................................... 66

App en dix 6: Mo use M odifier s and Key stro kes
reco gniz ed by t he D eja Vu Vie wer ............................ 71

App en dix 7: Cu stomiz ation O ption s and D efa ult Valu es
for Us er Pr efer enc es ............................................... 72
  Customization Options for PMV............................................72
  user_prefs defaults: .............................................................72

App en dix 8: D efinitions of N am ed Re sidu e an d At om
Set s re co gniz ed by P MV ......................................... 74

                                                                                       3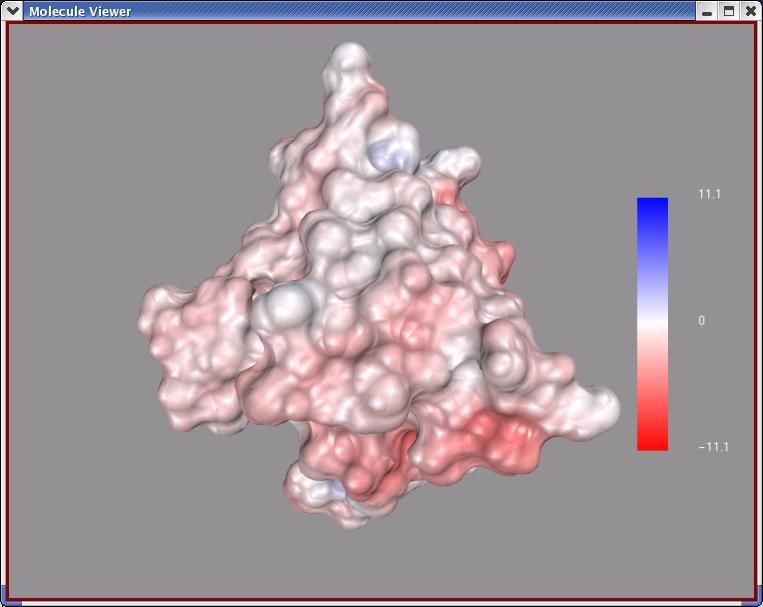
Introduction

This tutorial will introduce you to PMV, which is short for
Python-based Molecular Viewer. It is a general purpose,
OpenGL-based viewer which supports interactively viewing
molecules. It provides an extensible set of tools for displaying
and editing molecules.

Before We Start…
     Since PMV is distributed as a part of MGLTools, we need
     to download and install MGLTools first. Go to our website:
     http://mgltools.scripps.edu, click on “Downloads”, and
     download current release (1.4.5) of MGLTools
     corresponding to your operating system.

     Please read “Instructions” for information on how to install
     MGLTools. Once MGLTools is installed, you can start
     PMV either by clicking on the PMV icon -        - or by
     running the “pmv” script from the command line∗.

∗
 People attending the tutorial given at TSRI can also use PMV installed on TSRI network:
/mgl/prog/share/bin/pmv14

                                                                                           4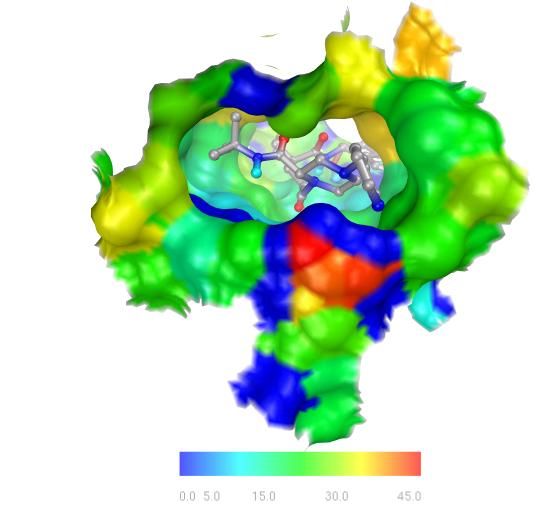
FAQ – Frequently Asked Questions

  1. Where can I find the download site for PMV?
  http://mgltools.scripps.edu under the Downloads link…

  2. Where should I start PMV?
  If you are working on a computer on the network at TSRI,
  you can start PMV in any directory. See instructions of
  page 4. If you are using a local installation of PMV, start it
  according to the instructions which came with it.

  3. How do I customize PMV according to my personal
     preferences?
  PMV will source a preference file, “_pmvrc” in the
  .mgltools/###/Pmv directory located in your home
  directory where ### is the number of the version you are
  running. The preference file can contain a list of PMV
  commands to be executed when the Viewer starts. For
  example, it is possible to set the font type and size in the
  _pmvrc. If you prefer to work with a ‘docked’ camera, you
  can set this in the _pmvrc. You can further customize
  PMV using a second _pmvrc file located in the directory
  where you start PMV. If another _pmvrc exists in the
  directory where you start PMV, it will be sourced after the
  one located in your home directory/.mgltools/###/Pmv .
  Also, it is possible to customize PMV on the fly. PMV
  uses a dictionary of user preferences which can be set
  interactively. It is accessed from PMV via:
  File ➞ Pr efer enc es ➞ Mo dify Def aults

  4. What documentation is available?
  http://mgltools.scripps.edu under the Documentation link
  has links to various forms of information such as Latest
  FAQs, Latest How-tos, Latest Tutorials, Latest Glossary
  Definitions among others. Documentation in the code
  itself is available in PMV under the Help button. For
  citations, you can use the citation command in the Help
  menu which gives this reference for PMV: Michel F.
  Sanner. Python: A Programming Language for Software
  Integration and Development, J. Mol. Graphics Mod. 17,
  57-61 (1999).
                                                               5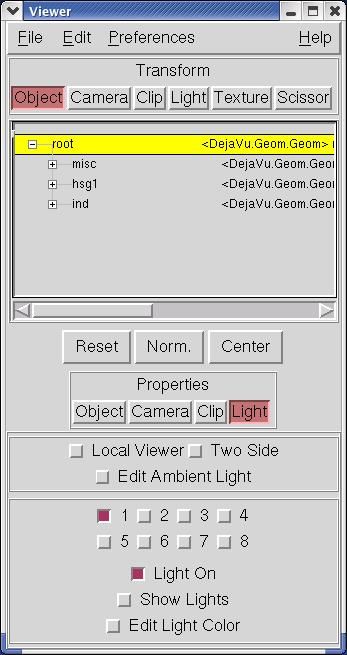
5. Where can I get help finding specific commands?
Descriptions of specific modules and the commands they
contain can be accessed in PMV itself via Help-
>Commands Documentation.
Also, you can search for commands in PMV via Help-
>Search For Commands. This lets you find commands
from strings you enter. For instance, searching on
“closecontacts” reveals that a command
“checkForCloseContacts” exists in the repairCommands
module.

6. How do I report bugs?
Bugs can be reported directly from PMV via Help-
>BugReport. A widget opens which lets you immediately
report any problems you encounter with PMV. Bugs can
also be reported via MGLBuzilla, our bugs and issues
tracking system (mgldev.scripps.edu/bugs). Before
entering a new bug, search MGLBugzilla to see if the bug
you have encountered has already reported. In some cases
the bugs have also been fixed. If so, it may be possible to
obtain a corrected module from the cvs repository. (cvs
stands for Concurrent Versions System)

7. How can I access the cvs repository?
This is covered in the following How-to:
http://mgltools.scripps.edu/documentation/how-to/
anonymous-access-to-our-cvs-repository

8. Whom do I contact with ideas/suggestions for added
   functionality?
This can be done using MGLBuzilla or by sending email to
mgltools@scripps.edu.

9. Is there a mailing list for Pmv?
Yes. Send messages to pmv@scripps.edu. To subscribe to
this list go to mgldev.scripps.edu/mailman/listinfo/pmv.
Type in your email address and name (optional) and choose
a password, then click “Subscribe”.

10. Can I view molecules in stereo in PMV? How can I
    change the stereo separation distance?
Yes. You can switch from mono to stereo by clicking on
the mono/stereo checkbutton on the PMV GUI . It is also
possible to adjust the stereo separation distance using a
visual programming environment (Vision) network. To do
                                                          6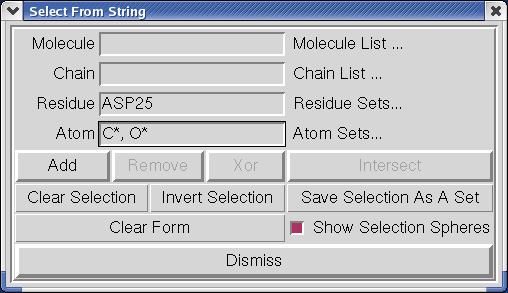
so, start a Vision network editor by clicking on the
checkbutton labeled “Vision” on the right edge of the PMV
GUI. In the network editor which opens, load the 3D
Visualization library. Find StereoSep in the macros
panel and drag it onto canvas. Right click on this
StereoSep node to display a list of possible actions and
choose Expand Node. In the expanded representation of
this node, you can directly access a Dial which lets you
adjust the stereo separation distance interactively. Click on
the Dial and drag to adjust the separation distance.

                                                            7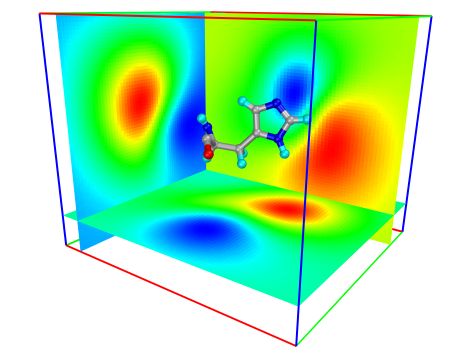
Exercise One: Getting Started: PMV Basics

                   This exercise covers five basics of using PMV:
                              • loading and interacting with molecules
                              • graphical representations of molecules
                              • executing commands
                              • picking objects in the Viewer
                              • starting pmv with options

                   When you start PMV, a docked camera and a control panel
                   open. Place the cursor over icons in Tool bar for more info.

      Menu bar
      Tool bar
      →→→→→
      Tool bar

                                                 3D Viewer

Dashboard widget

       Info bar

                                                                                  8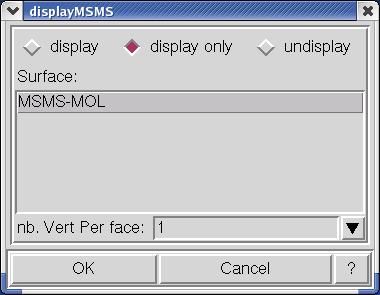
Note: You can submit bug reports directly from the         Various menubuttons, such as File, Edit, Display and Help,
Help menu in PMV. If you encounter any bugs
today, please submit them! If you have any
                                                           are located on the Menu bar. Icons on the Tool bar provide
suggestions or feature requests, we’d like to hear         quick access to most commonly used functions such as:
about them, also…

                                                                Read Session                        Float Camera
                                                                Save Session                        DejaVu GUI
                                                                Undo                                Vision
                                                                Clear Selection                     Toggle Mono/Stereo
                                                                Picking Commands                    AutoDockTools
                                                                Python Shell                        Cartoon Rendering
                                                                Message Box                         Volume Rendering

Note: Some keys modify the picking event. That is,
                                                           The PCOM bar, which is displayed and activated by clicking
if you hold down one of these modifier keys while          on the Picking Commands icon, lets you bind commands to
you click on the left mouse button, a different type of
picking event occurs which can be linked to a
                                                           picking events. A picking event occurs when you click on the
different command. The keys recognized by the              left mouse button while the cursor is over a geometry in the
Viewer are listed in Appendix 6.
                                                           Viewer. The Dashboard widget lists all molecules currently
                                                           loaded in PMV and provides quick access to various PMV
                                                           commands. The Message Box, which is displayed below the
                                                           Viewer when the Message Box icon is clicked, displays the log
                                                           of recently executed commands. The Info bar contains
                                                           information about the current keyboard modifier to picking, the
                                                           time used for the last command, the number of entities in the
                                                           current selection, a menu used to set automatic movement of
                                                           the objects in the Viewer, information about frame rate and the
                                                           progress of the current operation.

                                                           Procedure:

Note: Commands available via the Dashboard can             1. Load a Molecule:
also be invoked using the menus at the top of the
PMV GUI. Here you could use this menu sequence
to open the file browser:                                     A. Position the cursor over PMV Mol ecul es in the
                                                              Dashboard and click with the right mouse button.
File -> R ea d Mol ecule
                                                              This will open a file browser listing all the files in the
                                                              current directory which have extensions in the list of input
                                                              types we support at present. These types include ‘cif’,
                                                              ‘mol2’, ‘pdb’, ‘pqr’, ‘pdbq’ among others.

   Note: Instead of using the mouse to click on the
                                                              B. Select hsg1.p dbq s and click on Open . This results in
   Open button in the GUI, you could also press               loading the molecule hsg1 into PMV and displaying
   the  key on the keyboard while the cursor           covalent bonds between its atoms as lines. By default,
   is still in the entry. This is true for many parts of
   the GUI in PMV, but not for all of them….                  bonds are built based on the distances between atoms and
                                                              are represented as lines while non-bonded atoms, such as
                                                                                                                             9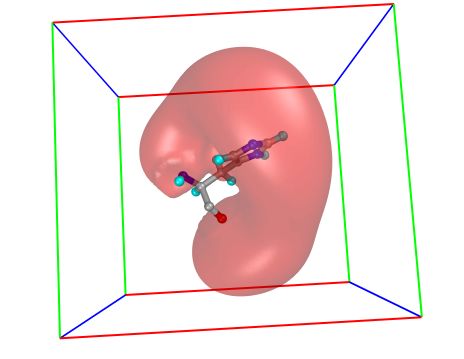
Note: You can change, add or remove commands
which are applied to new molecules via:
File ➞ Preferen ces ➞ Set Com mands to
be Applied on Obje cts Click on the button                        metal ions and oxygen atoms of water molecules, are
for colorBy AtomType to display new molecules                     shown as small 3D crosses.
colored by atom type….

                                                               2. A tour of the Dashboard Widget:

         Select entry + Command Buttons →

         Tree Widget

Note: Clicking on a shape - rectangle, circle, square or          The Tree Widget on the left lists all molecules currently
diamond - under a command causes the command
linked to the shape to be applied to each node in the             loaded in PMV. Click on the arrows      to navigate
corresponding row. If the shape is off (colored white),
the command will be applied to nodes and the shape will           between molecules      , chains    , residues    and atoms
be colored red. If the shape is on (colored red), clicking
on the command button will undo the command and the                   . Clicking on a shape in one of the columns in the right
shape will be colored white. Circles are used for
display commands, squares for label commands and
                                                                  section executes the PMV command corresponding to the
diamonds for color commands. Coloring can be                      label at the top of the column on the group of nodes
replaced by a different coloring scheme but cannot be
undone. The gray rectangle is used for show/hide and
                                                                  corresponding to the row. There 16 different commands
the white rectangle for select.                                   that can be executed this way - gray rectangle(Show/Hide),
                                                                  select/unselect (Sel.), display lines(Lines), display CPK
                                                                  (CPK), display sticks and balls (S&B), display secondary
                                                                  structure (Rib.), display molecular surface (MS), display
                                                                  labels (Lab.), color by atom type (Atom), color by
                                                                  molecule (Mol), color by chain (Chain), color by residue
                                                                  according Rasmol (RAS), color by residue according
                                                                  Shapely (SHA), color according to David Goodsell colors
                                                                  (DG), color by secondary structure element type (Sec.Str.)
                                                                  and color by instance (Inst).

                                                                  To help users see the connection between molecular
                                                                  fragments and PMV commands, a crosshair is drawn when
                                                                  cursor is inside the Dashboard widget.

                                                                  Right-clicking on a shape displays an input parameter panel
                                                                  for the command and allows the user to customize specific
                                                                  input parameters for the command.

   Note: A selection in the Tree is used to build a               The Sel: entry in the top left corner of the Dashboard can
   group of nodes to be the target for commands linked
   to shapes. It is not the same as the current selection in
                                                                  be used to select entries in the Tree using a Pmv compound
   the Viewer. It can be selected using the appropriate           selector. Nodes matching the specified string will be
   rectangles….
                                                                  selected. Selected nodes are outlined with a yellow
                                                                  selection box. When a shape is clicked for a selected node,
                                                                  the corresponding command is applied to all currently
                                                                                                                              10
selected nodes. Hovering over this entry shows samples of
the required syntax.
The option menu on the top allows the user to specify
whether commands should be applied to the backbone
atoms only (BB), the side chain atoms only (SC), the
sidechain atoms and CA atoms (SC+CA) or the full
molecular fragment (ALL). This setting can be overridden
for each column (CMD).
Click on the gray rectangle under Show/Hide. Notice that
the molecule in the viewer disappears. Click on the same
rectangle again to redisplay it. Click on the rectangle
under the Sel level to select or deselect all. Experiment by
clicking on each of the other buttons. These are short cuts
to a basic set of commands for displaying and coloring
various molecular representations which we will cover in
step 5.
3. Mouse Bindings:
Note: you can customize the mouse bindings
(and other user preferences) in a _pmvrc You can directly interact with the molecules in the PMV
preference file which will be sourced
whenever you start PMV. Viewer with your computer’s mouse or touchpad. By
default, PMV is configured to work with a three-button
mouse. The mouse buttons can be used alone or with a
modifier key to perform different operations. To zoom the
molecule (make the molecule look bigger or smaller) in the
Viewer window, press and hold down the key and
then click and drag with the middle mouse button. To
rotate the molecule, just click and drag with the middle
mouse button. To summarize what the mouse buttons do:
On Apple Computers:
Butto n
optio n : Rotate
Left Middl e Right
com man d : Translate left/right M od
Translate left/right
shift +o ption : Scale or Zoom
Non e Pick Rotate (X) and up/down
shift +c omm an d : Translate in/out (Y)
Shift Select
Scale or Translate in/out
Note: as you translate a molecule out in the Z Zoom (Z)
dimension, it will disappear into the fog which
is used for depth-cueing.
11You can also press the following keys in the Viewer
window to change the view of the molecule:
Key Action
R Reset view
N Normalize – scale so all visible molecules fit in the Viewer
C Center on the center of gravity of all the molecules
D Toggle on/off Depth-cueing (blends molecule into
background farther away)
Note: By default, the Viewer’s current object
is root so you will not see any changes here if
you toggle between transform root and
T Toggle between transform root (ie scene) and transform the
transform current object. The Viewer GUI lets
Viewer’s current object
you change the current object. This is covered
in Appendix 1.
4. Color molecular representations (i.e. geometries):
Note: here the menu equivalent is
Color ➞ by Atom Type
Each row in the Dashboard is linked to a single entity. The
Click on All Geometri es and then click
entity is either PMV Molecules which is the group
OK .
Most PMV menu commands can be undone. comprised of all the Molecules in the Viewer, a single
ColorByAtomType is one of them. Try it Molecule, a single Chain, a single Residue or a single
out by clicking on the Undo button (curved
arrow icon) or this sequence: Atom. The diamonds on the right side of the Dashboard
Edit->UndoColorByAtom are used to color the displayed geometries for that row’s
Before going on, redo colorByAtom type.
entity by different coloring schemes.
A. In the PMV Molecules row, click on the diamond
under Atom to color the lines by Atom Type. In this
coloring scheme, all of the displayed objects will be
colored according to the chemical element, as follows:
○ Carbons that are aliphatic (C) - white,
●Nitrogens (N) - blue,
● Oxygens (O) - red,
● Sulfurs (S) - yellow,
● Hydrogens (H) - cyan.
12In the color scheme developed by David B. Click on the other diamonds in the row to try coloring
Goodsell (mgl.scripps.edu/people/goodsell),
acidic residues such as ASP and GLU are
the lines by the other available coloring schemes which
colored red while basic residues such as include by Molecule, by Chain, using Rasmol residue
LYS and ARG are colored blue. The more
acidic or more basic the residue the more
colors, using SHApley residue colors, using David
saturated the color used to display it. Sulfur Goodsell atom colors, by Secondary Structure element
atoms are colored yellow. Neutral atoms
such as carbons are white.
type and by Instance.
5. Display options for molecules:
The circles on the left side of a row in the Dashboard are
Note: here the menu equivalents are:
Display ➞ CPK
used to display different geometries for the entity
corresponding to the row.
Display ➞ Sticks And Balls
Display ➞ Secondary Stru cture A. In the PMV Molecules row, click on the circle under
CPK to display hsg1 with a sphere for each atom whose
Display ➞ Mole cular Surfa ce
radius depends on the element of the atom.
The MSMS Parameters Panel lets you set a
Surface Name for the surface, whether to B. Undisplay CPK by clicking on the circle again.
calculate the surface Per Molecule, the Positioning the cursor over a circle and clicking with the
probe radius which determines the
bumpiness of the surface and the density of right mouse button opens an option panel for that display
the triangles used in drawing the surface command. For CPK, you can adjust the radii, scaling each
where the more triangles the smoother the
surface. Use the default name MSMS-MOL by a constant factor and/or adding a constant to each.
and default probe radius, 1.5. For a
smoother surface set the density to 2.0. C. Try displaying hsg1 with S&B (Sticks and Balls), Rib.
Then click on OK . (secondary structure), and MS (molecular surface).
D. Right click on the MS circle to open the MS options
widget. In the widget which opens, click on the square
labeled Per Molecule. Click on the MS circle again. With
Per Molecule turned off, the molecular surface is calculated
only for the chain so the result is a closed surface. When
calculated Per Molecule, calculating a molecular surface on
a Chain results in a surface fragment.
6. Color a single representation:
Note: here the menu equivalents are:
Color ➞ by Chain A. Click on the other circles in the row to undisplay all
geometries except CPK.
Display ➞ CPK
click on undisplay . B. Color it by chain by clicking on the diamond under
Chain. Note that each chain in hsg1 is colored a different
color. We chose to color only the CPK geometry by Chain;
the lines are still colored by Atom. To see this for yourself,
use the circles to hide the CPK geometry and to display
lines. Note that the lines are still colored by Atom.
13You can see all the files you have opened 7. Load a second molecule:
with File-> Recent Files,
A. Position the cursor over PMV Mol ecul es in the
Dashboard and click with the right mouse button. This
opens the file browser again.
B. Select indinavir.p db q and click on Open . Now a
second Molecule named ‘indinavir’ has been loaded into
PMV.
Note: the menu equivalent is:
Display ➞ Show/Hide Mole cule C. Using the circles in their respective rows, try displaying
Click on the red circle at the top left of this indinavir only, switch to show only hsg1, hide both
widget (or X at the top right) to hide this
widget. molecules, redisplay both.
8. Picking commands:
PCOM stands for “picking command” (earlier versions
used ICOM for “interactive command”– they are the same
Note: When you click on the left mouse thing). A pick happens when you position the cursor over
button with the cursor over the Viewer,
there may be multiple objects in the tiny an object in PMV and left-click with the mouse (possibly
picking ‘rectangle’ next to the cursor, If while holding down a keyboard modifier key, such as
there is more than one object, the closest
object in the z dimension is ‘picked’. , or ). The result of the pick is that the
picking command is applied to the picked object. The type
of the picked object is determined by the PCOM level. For
instance, if the PCOM level is Atom, the pick will return
an atom. Alternatively, picking can be done by dragging
the mouse while holding down the left mouse button. In
this case, all the objects in the dragged rectangle are
picked. When the PCOM is printNodeNames and the
PCOM level is Atom, the names of the picked atoms are
printed in the Message box. By default, the PCOM is set to
selecting at the Atom level.
A. Click on the Pointing Finger button to display the
picking command controls:
PCOM level: is a drop-down menu which lets you set the
level of object(s) to be picked. By default the level is set to
Atom. Consequently picked objects are Atoms.
B. Click on Atom = to display other levels.
With 4 different modifiers, None, Shift , Ctrl and Alt , up
to 4 different picking commands can be used at the same
time. The commands are bound to these four via the 4
drop-down menus here:
printN od eN am es = bound to picking with no modifier
14Shift: N one = no command bound to picking + Shift
key
Ctrl.: N one = no command bound to picking +
Control.
Alt: N one = no command bound to picking + Alt.
Note: PMV uses a tree data structure PMV uses a hierarchical data structure to represent
composed of these four levels. The nodes
within a level are siblings. Each node,
molecules. There are four levels in this hierarchy, and each
except for those of the lowest level-Atom, level can include many instances of the structures at the
has children which is a set of nodes in
the next level down. Each node, except
next lowest level. In order from highest to lowest, these
for those of the highest level-Molecule, levels (and their PMV color code) are:
has a both a parent and a top. For an
atom, its parent is a residue while its top
is the molecule to which it belongs. Its
siblings are the other atoms in the same
■ Molecule - red
residue. See Appendix 3 for more details. ■ Chain - cyan
■ Residue - green
■ Atom - yellow
In this section, we will use the mouse to pick on the objects
in the Viewer to find their names.
C. Using the mouse, position the cursor over a line and
click the left mouse button. Change the PCOM command
to PrintNodeNames by clicking on the down arrow to the
right of select to display the list of possible picking
commands. Scroll down by dragging the rectangular box
on the top right side of the list until you can see
printNodeNames. Click on it to set the PCOM.
D. Open the Message Box by clicking on the Message Box
button and look at the text which appears below the
Viewer.
E. Change the PCOM level from Atom to Residue and
click again. Try clicking somewhere else. You can pick
on a region by dragging, that is: hold the left-mouse button
down while you move the mouse. Try it on a small region.
Look at the message which appears when you pick on hsg1
with the PCOM level set to Chain.
Note: See Appendix 4 for more details 9. Starting PMV using command line arguments
on available startup options.
PMV will automatically load a molecule for each filename
with a recognized extension listed after ‘pmv’. Thus we
could have used this shortcut instead of steps 1 and 5.
15For TSRI tutorials only:
On linux machines: Preface pmv with the path to your local installation of
/home/user##/MGLTools/share/bin/pmv MGLTOOLS:
On mac os X:
/Library/MGLTools/share/bin/pmv $MGLTOOLS/pmv hsg1.pdbqs indinavir.pdbq
Summary: what have we learned?
1. PMV can load multiple molecules from a variety of file
types. These molecules can be displayed and colored with
different coloring schemes independently.
2. Any geometry can by colored by properties of the
underlying entities.
3. Picking in the Viewer can be bound to commands acting on
Atoms, Residues, Chains or Molecules using optional
keyboard modifiers.
4. PMV startup options allow you to specify molecules to
load and how they are to be displayed.
Add-On: Binding Commands to Keys
PMV allows you to bind executing a command on a particular
set of entities to a keystroke. This provides a useful
mechanism for repeated actions. To demonstrate this, we will
bind displaying the first 10 atoms as CPK to the F1 key.
Open the Python Shell by clicking on the Python-Shell button
which is sixth button on the Button bar and type this:
Note: Instead of typing these lines
you could use mv.bindCmdToKey(“F1”, “None”, mv.displayCPK, \
File ➞ Read ➞ Python (mv.allAtoms[:10],))
or Session scr ipts In the file
browser which opens select mv.bindCmdToKey(“F2”, “None”, mv.displayCPK, \
bindCmdToKeyExample.py and (mv.allAtoms[:10],), {‘negate’:True})
click on Open.
Now click the F1 key. You can undisplay the CPK
representation of these atoms using the F2 key.
Close the Python Shell by clicking on the Python-Shell button.
Note: You could delete one or more
molecules using Edit -> Delete -
> Delete Mol ecul e . In the widget Before going on, clean up!
which opens you can select a single
molecule to delete or you can use the
control key to select more than one Delete all the molecules in the Viewer.
molecule to delete. You will still be At this point we will delete all the molecules.
asked whether you wish to
Continue or not.
Edit ➞ D elete ➞ D elet e All Mol ecul es
You will be asked if you wish to continue because deleting
cannot be undone. Click on Continu e .
16Hemolysin: Secondary Structure colored by
Chain.
image courtesy of David Goodsell, TSRI
Procedure:
1. Load hemolysin:
A. Position the cursor over PMV Mol ecul es in the
Note: You can also use File Read
PDB from RCSB.org menu to load
Dashboard and click with the right mouse button.
hemolysin. Type 7ahl for the PDB ID and
press OK to fetch this molecule from the B. In the file browser which opens, select 7ahl.pd b and
web.
click on Open .
172. Construct a representation of the secondary structure of
7ahl and display it:
Note: Representations of more sophisticated
molecular properties are possible using the A. Click on the circle under Rib. in the 7ahl row of the
PMV module secondarystructureCommands,
Secondary structure representations of a
Dashboard.
molecule show sections of alpha helix as
rectangular strips [extruded circles], beta The displayed secondary structure, an example of a beta barrel,
sheets as arrow-capped strips [extruded is composed of 46 sections of alpha helix, beta sheet, random
arrows] and turns and random coils as thin
tubes [extruded circles]. coils and turns. 7 Coils, 9 Strands, 1 Helix and 6 Turns for
each Chain.
3. Color the secondary structure to distinguish the chains:
A. Left-click on the diamond under Chain in the 7ahl row
of the dashboard to open the colorByChains widget.
B. Click on secondarystructure and OK.
Notice that each of the 7 chains in 7ahl is colored a different
color. We chose to color only the secondarystructure geometry
by Chain; the color of lines is unchanged.
4. Clean up by removing the lines and adjust the view.
A. Click on the red circle under Lines in the 7ahl row of
the dashboard to undisplay the lines.
B. Use the middle mouse button to position 7ahl so that
you are looking down the cylinder at the center of the
molecule.
In the final steps we will customize the colors of chains B, D, F
and G to achieve the rainbow effect.
5. First label the chains to help keep track in this process.
A. Display ➞ L ab el ➞ by P ro pertie s
B. In the widget which opens, change the PCOM level to
Chai n and choose nam e from the list of properties.
C. Click on Label setting s to open the ChainLabels
widget.
D. Set global scale to 5 and close this ChainLabels widget
by clicking on the top left red button or top right x.
E. Select First for Label Location.
F. Finally click on OK in the LabelAtom by properties
widget.
Using the labels, notice the chains are ordered clockwise from
A to G. Here are the default colorings of the 4 chains we’ll
18change and the new custom colors we’ll apply in the following
steps 6-10:
Chain A is Blue
Chain B is Green ➞ Magenta
Chain C is Red
Chain D is Cyan ➞ Orange
Chain E is Yellow
Chain F is Magenta ➞ Yellow-Green
Chain G is Cyan ➞ Green
6. Color chain B magenta:
Note:. In PMV the current selection
is a particular homogeneous subset of
the Atoms, Residues, Chains or A. Select chain B:
Molecules currently loaded in the
Viewer. It cannot contain entities of Click on the gray rectangle next to B in the Dashboard.
different levels such as Residues and
Atoms. The current selection plays a B. Color its secondary structure magenta.
pivotal role in PMV because most
commands, such as display, color label
etc, operate on the current selection.
Col or ➞ C ho os e Col or
The current selection is dynamtic: it
can be modified, saved, cleared or Click on secon dary structur e in the color widget which
Note: youSee
restored. canAppendix
also use Direct Select to
2 for more
unselect
details. chain B. In PMV there are opens and then click OK .
often several ways to do things. For
sanity reasons, we will not try to cover In the Choose Color widget which opens next, click on the
them all.
magenta button and on DISMI SS .
C. Unselect chain B by clicking on its gray rectangle.
7. Color chain D orange
A. Select chain D by clicking on its gray rectangle.
B. Color its secondary structure orange.
Col or ➞ C ho os e Col or
Click on secon dary structur e in the color widget and then
click OK
In the color chooser widget, click on the red button and
Edit ➞ Edit Sele cte d Colo r to open a color wheel for
customizing the color.
In the color wheel, move the tiny box into the orange
region by clicking on it with the left mouse button and
holding the mouse button down while you drag it onto the
orange edge of the color wheel. Click on DISMI SS
C. Unselect chain D by clicking on its gray rectangle.
8. Color chain F yellow-green.
19A. Select chain F by clicking on its gray rectangle .
B. Color its secondary structure yellow-green.
Col or ➞ C ho os e Col or
Click on secon dary structur e and then click OK
In the color chooser widget, click on the yellow button and
Edit ➞ Edit Sele cted C olor
In the color wheel, move the tiny box into the yellow-green
region and click on DISMISS
C. Unselect chain F by clicking on its rectangle.
9. Color chain G green.
Note: You may notice that the blue and A. Select chain G by clicking on its gray rectangle.
the red chains stand out (‘leap out’)
from the other colors. You can modify B. Color its secondary structure green.
this by changing the saturation of
these two colors using the color wheel. Col or ➞ C ho os e Col or
Saturation is the amount of white
mixed into the color. Saturated colors
have no white. Saturation varies along Click on secon dary structur e and then click OK
the radius of the wheel. Decrease the
saturation of a chosen color by In the color chooser widget, click on the green button and
dragging the tiny box toward the center
of the color wheel circle.
DISMISS
In the color wheel, move the tiny box into the yellow-green
region and click on DISMISS
C. Unselect chain G by clicking on its rectangle.
Note: Alternatively you could select
10. Clean up by removing the chain labels.
all the chains by clicking on the first
one and holding down the shift key A. Click on each red Lab. square in Dashboard.
while you click on the last. Then click
on a single red Lab. Square to turn
them all off at once. Summary: what have we learned?
1. Pmv can display secondary structural properties of proteins
using different geometries for alpha helix, beta sheet, turns
and random coils.
2. In Pmn, commands are applied to the current selection.
This is a homogeneous set of entities which are atoms,
residues, chains or molecules.
3. Individual entities can be directly selected or deselected.
4. Geometries can be labeled according to properties of the
underlying entities.
5. Specific geometries can be colored using a custom color.
20Add-On: Color by Secondary Structure
Note: PMV colors secondary structure using
the color appropriate for the alpha carbon of the
corresponding residue for each section of
Position the cursor over the diamond under Sec. Str. and click
secondary structure. Thus secondary structure with the left mouse button. This view of Hemolysin shows that
should not be colored by per atom schemes.
ColorByAtom would result in a white geometry
the secondary structure of each of the seven identical chains is
because that is the CA color. composed of beta strands which are yellow, an alpha helix
which is pink, random coils which are white (turns would be
colored blue).
Add-On: Measure hemolysin beta barrel
Set the picking command (PCOM) to measureDistance by
clicking on the Picking COMmands ICON to display the
PCOM Bar and then clicking on the down arrow next to the
first entry to scroll down to measureDistanceGC. Click on
measureDistanceGC.
Now left-mouse clicks in the viewer are bound to measuring
distances. Left-click somewhere on the top edge of the
Note: You may want to redisplay the lines
to make it easier to pick on specific atoms.
molecule. In PMV all geometries are mapped to underlying
atoms. A yellow sphere appears at coordinates of underlying
atom. Left-click somewhere on the bottom edge of the
molecule. Now a dotted line appears connecting the two
picked atoms labeled by the distance. (You may need to
undisplay the molecule using show/hide molecule to see this
Note: There is a list of all the user
preferences and their defaults in line.) Measure Distance displays up to 4 distances in a row.
Appendix 7. The newest one is You can change this measureDistanceSL via
“Startup Directory” which lets you
specify where to start PMV.
File ➞ Pr efer enc es ➞ M odify D efaults
To clear the displayed distances, set the PCOM to something
Note: you can measure angles else and then to measureDistanceGC again. Alternatively use:
formed by 3 atoms using Edit -
> Measure -> Angle and torsion Edit ➞ Me asu re ➞ Dist anc e
angles formed by 4 atoms using
Edit -> Measu re -> Torsion . You may want to redisplay the lines to make it easier to pick on
specific atoms.
To stop measuring distances, use down arrow to the right of the
PCOM entry to set the PCOM back to printNod e Na mes .
Before going on, clean up!
At this point we will delete all the molecules.
Edit ➞ D elete ➞ D elet e All Mol ecul es
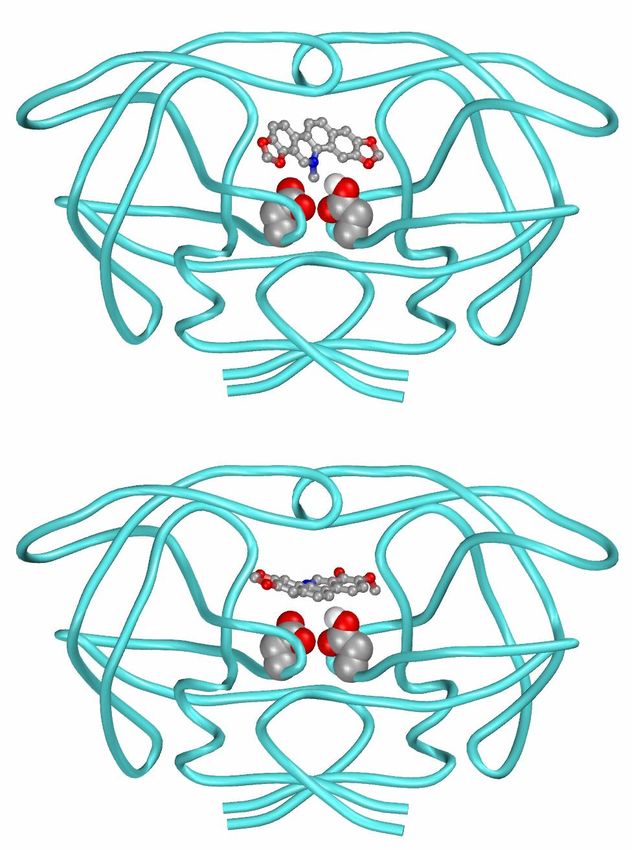
21HIV Protease: Active Site Residues and
Inhibitor
image courtesy of David Goodsell, TSRI
22Procedure:
Note: you load what you need when
you need it. Observe the effects of 1. Load a new command we will need for this exercise:
loading the traceCommands module:
A new menubuttons A. Click on File ➞ Bro ws e Co mm and s
Compute Trace appears in the
GUI. Also, in the Browse Commands B. Select Pmv package in the list of Packages.
widget you can view the
documentation strings of individual C. Highlight traceC om ma nds in the list of available PMV
commands in modules listed by
clicking on the Show Documentation modules.
checkbutton and selecting a command.
If the selected command has inline D. Click on Load Mo dule to load it.
documentation, it will be displayed
below the Show documentation E. Click on DISMISS to close the widget.
checkbutton.
Note: the Browse Commands widget
2. Display a Calpha-trace representation of hiv protease.
supports a shortcut device called
quick keys. What this means is that if A. Load hsg1 by positioning the cursor over
you first click in the list of modules,
the next keystroke will be matched to PMV M olecul es in the Dashboard and click with the right
the entries in this list. For example, if mouse button. In the file browser which opens, select
you first click in the list of modules
then type the letter m, the first entry hsg1 .p dbq s and click on Open .
which starts with m will be highlighted
and can be loaded using Load Module. B. Construct a CATrace representation of the secondary
You can match the first 2 characters if
you can type fast enough. structure of hsg1 and display it:
Co mput e ➞ Tr ac e ➞ Co mp uteE xtrud e Tra ce
Note: splines are smooth curves
computed based on user-defined control A CATrace is a spline, a smooth 3D curve calculated from
points which result in a 3D the coordinates of the calpha atoms. It represents the
representation of a molecule as a thin
tube. They can be either interpolating or backbone of the protein. The default extrudes a spline
approximating splines, depending on using a circle of radius 0.1. You could use compute and
whether the curve goes through the
control points or approximates them. extrude as separate steps if you wish to change the defaults.
PMV traceCommands use
approximating splines while PMV C. Color the CATrace geometry cyan.
splineCommands use interpolated
splines. Here we are using the smoother,
Calpha-trace geometry. Col or ➞ C ho os e Col or
By default, for a protein the control
points are the CA atoms of the residues
and the resulting tube represents the Click on CATra ce and then click OK
backbone of the protein.
In the color chooser widget, click on the cyan button and
DISMISS
D. Clean up by removing the lines.
Click on the red circle under Lines in the hsg1 row of the
Dashboard to undisplay the lines.
3. Display the side chains of the active site residues as CPK.
A. Select the carbon atoms and the oxygen atoms in the
two ASP25 residues at the active site. Clicking on
Sel ect ➞ Sel ect Fro m Strin g opens this GUI:
23Note:
1. The 4 entries specify strings which
are matched at the molecule, chain,
residue and atom levels resulting in a
new group of entities.
2. The menus which drop down from
the Molecule List..., Chain List...,
Residue Sets... , Atom Sets... buttons
let you add or remove strings by
clicking on checkbuttons.
3. The buttons Add, Remove, Xor and
Intersect define how the specified
subset will be combined with the
current selection:
currentselection op newgroup
4.When the current selection is empty,
the only allowable operation is Add.
Therefore, the buttons Remove, Xor and
Intersect are disabled when nothing is
selected.
Sel ect Fro m String lets you build a selection based on
strings you enter for the Molecule, Chain, Residue and/or
Atom level. These strings can be names, numbers, ranges
of numbers, or lambda expressions which are evaluated to
build a set. A comma-separated list of items can be entered
in any entry. The strings can contain regular expressions
including wild cards such as * which match anything. This
command also matches residue sequences in single letter
format. In addition, it supports selecting user-defined sets
as well as predefined residue and atom sets. (See
Appendix 2 for more details)
Note: C* matches all the atoms in the A. Type: (!Caution!: there are no spaces in C*,O* )
two ASP25 residues whose names
begin with C. O* matches all the atoms
in these two residues whose names
ASP25 in the Residue entry
begin with O. SelectFromString uses C*, O* in the Atom entry
regular expressions to build sets.
B. Click on Add You will be asked if you want to set the
selection level to MolKit.molecule.Atom. Click YES and
To set a value using a thumbwheel: Dismi ss
Position the cursor over the thumbwheel
and click the left-mouse button. While
continuing to hold down the left-mouse C. Display these selected atoms using a CPK representation
button, drag the mouse to the right to
increase the value and to the left to
decrease the value. Alternatively, you Displ ay ➞ CPK
can right-click on the thumbwheel to
open a widget which lets you type in the
desired value. With the latest version, you Using the thumbwheels, set Scale Factor to 0.7, make
can position the cursor over the sure display is on and then click on OK
thumbwheel and type the new value
followed by clicking on enter.
D. Color the CPK representation of these selected atoms by
Atom
Col or ➞ By Ato m T yp e
In the colorByAtomType widget, select the CPK geometry
and click on OK
24E. clear sele ction before going on.
3. Display a sticks and balls representation of indinavir, an
hiv protease inhibitor.
A. Load indinavir:
Position the cursor over PMV Mol ecul es in the Dashboard
and click with the right mouse button.
In the file browser which opens, select indinavir.p dbq and
click on Open .
B. Display indinavir as Sticks and Balls:
Position the cursor over the circle under S&B in the hsg1
row in the Dashboard and click with the left mouse button.
C. Color indinavir according to atom type:
Position the cursor over the diamond under Atom in the
hsg1 row in the Dashboard and click with the left mouse
button.
Summary: what have we learned?
1. Modules can be loaded when they are needed.
2. Splines approximating the coordinates of the Calpha atoms
can be used to represent a molecule.
3. The current selection can be set using strings to specify
particular subsets of atoms, residues, chains or molecules.
4. Subset of atoms can be displayed using a different
represention and coloring.
Add-On: Using the DejaVu GUI
PMV provides the user with direct access to its graphics engine
DejaVu, which is an OpenGL-based 3D Viewer. The
DejaVuGUI is a graphical user interface to the Viewer.
Click on the Spher e-Cub e-C one button, the ninth button in
the row of buttons to open the DejaVuGUI. At any time, the
DejaVuGUI lets you set properties of the current object,
camera, clipping plane or light. The properties control panel
manages which set of options is displayed at any time. For this
25section, we will set properties of the Camera to improve the
image. [see Appendix 1 for more details]
Click on Camer a in the Properties Control panel to display
the Camera Properties Panel.
1. Increase antialiasing. [see Appendix 1 for details]
Click on Scen e A ntialiasi ng and 15
Note: You can also set the camera’s
background color using: 2. Set the background color to white.
3DGraphics->SetBackGroundColor
and adjust antiliasing using: Click on Backgro und C olor and set Value
3DGraphics->SetAntialiasing
slider near 1.0 by left clicking on its small
triangle and dragging it to the right.
Note: in general you should save images as ‘tif’
3. Save the image
files. When you save an image as ‘jpg’ with PMV
it automatically compresses the file so you lose Sa ve ➞ Sav e Ima ge As
resolution with that format.
Note: it is possible to save the image with a
In the widget which open type in “hsg1_activesite.tif”
transparent background. You would need a and click on OK .
transparent background if you wanted to use the
image in a complicated composite. Transparent
background images can only be saved in png
format.
Add-On: Creating an mpeg video file
DejaVu GUI also provides access to video recorder powered by
PyMedia - http://www.pymedia.org. Click on Camera under
“Show properties panel for:” group. Next, click on the “Video
Recorder” button to open panel shown below. Click on
start/stop recording button () to start the recoding. This
button changes its color to red to indicate that all changes in the
Viewer are recorded in out.mpg file. For demonstration
purposes, rotate molecule and press stop recording button ().
This finishes up recording by closing out.mpg in the current
working directory. Save As button can be used to save mpg file
at a different location.
26Before going on, clean up!
Delete all the molecules in the Viewer.
Edit ➞ D elete ➞ D elet e All Mol ecul es
You will be asked if you wish to continue because deleting
cannot be undone. Click on Continu e .
If you have changed the Camera background color, restore it to
black before going on. Use the DejaVuGUI for this. Close the
DejaVuGUI before going on. Set Scene Antialiasing back to 0
if you have changed it.
27HIV Protease: Binding Site Surface Colored
by Property
MSMS surface for residues within 4Angstrom of indinavir, colored by
Temperature Factor
Procedure:
1. Display a molecular surface for hiv protease.
A. Load hsg1:
Position the cursor over PMV Mol ecul es in the Dashboard
and click with the right mouse button.
In the file browser which opens, select hsg1.p dbq s and
click on Open .
28B. Compute the molecular surface for hsg1 and display it:
Position the cursor over the circle under MS in the hsg1
row in the Dashboard and click with the left mouse button.
2. Load indinavir and select it.
A. Position the cursor over PMV Mol ecul es in the
Dashboard and click with the right mouse button.
B. In the file browser which opens, select indinavi r.pd bq
and click on Open .
C. Select indinavir by clicking on the grey rectangle in the
indinavir row.
D. Display it as Sticks and Balls colored by Atom Type by
clicking on the circle under S&B and the diamond under
Atom in this row.
3. Select all the atoms in all residues in hsg1 which have any
atom within 4 Angstrom of an atom in indinavir:
A. Click on Select ➞ Sph erical Re gion
B. In the widget which opens:
1. Click on current selection to use the atoms currently
selected, as the centers for the ‘spherical region.’
2. Type 4.00 in the entry for Selection Sphere Radius.
3. To select atoms in hsg1 only, click on from list and
hsg1.
4. Finally click on Select .
Close the widget by clicking on Close .
This results in selecting 72 atoms.
29C. Select all the Atoms in all the Residues with any atom in
this group of 72:
1. Use Select ➞ Set Sele ction Le vel to change the
selection level to Residue. Now the selection consists of
26 residues in hsg1 which have an atom within 4
Angstrom of an atom in indinavir.
2. Use Select ➞ Set Sele ction Le vel to change the
selection level to Atom. Now the selection consists of 214
atoms.
Save these atoms as a set for use later on. Select ➞ Save
current s electi on as a set . In the Set Name widget
which opens type in ats and click on OK .
4. Show the MSMS surface only for these atoms:
Displ ay ➞ Mole cular Surfac e
Click on display only, MSMS-MOL and OK .
5. Color MSMS surface according to the Temperature Factor
property of the underlying atoms:
A. Click on Color ➞ by Pr op erties
In the colorByProperty widget which opens, select
MSMS-MOL and click on OK .
In the Color by properties widget which opens:
• Change the property level: to Atom .
• Scroll down to temperatureFactor and click on it.
• Click on Edit under Color Map:
• Click on >> to accept Property Values range 0-49.71
30• Finally click on OK .
This results in coloring the MSMS surface according to the
temperatureFactor of the underlying atoms. It also opens a
widget which lets you edit the colorMap and permits you to
add a colorMap Legend to the VIEWER.
6. ColorMaps map a range of values to a range of colors. The
red-blue-green colorMap rgb256 maps the lowest values to
blue and the greatest values to red using 256 different colors.
Here we are using the range of temperatureFactors in the atoms
in residues near indinavir, 0-49.71, for the range of values.
Atoms with the lowest temperature factor will be colored blue
and those with the highest red. Each polygon used to display
the msms surface is colored according to the temperatureFactor
of its underlying atom.
You can edit the rgb256 colorMap using its graphical-user-
interface:
31This widget lets you customize the Hue, Saturation, Value or
Opacity range of the colorMap by clicking on the buttons in the
middle of the widget. Currently, Hue is displayed and can be
changed using the mouse. Click on any portion of the center
rectangle to change the color for the corresponding section of
the map. Clicking on Apply updates the objects colored using
this colorMap in PMV. You can use Edit->Reset to restore the
previous values.
You can add a color map legend to PMV by clicking on
show legend. The rgb256 widget’s Edit -> Edit Legen d menu
lets you enter a string for the Units at the top of the legend, set
the text font, scale the text font, enter Numeric custom labels
or the number of automatic labels to use,, whether to display
the Frame around the ligand, whether to invert the color of the
labels from white to black. Clicking on the legend (especially
the white square at the top when it is displayed) lets you drag it
from vertical to horizontal and/or reposition it. If you have
dragged it, click on show legend in the color map widget to
refresh its colors.
Note: To view the active site msms Summary: what have we learned?
surface from the side, you need to use
the DejaVuGUI to set culling for the
msms surface to None. By default, the 1. You can select atoms in specified molecules which are
back side of all geometries is culled and within spherical regions centered on one or more atoms.
the geometry is ‘invisible.’. To change
the culling of a geometry, use the
DejaVuGUI to make the geometry the 2. Geometries can be colored according to specific properties
current object in the Viewer and then
set culling in the Object Panel. See
of the underlying atoms, using color maps which assign a
Appendix 1 for more details. unique color to each value in the range of the property in the
atoms to be colored.
3. The color maps can be edited interactively and saved for
future use.
32Add-On: Intermolecular Hydrogen bonds
The hbondCommands module contains commands which
allow you to build hydrogen bonds between specified atoms
using adjustable parameters for distances and angles. This
module also contains commands which allow you to display
the resulting hydrogen bonds using various geometries.
Here we will use the default parameters to build
intermolecular hydrogen bonds between hsg1 and indinavir
and display them as lines.
Hy dro gen Bo nd s ➞ Build ➞ Set Par ms + Buil d
In the widget which opens, you opt to either to use all atoms or
to specify two sets. Also, you can adjust the default criteria
and decide whether to remove previous hydrogen bonds or not.
This command builds hydrogen bonds based pairs of
interacting atoms it detects using a dictionary of angle and
distance cutoffs for pairs of sp2 or sp3 atoms. You can change
any of the parameters. For hsg1, if you were to use all atoms
vs. all atoms, >120 hydrogen bonds would be formed. Instead
we want to build hydrogen bonds between hsg1 and indinavir
only.
Note The criteria used for building A. Build hydrogen bonds:
hydrogen bonds includes distance
and angle values for specific pairs of
atom types. Atom types in this
Hy dro gen Bo nd s ➞ Build ➞ Set Par ms + Buil d
context means sp2 donors, sp3
donors, sp2 acceptors and sp3 In the widget which opens:
acceptors.
• Click on Specify tw o s ets .
• Click on the top Molecul e List button and select
hsg1 in the list which drops down.
• Click on the lower Molecul e List button and select
indina vir in the list which drops down.
• Click on Ok to build hydrogen bonds.
Note: You may want to redisplay the
hsg1 lines to see specific atoms in hsg1 A widget should open informing you that 4 hydrogen
which are involved in the hydrogen bonds have been formed. The hydrogen bonds are not
bonds. To do this, use Un/Display->
lines displayed until you specifically display them.
Note: hydrogen bonds are displayed
B. Display the hydrogen bonds:
while the DisplayHbondsAsXXX
widgets are open and are undisplayed
You can display hydrogen bonds as lines, extruded shapes,
when the widgets are closed. [this is cylinders or spheres.
not a popular feature]
Hy dro gen Bo nd s ➞ Di spla y ➞ A s Lin es
33The hydrogen bonds are shown as green lines between atoms.
By default these lines are labeled by the distance between the
atoms. You can use check buttons in the widget to undisplay
distance measurements. It is also possible to display the angles
between the atoms involved and an energy value for the
hydrogen bonds.
Before the Add On, clean up the display to show only lines for
each molecule:
• Click on the circle under MS to display MS for the
entire molecule. Click on it again to hide the MS.
• Click on the circle under S&B to undisplay the
StickAndBall geometry for indinavir.
• Click on the circles to show both molecules as lines.
• Close the hydrogen bond widget to undisplay the
hydrogen bonds.
Add-On: Displaying Interactions
Interactions between two molecules can be visualized in PMV
using a new command which was initially developed to show
interactions between ligands and receptors. Here is a quick
look at it:
1. Click on Display ➞ Int era ction s to open a widget which
lets you Specify two groups of nodes for interaction display:
2. Select indinavir in the list which drops down when you
click on the top Molecule List .
3. Select hsg1 in the list which drops down when you click on
the lower Molecule List .
4. Click on Ok
As a result, the ligand is displayed with a molecular surface.
In this surface, the ligand atoms which do not interact with
receptor atoms are colored dark gray while the ligand atoms
which are interacting with receptor atoms are colored by atom
type. Atoms in the receptor which are interacting with atoms in
the ligand are displayed as spheres. Secondary structure is
displayed for sequences of at least 3 residues in row in the
receptor which have atoms interacting with the ligand. These
interactions are either close-contacts or hydrogen bonds.
34The Interactions Display Options widget lets you customize
this display by toggling on or off different representations.
Note: In principle, this command can be used It is also possible to calculate and display pi-pi (and t-shaped)
to illustrate interactions between any two interactions, if they exist and/or pi-cation interactions. This
groups of nodes in PMV. For example, you
could choose hsg1:A for the first group and calculation is slow…
hsg1:B for the second to look at the
intramolecular interface between these two Clicking on the down arrow attached to the entry for output list
chains. Please be aware, however, that this of results in writing the list of interacting residues and atoms
new command is under development……
in the python shell, which you open by clicking on its ICON on
the ICON Bar.
You can use the Save Image button to write the image to a file.
In principle, you can undo the display created by this command
via the Revert button which also Closes the Interaction Display
Options widget.
Before going on, clean up!
Delete all the molecules in the Viewer.
Edit ➞ D elete ➞ D elet e All Mol ecul es
In the widget which opens, click on Continue .
35HMG-I(Y)-DNA: Secondary Structure
MSMS surface for second dna binding domain of human HMG-I(Y) and
ribbon representation of DNA dodecamer
Procedure:
1. Load the molecule:
A. Position the cursor over PMV Mol ecul es in the
Dashboard and click with the right mouse button.
B. In the file browser which opens, select 2ezd.p db and
click on Open . This results in loading the molecule 2ezd
into PMV and displaying covalent bonds between its atoms
as lines.
2. Compute a molecular surface for chain A and display it:
36You can also read