Q1 GLOBAL CATASTROPHE RECAP - APRIL 2022 - DEVELOPMENTAID
←
→
Page content transcription
If your browser does not render page correctly, please read the page content below
Q1 Global
Catastrophe Recap
April 2022
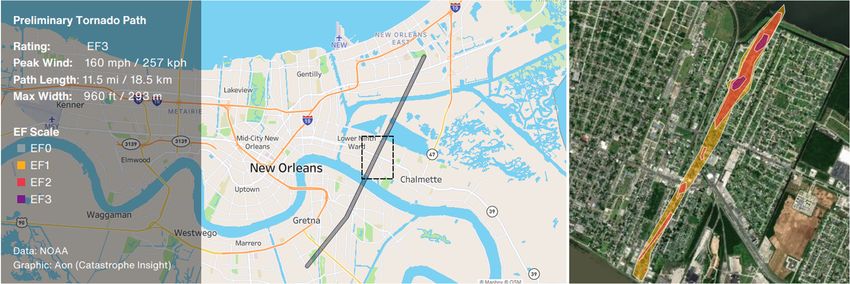
Table of Contents

2022: Sixth Consecutive $10B+ Q1 Insured Loss ........................................................................................... 2

Anomalous Weather Aids Heightened Loss Totals ......................................................................................... 3

Eunice to be Costliest EU Windstorm Since 2010 ........................................................................................... 5

Insurers Face $2B+ Toll from March 16 Japan EQ .......................................................................................... 7

Historic Floods Inundate Australia′s East Coast .............................................................................................. 9

Record March Tornadoes Lead High US SCS Loss ........................................................................................ 11

Extreme Warmth Engulfs Antarctica & the Arctic ......................................................................................... 13

IPCC: Limited Time Left to Make Meaningful Change .................................................................................. 15

Appendix: 2022 Data....................................................................................................................................... 16

Additional Report Details.................................................................................................................................20

Contact Information ......................................................................................................................................... 21

                                                                                                                                                               1
Q1 2022 Global Catastrophe Recap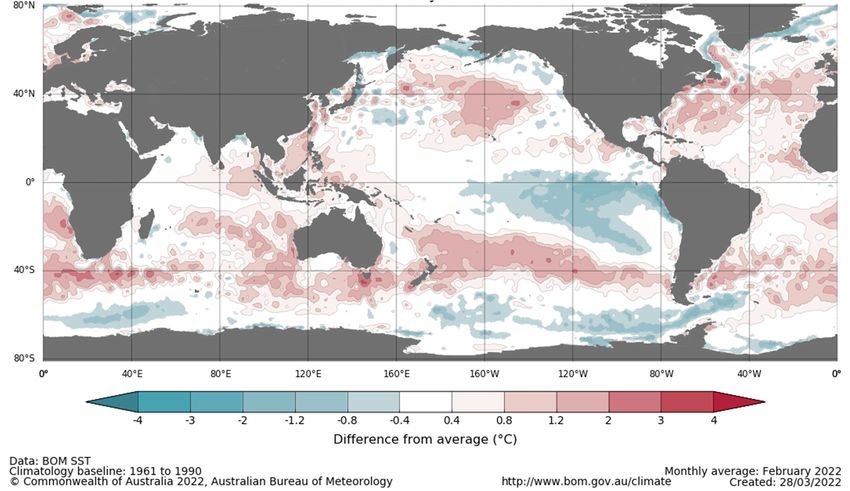
2022: Sixth Consecutive $10B+ Q1 Insured Loss
The first three months of 2022 were highly active in many territories around the world. Significant
natural hazard events occurred in Western and Central Europe (Windstorms Dudley/Ylenia,
Eunice/Zeynep, and Franklin/Antonia), Australia (East Coast Floods), Japan (March 16 Earthquake), and
the United States (Severe Convective Storms).

The first quarter is typically the quietest of the year, though 2022 marked the sixth consecutive year to
record more than USD10 billion in insured losses. The preliminary Q1 overall economic loss was $32
billion. Public and private insurers covered $14 billion of this total. However, it is important to remind
that these totals are expected to be upwardly revised, perhaps considerably, in the coming weeks and
months. This type of loss development is standard and expected in the aftermath of larger scale events.

                                                                                                February Windstorm Series
                                                                                                Costliest event of Q1 2022
                                                                                                Losses of more than $4.3B
                                                                                                for insurers

                                                                                                March 16 Japan Earthquake
                                                                                                M7.3 offshore tremor likely
                                                                                                to cost insurers $2B+

                                                                                                March SCS Outbreaks
                                                                                                multi-billion-dollar loss, with
                                                                                                Iowa and Louisiana most hit

                                                                                                East Coast Floods
                                                                                                One of Australia′s costliest
                                                                                                flood events on record

$32B                               30-50°C                                        5
Preliminary overall                Temperature anomalies compared to              Record tying number of storms to make
economic loss in                   seasonal normal measured in Antarctica in      landfall in Madagascar during a season;
Q1 2022                            mid-March                                      Ana, Batsirai, Dumako, Emnati, and Gombe

$14B                               1.04M ha                                       122 mph / 196 kph
Covered by public                  Area burned in the Corrientes Province of      Wind gust measured on the exposed
and private                        Argentina in Q1; 12 percent of its land area   Isle of Wight during Windstorm Eunice,
insurers                           was affected by wildfire                       the highest on record in England

All currency in US dollars ($) unless noted otherwise

                                                                                                                               2
Q1 2022 Global Catastrophe Recap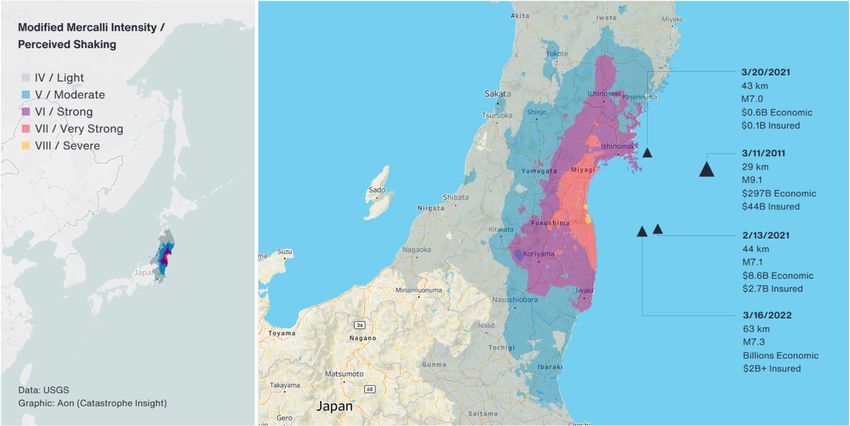
Anomalous Weather Aids Heightened Loss Totals

Natural Hazard Overview
Global temperatures and precipitation were heavily influenced by the continued effects of La Niña
across the central and eastern Pacific Ocean. These influences resulted in notable hazard events
including prolific and record-setting rainfall along Australia’s East Coast, continued severe drought
conditions in parts of Africa, South America, and the western United States, and an earlier start to
severe weather season in the United States.

Exhibit 1: Q1 2022 Temperature and Precipitation Anomalies vs Climatology (1991-2020)

Per NOAA: January was the sixth warmest, February was the seventh warmest, and March was the fifth
warmest for the globe dating to 1880. March also marked the 447th consecutive month for global land
and ocean temperatures to be above the 20th century baseline average. The tables below highlight the
Top 10 warmest months in the official observed record; primarily populated by years in the 21st Century.

               January                          February                               March
 Year         Temp Anomaly °C / °F     Year    Temp Anomaly °C / °F         Year     Temp Anomaly °C / °F

 2020               +1.14°C / 2.05°F   2016         +1.26°C / 2.27°F        2016          +1.31°C / 2.36°F

 2016               +1.12°C / 2.02°F   2020         +1.16°C / 2.09°F        2020           +1.17°C / 2.11°F

 2017              +0.98°C / 1.76°F    2017         +1.02°C / 1.84°F        2019          +1.10°C / 1.98°F

 2019              +0.93°C / 1.67°F    1998         +0.87°C / 1.57°F        2017          +1.09°C / 1.96°F

 2007              +0.92°C / 1.66°F    2015         +0.87°C / 1.57°F        2022          +0.95°C / 1.71°F

 2022              +0.88°C / 1.58°F    2019         +0.85°C / 1.53°F        2015          +0.92°C / 1.66°F

 2015              +0.83°C / 1.49°F    2022         +0.81°C / 1.46°F        2018          +0.89°C / 1.60°F

 2021              +0.78°C / 1.40°F    2010         +0.80°C / 1.44°F        2010          +0.87°C / 1.57°F

 2018              +0.75°C / 1.35°F    2010         +0.79°C / 1.42°F        2021          +0.85°C / 1.53°F

 2010               +0.73°C / 1.31°F   2018         +0.76°C / 1.37°F        2002          +0.82°C / 1.48°F

                                                                                                              3
Q1 2022 Global Catastrophe Recap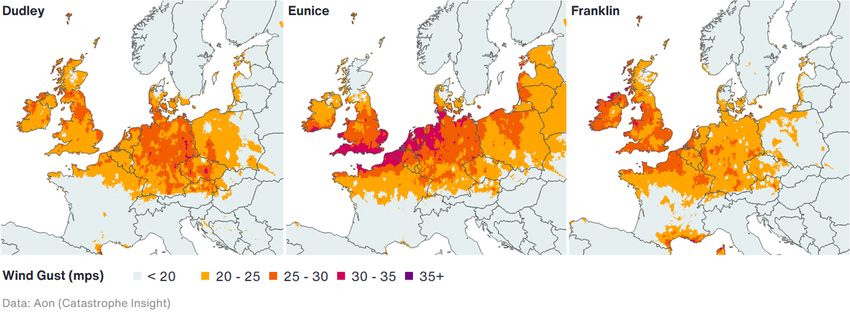
Economic and Insured Loss Analysis
Years with elevated Q1 economic losses have often been amplified by major earthquake events, such as
1994 (United States), 2010 (Chile and Haiti), 2011 (Japan and New Zealand), 2020 (Croatia), and 2021
(Japan). In recent years, however, the growing impactful nature of “secondary perils” such as winter
weather, flooding, and severe convective storm have accounted for a significant portion of the overall
quarterly economic cost. This reinforces the question as to whether the term “secondary peril” has
become obsolete because the losses associated with these perils are impacting more populated
communities with increasing intensity and resulting in higher loss costs.
The Asia-Pacific (APAC) region accounted for the highest percentage of Q1 economic losses ($15+
billion), with EMEA ($8 billion) and the United States ($6 billion) behind. With many large scale and
impactful events occurring in the month of March, it is expected that event loss totals will continue to
develop in the weeks and months ahead.

Exhibit 2: Global Q1 Economic Losses (2022 $ billion)

For public and private insurers, the $36 billion in Q1 weather-related insured losses in 2021 and 2022
represented the second-highest two-year total on record. This is second only to 2020 and 2021, which
tallied $40 billion and was primarily driven by the $25 billion in 2021. Third place is $33 billion for Q1
events in 1990 (highlighted by major European Windstorm events) and 1991. For all natural hazard
events, including earthquakes / tsunamis / volcanoes / etc, the two-year total of $41 billion ranks as the
seventh-highest total on record. The record remains 2010 and 2011 at $98 billion.

Exhibit 3: Global Q1 Insured Losses (2022 $ billion)

                                                                                                           4
Q1 2022 Global Catastrophe Recap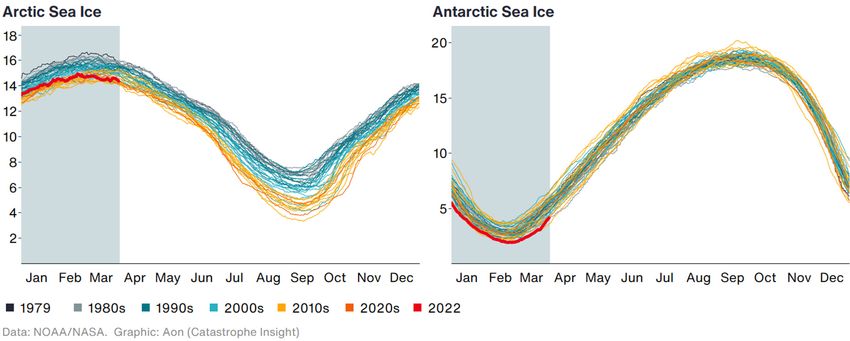
Eunice to be Costliest EU Windstorm Since 2010
During the period of February 16-21, parts of Europe experienced impacts of a series of low-pressure
systems, which developed in quick succession. Unusual atmospheric conditions, with prolonged state of
positive North Atlantic Oscillation (NAO) and Arctic Oscillation (AO) indices in place, led to the
development of a sequence of windstorms each named by the UK Met-Office (UKMO), Met Éireann, and
KNMI as Dudley, Eunice, and Franklin. Free University of Berlin named these areas of low pressure
Ylenia, Zeynep, and Antonia respectively.

The weather pattern was driven by an active jet stream that propagated the low-pressure systems
across anomalously warm waters in the North Atlantic Ocean and towards western sections of Europe.
The strong frontal boundary that stretched through the North Atlantic became disturbed, which allowed
for active cyclogenesis and the formation of several low-pressure systems in a short time span.

Exhibit 4: Impact Forecasting’s modeled event footprints of storms Dudley, Eunice, and Franklin

Impact Forecasting responded to this exceptional situation by a range of services, including loss
forecasts through the Automated Event Response (AER), post-event estimates and release of the
footprints. Various currently publicly available estimates suggest that the entire series might result in
significant industry payouts, with aggregated totals approaching €4.0 billion ($4.3 billion). Industry
losses directly attributable to Windstorm Eunice suggest that the storm will become the costliest
individual low-pressure system to impact Europe since Xynthia in 2010.

It is worth noting that wind speeds initially forecast for Eunice by various meteorological models were
substantially higher in some regions, particularly in England. Eventual impact was thus much lower than
indicated, and the worst-case scenario, which suggested potential for market-wide industry losses
comparable to those caused by Kyrill in 2007, did not materialize.

                                                                                                            5
Q1 2022 Global Catastrophe Recap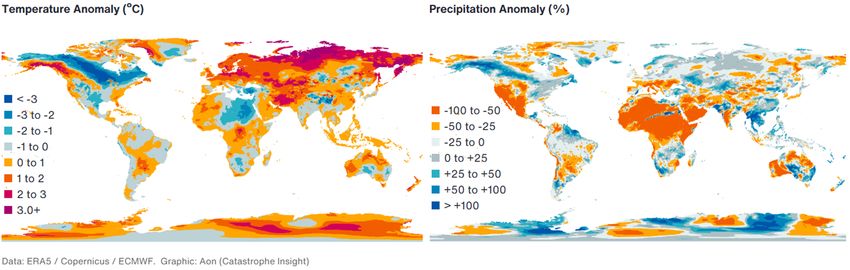
The windstorm series occurred in February, during the peak of the windstorm season. Historical data
suggests that January and February are the months with the highest proportion of aggregated losses by
far and are followed by Q4 months of October and December. In January 2022, several additional
Northern and Central Europe, namely Gyda (January 12-13), Hannelore (January 16-17) and Malik, also
known as Nadia (January 29-30). However, cumulative insured losses from these storms did not exceed
$400 million.

Exhibit 5: EU Windstorm seasonal insured losses since 2000 (2022 $ billion)

Final Thoughts
The European Windstorm peril, long considered a “primary” peril across the European insurance market,
has been of keen interest given the potential for significant loss occurrences. Particularly when there
are clustering instances, which can feature multiple storms impacting areas in quick succession.
However, the peril has not topped the $10 billion threshold (2022 USD) for the insurance industry since
1999. The nearly $5 billion calendar year industry loss thus far in 2022 already puts it as the most
expensive since 2013.

Impact Forecasting recently launched a comprehensive update to its European Windstorm model that
added more historical events, re-calibrated its vulnerability component, and now better accounts for
residential and automobile portfolios across Western, Central, and Eastern Europe. IF additionally
added new peer-reviewed climate change research from Karlsruhe Institute of Technology (KIT) into
the model to help better address seasonal storm clustering and its impact on losses.

                                                                                                       6
Q1 2022 Global Catastrophe Recap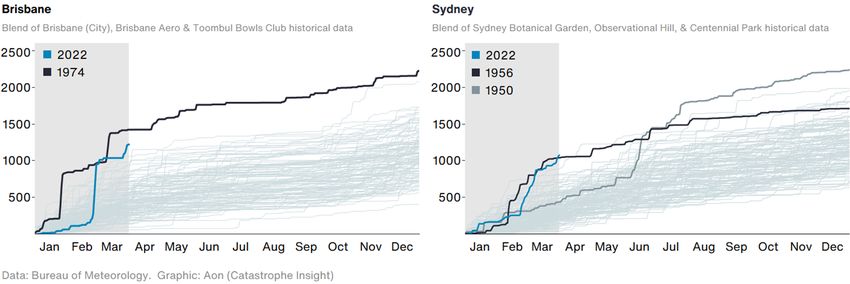
Insurers Face $2B+ Toll from March 16 Japan EQ
One of the most significant individual events of the first quarter of 2022 occurred on March 16 just
offshore Japan’s Fukushima Prefecture. A USGS-registered magnitude-7.3 earthquake – along with
several strong aftershocks and a notable foreshock – shook many prefectures throughout Japan. The
event occurred just days after the 11th anniversary of the Great Tohoku Earthquake on March 11, 2011.

Exhibit 6: March 16 Japan M7.3 Earthquake USGS ShakeMap

According to Japan’s Fire and Disaster Management Agency (FDMA), the March 16 earthquake resulted
in four fatalities and left 244 others injured. An immediate power blackout ensued after the main shock,
affecting more than 2.2 million households across 14 prefectures, including Tokyo. The tremor also
ruptured water pipes and caused temporary water shortages to more than 34,000 households.
Infrastructure was notably disrupted which led to five Shinkansen lines being suspended. JR East
confirmed 1,000 cases of infrastructure damage, including 300 railway and 79 utility poles damages.
The temblor also brought down a few units of cooling water pumps in Fukushima Daiichi and Fukushima
Daini nuclear power stations, but no radioactive leakage occurred. There were twelve fire incidents,
mainly in Miyagi Prefecture.

As of April 11, the FDMA cited that at least 10,414 homes and other structures had sustained some level
of damage. Assessments remained ongoing and this total was anticipated to keep rising. The
earthquake additionally left several manufacturing facilities closed. Some of these locations included
microchip maker Renesas Electronics and electric components maker Murata Manufacturing. This were
expected to further disrupt the current global supply chain crisis. Preliminary estimates suggested an
economic loss well into the billions (USD). Insurers were anticipating losses approaching and/or
exceeding $2.0 billion.

                                                                                                           7
Q1 2022 Global Catastrophe Recap
This part of Japan is no stranger to significant earthquake events. As noted in the graphic on the
previous page, there have been three earthquakes of at least M7.0 intensity since 2021 alone in this
region. These are all part of the same tectonic region where the M9.1 earthquake and subsequent
tsunami occurred in March 2011. Perhaps most notably, a similar M7.1 temblor struck very near the
March 2022 M7.3 event. That event was located just 12 km (7 mi) from the 2022 earthquake caused a
rupture of 32 km by 24 km (20 mi by 15 mi) towards the southwest. However, the 2022 event ruptured
towards the north covering a slightly larger area, leading to shortening of the rupture gap to just 30 km
(19 mi) from the Great Tohoku earthquake.

The February 2021 earthquake cost the insurance industry at least $2.5 billion. The overall economic
loss topped $8.0 billion. The table below compares the February 2021 and March 2022 events.

 2021 Fukushima Earthquake                                                            2022 Fukushima Earthquake

 7.1                                          USGS Magnitude                                                     7.3

 44                                              Depth (km)                                                       63

 73                                        Distance from land (km)                                                57

 Severe                                Modified Mercalli Intensity Scale                                     Severe

 0.2                                    Maximum Tsunami Height (m)                                               0.3

 3                                                Fatalities                                                       4

 186                                               Injuries                                                      244

 36,299                                       Homes Damaged                                                  10,414*
                                            *Based on the 19th Update via the Japan Fire and Disaster Management Agency

Final Thoughts
The General Insurance Association of Japan (GIAJ) continues to assess the March 16, 2022 event and is
working with local and global insurers. It will take months to get a complete view of where the final
insurance impact will eventually land. The agency noted that the February 13, 2021 event resulted in
260,966 non-life residential claims being filed. It remains too preliminary to conclude if claims totals for
the 2022 event will exceed this total, but initial guidance suggests this is a reasonable first comparison.

Earthquake insurance for home dwellings has been incrementally increasing in Japan in recent years.
The percentage of homes with peril coverage rose from 30.5% in 2016 to 33.9% at the end of 2020.

Exhibit 7: Global insured losses from the earthquake peril since 1980 (2022 $ billion)

                                                                                                                       8
Q1 2022 Global Catastrophe Recap
Historic Floods Inundate Australia′s East Coast
A prolific and historic period of torrential rainfall affected broad swaths of Australia’s East Coast during
the latter half of February through March. Parts of New South Wales and Queensland were among the
hardest hit, which resulted in substantial flooding in the greater Brisbane and Sydney metropolitan areas
in addition to other localized communities in each state. Australia’s Bureau of Meteorology noted that
several areas set numerous one-day (24-hour), monthly, and quarterly rainfall records. Many of these
records were set in locations with more than 100 years of observational data.

Exhibit 8: Annual cumulative rainfall in Brisbane and Sydney (mm)

The most significant period of flooding was noted from February 23 to March 8. During this time, a
persistent trough of low pressure remained quasi-stationary along Australia’s East Coast and a serious
of areas of low pressure developed while funneling moisture towards the coastline. The persistence of
the trough allowed phenomenal flooding to occur as dozens of rivers overflowed their banks. The Mary
River alone crested at a level not seen since at least 1893. More than 30 recording sites in New South
Wales – especially between the towns of Gympie and Numinbah – recorded more than 1,000 mm
(39.40 in) of rain during one six-day period alone. In Queensland, Brisbane recorded three consecutive
days of rainfall totals topping 220 mm (9.0 in). This is historically unprecedented for the region.

Further rains would later fall during the last two weeks of March that would cause some towns, such as
Lismore, to endure repetitive flooding. The expansive nature of the floods across Queensland and New
South Wales were the worst since the late 2010 and early 2011 floods that resulted in nearly $8 billion in
economic losses: mostly in Brisbane.

The Insurance Council of Australia (ICA) declared an insurance catastrophe and cited that at least
173,346 claims had already been filed as of April 8 with an estimated value of AUD2.43 billion (USD1.81
billion). These totals will continue to increase. There will be additional insured losses to agriculture. The
overall economic toll – including uninsured or underinsured damage – will be well into the billions (USD).
This will likely end as one of Australia’s costliest flood-related events on record.

                                                                                                                9
Q1 2022 Global Catastrophe Recap
The influence of climate change continues to become increasingly evident in the behavior of individual
events. This is especially clear in heavy precipitation events as warming temperatures in the air and in
the oceans allow the atmosphere to hold more moisture which can fall to the surface. In the context of
damage loss costs, the growth of population and exposure into high-risk areas continues to enhance
damage potential. Most recent census surveys in the Brisbane and Sydney metro regions show that the
housing stock had increased by 20 percent (Brisbane) and 13 percent (Sydney) in the last decade alone.
State/ Region Census Census (2006) Census (2011) Census (2016)
Greater Brisbane Population 1,852,501 2,065,998 2,270,800
Housing 694,335 763,027 833,399
Greater Sydney Population 4,119,190 4,391,673 4,823,991
Housing 1,521,462 1,601,530 1,719,678
Final Thoughts
The El-Niño Southern Oscillation (ENSO) has a very robust influence on Australia’s year-to-year climate
variability. In 2021, a “double-dip” La Niña brought record rainfall across eastern Australia in March and
November. La Niña conditions then extended into early 2022. Strengthened trade winds and warmer
ocean waters created a favorable environment for an extreme weather pattern along the East Coast.
It is also worth noting of the correlation between ENSO phase and the Southern Annular Mode (SAM).
During La Niña years, SAM is usually in the positive phase. This set-up further positions the steering
ridge of high pressure southward in the South Pacific Ocean and allows more moist tropical onshore
winds along the East Coast of Australia. This pattern was evident in late February and March 2022.
Exhibit 9: Difference from Average Sea Surface Temperature Observations in February 2022
10
Q1 2022 Global Catastrophe RecapRecord March Tornadoes Lead High US SCS Loss
The United States had a relatively benign winter weather season with only a handful of notable
Nor’easter events that caused widespread damage along the East Coast. There were no events that
matched the scope of the February 2021 Polar Vortex which resulted in more than $15 billion in insured
losses alone. While winter weather may have been manageable, the presence of La Niña conditions
again initiated an earlier start to severe weather season. The month of March proved to be exceptionally
busy throughout the United States and featured numerous severe convective storm (SCS) outbreaks
that resulted in deadly tornadoes, very large hail, and strong straight-line winds.
According to data from the Storm Prediction Center (SPC) there were at least 290 tornado Local Storm
Reports (LSRs), of which 222 have thus far been unofficially confirmed via National Weather Service
(NWS) surveys. This was well above the Doppler radar era (1990-2020) average of 83 and marked the
first time that the month of March surpassed the 200-tornado threshold. In total, there were at least 354
tornado LSRs in Q1 (and 265 unofficially confirmed). Twelve (12) tornado fatalities occurred.
Exhibit 10: U.S. March Tornadoes
The month of March is typically the transitional start of peak U.S. severe weather season. The “peak”
months from March through June cover the most of tornadoes, hail, damaging straight-line winds, and
resultant financial losses from the SCS peril. As noted previously, La Niña conditions are known to
enhance the frequency of springtime hail and tornado outbreaks across the U.S. Plains and Southeast.
This occurs as La Niña tends to shift the trajectory of the jet stream further south and eastward and
create more favorable environmental conditions which support more early season storm formation.
The role of climate change with severe convective storms remains uncertain. There has yet to be any
obvious change in the annual number of tornadoes and hail or non-tornadic wind reports. Emerging
academic research and climate model projections are, however, beginning to suggest more favorable
environmental days for outbreaks to occur. The increased frequency of La Niña events in the last 30
years has shown this to be an accompanying issue to any climate influence. All of this is true within the
context of population migration patterns moving further into highly vulnerable SCS areas from the
Rockies to the Deep South. Impact Forecasting recently announced a new collaboration with the
University of Illinois and Central Michigan University to integrate new climate change research directly
into its United States SCS catastrophe model.
11
Q1 2022 Global Catastrophe RecapMarch SCS Outbreaks
The month of March featured several significant SCS and tornado outbreaks across the central, eastern,
and southern United States. Iowa, Texas, Mississippi, Louisiana, and Alabama were the hardest hit. The
strongest tornado of the year to-date was a long-tracked EF4 tornado with up to 170 mph (275 kph)
winds in Iowa on March 5. The twister resulted in extensive damage in Madison County near the town of
Winterset along its 70 mi (112 km) path. This represented the second-longest tornado path observed in
Iowa since 1980. This was one of at least 14 confirmed Iowa tornadoes on March 5 that left at least
seven people dead. The March 5 outbreak was the second highly anomalous tornado outbreak to affect
Iowa during early and late winter months. An outbreak on December 15, 2021 spawned 63 tornadoes.
No other state had more tornadoes from Dec 1, 2021 to Mar 5, 2022 than Iowa.
Exhibit 11: March 22 Arabi Tornado in New Orleans
The state of Louisiana was also heavily impacted by tornado activity in March, including metro New
Orleans on March 22. A confirmed EF3 tornado with up to 160 mph (260 kph) winds left extensive
impacts in New Orleans’ Arabi neighborhood and adjacent Lower Ninth Ward. More than 150 homes and
other structures were damaged to varying degrees. The tornado became the strongest on record to
touch down in either Orleans, Jefferson, or St. Bernard Parishes.
Yet another major SCS outbreak that featured a confirmed 85 tornadoes swept across the central and
eastern United States from March 29-31. The twisters were part of an expansive storm system that was
marked by an elongated linear cluster of thunderstorms that additionally brought extensive straight-line
wind damage from Texas to the Mid-Atlantic States. The combined cost of Q1 U.S. SCS activity was
expected to result in a multi-billion-dollar loss for the insurance industry. The country is well on its way to
recording its 15th consecutive year with insured SCS losses topping $10 billion.
Final Thoughts
Perhaps the biggest takeaway of Q1 U.S. SCS activity was storm damage occurring in areas still
recovering from previous disasters. This was especially true in New Orleans, where the March 22
tornado struck areas that still had tarp-covered roofs due to Hurricane Ida’s landfall in August 2021. The
compounded nature of natural hazard events will only become more pronounced in the future. This will
amplify the importance of disaster planning and smart rebuilding efforts to mitigate against the next
inevitable waves of natural hazard occurrences.
12
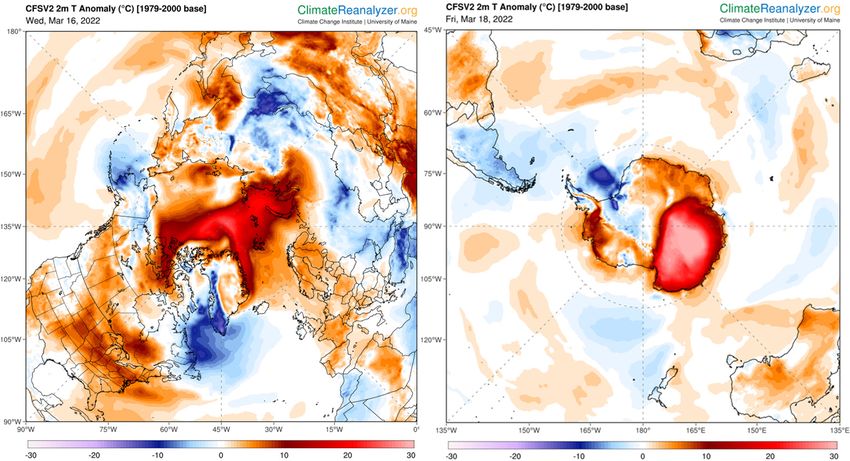
Q1 2022 Global Catastrophe RecapExtreme Warmth Engulfs Antarctica & the Arctic
Record-setting temperature events have become more pronounced in recent years. The Earth’s poles
often receive lots of attention given the Arctic and Western Antarctica are two areas that are most
vulnerable to some of the fastest rates of warming in the world. March 2022 featured two extreme
anomalous warming events that have fundamentally altered what climate scientists believed can and will
be possible at opposite ends of the Earth’s poles.
Exhibit 12: Extreme temperature Anomalies measured over the Earth’s Poles in mid-March 2022
Antarctica
An extraordinary warming event affected parts of eastern Antarctica from March 16-20, 2022. An
atmospheric river, which originated near the southeast coast of Australia, helped bring mild and moist
air across eastern Antarctica. While this phenomenon was not new, the intensity of the warm air
advection was kept in place by a blocking ridge of high pressure. This allowed an area from the Adélie
Coast to well inland on the continent’s eastern ice sheet to experience temperature anomalies from 30 to
50°C (56 to 90°F) warmer than normal. The Vostok measuring station broke its all-time March
temperature record by 15°C (27°F) – an enormous record-breaking differential based on 65 years of
data. The record warmth was especially unusual given this is a time of year where sunlight is still nearly
constant during the day and ground snow typically reflects heat back towards the sky; not absorb it.
The warmth led to notable sea ice extent melt across much of the continent. After a period of Antarctic
sea ice expansion in late 2021, including above-average spatial extent coverage on September 1, there
was a notable reversal in Q1 2022. The extent decreased to a minimum of 1.91 million km2 (0.74
million mi2) on February 25. This was the first time that the extent fell below 2 million km2 (0.77 mi2)
since satellite records began in 1979. However, two regions of high interest to researchers, Thwaites
Glacier, and the central Weddell Sea, remained largely unaffected.
13
Q1 2022 Global Catastrophe RecapArctic / North Pole
On the opposite side of the globe, and what occurred only days earlier on March 16, was another
significant anomalous warming event in the Arctic. An atmospheric river event brought a plume of warm
and moist air from the North Atlantic Ocean and far north into the Arctic Ocean. An associated area of
low pressure quickly deepened as it neared Greenland and the 934.1 millibar pressure reading at
Ikermiuarsuk became the country’s lowest pressure reading on record; surpassing the previous record of
936.2 millibars set in 1986 and 1988.
The deep low was countered by a very strong mid-latitude ridge of high pressure across the North Pole.
This allowed warm air advection to penetrate the Arctic Circle and bring temperatures as much as 30°C
(56°F) warmer than normal. Temperatures at the North Pole were remarkably near 0°C (32°F), and the
city of Svalbard, Norway – one of the northern-most cities in the world – set an all-time March record
with a high temperature of 5.6°C (42°F).
The warmth initiated notable rainfall and precipitation across the Arctic Circle and Greenland which
aided in an acceleration of sea ice melt.
Final Thoughts
The Arctic remains at the forefront of global warming. A 2021 NOAA report found that the Arctic is
warming at a rate two to three times faster than the rest of the world. The continuation of the extreme
anomalous warming events as seen in March 2022 will only accelerate the warming trend and the rate of
sea ice melt that is already contributing to more rapid sea level rise. While Antarctica has not shown the
same rate of warmth and sea ice melt as the Arctic, any additional disturbance to the climate system
across the Southern Hemisphere will only lead to greater effects to global circulation patterns.
The graphic below highlights daily sea ice readings in the Arctic and Antarctic dating to 1979. It is clear
to see that the Arctic has shown marked melting in the past four decades. Antarctica had a period of sea
ice expansion in the early 2010s, but there has since been a significant reversal in 2022. It is important
to note that sea ice extent, while important, is not as critical of a metric as sea ice age and thickness.
Older and thicker ice signifies healthier ice.
Exhibit 13: Arctic and Antarctic Sea Ice Extent (million km2)
14
Q1 2022 Global Catastrophe RecapIPCC: Limited Time Left to Make Meaningful Change
The United Nations Intergovernmental Panel on Climate Change (IPCC) released two remaining parts of
the Sixth Assessment Report (AR6) during Q1 2022. AR6 assesses the current state of the scientific,
technical, and socioeconomic knowledge on climate change, and provides suggestions to reduce the
rate at which climate change is taking place. Three different Working Groups (WGs) composed three
AR6 parts: 1) WGI: The Physical Science Basis released in 2021 (see Aon’s 2021 Weather, Climate and
Catastrophe Insight for summary findings), 2) WGII: Impacts, Adaptation and Vulnerability published in
February 2022, and 3) WGIII: Mitigation of Climate Change published in April 2022.
Primary WGII report takeaways:
Approximately 3.3 to 3.6 billion people (42-46 percent of the world population) live in the conditions
that are highly vulnerable to climate change
Near-term actions (2022-2040) to keep global warming close to 1.5°C (2.7°F) above the pre-
industrial baseline can still lead to a reduction in projected climate change-related losses and
damage
Mid to long-term (2041-2100) risks related to climate change depend strongly on near-term
mitigation and adaptation actions
Projected climate-related losses escalate with every additional increment of global warming;
meaning that further warming will lead to compounding overall risk levels
Adaptation, planning, and implementation need to be three key fundamental aspects to climate
change preparedness and can lead to significant societal and ecological protection
The most vulnerable communities with the lowest income will need greater global influence to take
the steps required to build their own levels of resilience against worsening disasters
Observed climate-change related events and subsequent impacts to lives and livelihoods have been
accelerating at a faster rate than originally anticipated; this highlights the urgency of the situation
It is not too late to change emission outputs and human behavior that can bring meaningful near-,
medium-, and long-term improvements to the world
Primary WGIII report takeaways:
All adaptation and mitigation efforts and strategies need to be done on a global level to tackle
climate change efficiently
We are not on track to limit warming to 1.5°C (2.7°F) but there is increased evidence of climate
action. Global greenhouse gas emissions should peak before 2025 and need to be reduced by 43
percent by 2030 to limit warming to 1.5°C (2.7°F)
Accelerated climate action is critical to sustainable development
Technology and innovations are important drivers that are still limited in developing countries,
particularly in the least developed countries
We know what to do, we know how to do it, and now it is time to implement our knowledge because
we are still not doing enough
15
Q1 2022 Global Catastrophe RecapAppendix: 2022 Data
United States
Date Event Location Deaths Economic Loss
01/01-12/31 DR Nationwide NA 850+ million
01/02–01/03 WW Southeast, Mid-Atlantic 5 495+ million
01/08–01/09 SCS Plains, South 0 60+ million
01/14–01/17 WW Southeast, Mid-Atlantic 3 600+ million
01/21–01/22 SCS California 0 175+ million
01/28–01/30 WW Mid-Atlantic, Northeast 4 50+ million
02/01–02/05 WW Rockies, Plains, Mid-Atlantic, Northeast 10 350+ million
02/16–02/18 WW Plains, South, Mid-Atlantic, Northeast 0 350+ million
02/21-02/22 SCS Plains, South 0 425+ million
03/05-03/07 SCS Midwest, Mid-Atlantic, Northeast 8 500+ million
03/11-03/13 SCS South, Mid-Atlantic 0 220+ million
03/14–03/16 SCS Plains, South 0 345+ million
03/17–03/19 SCS Plains, South 0 35+ million
03/17-03/25 WF Texas 1 Millions
03/21-03/23 SCS Plains, South 5 100s of millions+
03/29-04/01 SCS Plains, South 2 100s of millions+
03/30-04/01 WF Tennessee 0 10s of millions
Remainder of North America (Non-U.S.)
Date Event Location Deaths Economic Loss
01/24 EQ Haiti 2 Millions
01/30-01/31 FL Haiti, Dominican Republic 5 Millions
02/17-02/19 WW Canada 0 200+ million
03/06 WW Canada 0 Millions
16
Q1 2022 Global Catastrophe RecapSouth America
Date Event Location Deaths Economic Loss
01/01-12/31 DR Argentina NA 500+ million
01/01-12/31 DR Brazil NA 500+ million
01/01-01/14 FL Brazil 15 50+ million
01/15-02/28 WF Argentina 0 100s of millions
01/16-01/17 FL Brazil, Uruguay 0 Millions
01/27-01.30 FL Brazil 31 65+ million
01/28-01/31 FL Ecuador 25 Millions
02/07-02/09 SCS Brazil 0 20+ million
02/08 FL Colombia 16 Millions
02/15-02/16 FL Brazil 232 25+ million
02/18-02/19 FL Colombia 1 Millions
03/01 – 03/31 FL Colombia 19 10s of millions
Europe
Date Event Location Deaths Economic Loss
01/12-01/13 WS Gyda Norway 0 14+ million
01/16-01/17 WS Hannelore Northern, Eastern & Central Europe 0 113+ million
01/29-01/30 WS Malik Western, Northern & Central Europe 7 415+ million
01/30-01/31 WS Corrie Western Europe 0 19+ million
02/03-02/06 WW Austria, Switzerland 11 Negligible
02/06-02/07 WS Roxanna Western & Central Europe 0 155+ million
02/16-02/17 WS Dudley Western & Central Europe 7 863+ million
02/18-02/19 WS Eunice Western & Central Europe 17 4.1+ billion
02/20-02/21 WS Franklin Western & Central Europe 0 754+ million
17
Q1 2022 Global Catastrophe RecapMiddle East
Date Event Location Deaths Economic Loss
01/01-01/06 FL Oman, Iran 14 95+ million
02/13 FL Oman 1 7+ million
03/17 EQ Iran 0 35+ million
Africa
Date Event Location Deaths Economic Loss
01/01-12/31 DR Somalia NA 200+ million
01/01-12/31 DR Kenya NA 200+ million
01/01-12/31 DR Ethiopia NA 200+ million
01/01-01/25 FL Rwanda 15 Negligible
01/08-01/09 FL South Africa 10 66+ million
01/13-01/20 FL Zambia 3 Millions
01/15-01/16 FL South Africa 1 99+ million
01/17 FL Madagascar 10 Negligible
01/21-01/31 FL Democratic Republic of the Congo 0 Millions
01/21-02/02 SCS Democratic Republic of the Congo 26 Negligible
01/22-01/25 TS Ana Madagascar, Mozambique, Malawi 142 25+ million
02/02-02/07 CY Batsirai Madagascar, Mauritius, Reunion 123 190+ million
02/15-02/16 CY Dumako Madagascar 14 Millions
02/22-02/24 CY Emnati Madagascar 14 Millions
03/08-03/18 CY Gombe Madagascar, Mozambique, Malawi 72 95+ million
18
Q1 2022 Global Catastrophe RecapAsia
Date Event Location Deaths Economic Loss
01/01-01/06 FL Pakistan, Afghanistan 14 5+ million
01/02 EQ China 0 51+ million
01/06-01/19 FL Indonesia 11+ Millions
01/07-01/08 WW Pakistan 23+ Negligible
01/08 EQ China 0 510+ million
01/14 EQ Indonesia 0 Millions
01/17 EQ Afghanistan 28+ Negligible
01/20-01/24 WW China 0 100+ million
01/20-01/25 FL Pakistan 12+ Negligible
01/22 EQ Japan 0 50+ million
01/25-01/29 WW China 0 170+ million
02/01-02/03 WW China 0 180+ million
02/05-02/09 WW China 0 149+ million
02/06 WW Afghanistan 15+ Negligible
02/10-02/16 FL Indonesia 1 Millions
02/11-02/14 WW China 0 287+ million
02/16-02/22 WW China 0 756+ million
02/25 EQ Indonesia 18+ Millions
02/25-03/02 FL Malaysia, Thailand 12+ Millions
03/14–03/18 SCS China 0 89+ million
03/16 EQ Japan 4+ Billions
03/20-03/22 SCS China 0 23+ million
Oceania
Date Event Location Deaths Economic Loss
01/08-01/13 FL Australia 2+ 75+ million
01/15-01/16 VL Tonga, Pacific Rim 3+ 125+ million
02/09-02/13 CY Dovi New Zealand, Vanuatu, New Caledonia 0 80+ million
02/23-03/31 FL Australia 22+ 4.0+ billion
03/20-03/21 SCS New Zealand 0 10s of millions
19
Q1 2022 Global Catastrophe RecapAdditional Report Details
All financial loss totals are in US dollars ($) unless noted otherwise.
DR = Drought, EQ = Earthquake, WS = EU Windstorm, FL = Flooding, SCS = Severe Convective Storm,
TC = Tropical Cyclone, WF = Wildfire, WW = Winter Weather, VL = Volcano
TD = Tropical Depression, TS = Tropical Storm, HU = Hurricane, TY = Typhoon, STY = Super Typhoon,
CY = Cyclone
Fatality estimates as reported by public news media sources and official government agencies.
Structures defined as any building – including barns, outbuildings, mobile homes, single or multiple
family dwellings, and commercial facilities – that is damaged or destroyed by winds, earthquakes, hail,
flood, tornadoes, hurricanes, or any other natural-occurring phenomenon. Claims defined as the number
of claims (which could be a combination of homeowners, commercial, auto and others) reported by
various public and private insurance entities through press releases or various public media outlets.
Damage estimates are obtained from various public media sources, including news websites,
publications from insurance companies, financial institution press releases and official government
agencies. Damage estimates are determined based on various public media sources, including news
websites, publications from insurance companies, financial institution press releases, and official
government agencies. Economic loss totals are separate from any available insured loss estimates. An
insured loss is the portion of the economic loss covered by public or private insurance entities. In rare
instances, specific events may include modeled loss estimates determined from utilizing Impact
Forecasting’s suite of catastrophe model products.
20
Q1 2022 Global Catastrophe RecapContact Information
Steve Bowen Michal Lörinc
Managing Director Senior Catastrophe Analyst
Head of Catastrophe Insight michal.lorinc@aon.com
steven.bowen@aon.com
Brian Kerschner Jin Zheng Ng
Senior Catastrophe Analyst Senior Catastrophe Analyst
jin.zheng.ng@aon.com
brian.kerschner@aon.com
Ondřej Hotový
Catastrophe Analyst
ondrej.hotovy@aon.com
21
Q1 2022 Global Catastrophe RecapAbout Aon
Aon plc (NYSE: AON) is a leading global professional services firm providing a broad range of risk,
retirement and health solutions. Our 50,000 colleagues in 120 countries empower results for clients by
using proprietary data and analytics to deliver insights that reduce volatility and improve performance.
© Aon plc 2022. All rights reserved.
The information contained herein and the statements expressed are of a general nature and are not
intended to address the circumstances of any particular individual or entity. Although we endeavor to
provide accurate and timely information and use sources we consider reliable, there can be no
guarantee that such information is accurate as of the date it is received or that it will continue to be
accurate in the future. No one should act on such information without appropriate professional advice
after a thorough examination of the particular situation.
Copyright © by Impact Forecasting®
No claim to original government works. The text and graphics of this publication are provided for
informational purposes only.
While Impact Forecasting® has tried to provide accurate and timely information, inadvertent technical
inaccuracies and typographical errors may exist, and Impact Forecasting® does not warrant that the
information is accurate, complete or current. The data presented at this site is intended to convey only
general information on current natural perils and must not be used to make
life-or-death decisions or decisions relating to the protection of property, as the data may not be
accurate. Please listen to official information sources for current storm information. This data has no
official status and should not be used for emergency response decision-making under any
circumstances.
Cat Alerts use publicly available data from the internet and other sources. Impact Forecasting®
summarizes this publicly available information for the convenience of those individuals who have
contacted Impact Forecasting® and expressed an interest in natural catastrophes of various types. To
find out more about Impact Forecasting or to sign up for the Cat Reports, visit Impact Forecasting’s
webpage at impactforecasting.com.
Copyright © by Aon plc. All rights reserved. No part of this document may be reproduced, stored in a
retrieval system, or transmitted in any form or by any means, electronic, mechanical, photocopying,
recording or otherwise. Impact Forecasting® is a wholly owned subsidiary of Aon plc.
1
Q1 2022 Global Catastrophe RecapYou can also read