Q4 2022 Results & 2023 Guidance - CREATING VALUE & IMPROVING LIVES THROUGH SUSTAINABLE, RESPONSIBLE MINING
←
→
Page content transcription
If your browser does not render page correctly, please read the page content below
Q4 2022 Results &
                CREATING VALUE & IMPROVING LIVES      2023 Guidance
                THROUGH SUSTAINABLE,
                RESPONSIBLE MINING                       FEBRUARY 23, 2023

FOURTH QUARTER 2022 RESULTS AND 2023 GUIDANCE            NEWMONT CORPORATION   1
CAUTIONARY STATEMENT REGARDING FORWARD LOOKING STATEMENTS:
This presentation contains “forward-looking statements” within the meaning of Section 27A of the Securities Act of 1933, as amended, and Section 21E of the Securities Exchange Act of 1934, as amended, which are
intended to be covered by the safe harbor created by such sections and other applicable laws. Where a forward-looking statement expresses or implies an expectation or belief as to future events or results, such
expectation or belief is expressed in good faith and believed to have a reasonable basis. However, such statements are subject to risks, uncertainties and other factors, which could cause actual results to differ materially
from future results expressed, projected or implied by the forward-looking statements. Forward-looking statements often address our expected future business and financial performance and financial condition; and often
contain words such as “anticipate,” “intend,” “plan,” “will,” “would,” “estimate,” “expect,” “believe,” or “potential.” Forward-looking statements in this presentation may include, without limitation, (i) estimates of future
production and sales, including production outlook, average future production and upside potential; (ii) estimates of future costs applicable to sales and all-in sustaining costs; (iii) estimates of future capital expenditures,
including development and sustaining capital; (iv) expectations regarding the Tanami Expansion 2, Ahafo North, Yanacocha Sulfides, Pamour and Cerro Negro District Expansion 1 projects, including, without limitation,
expectations for production, milling, costs applicable to sales and all-in sustaining costs, capital costs, mine life extension, construction completion, commercial production and other timelines; (v) expectations regarding
future investments or divestitures; (vi) expectations regarding free cash flow, and returns to stockholders, including with respect to future dividends, the dividend framework and expected payout levels; (vii) expectations
regarding future mineralization, including, without limitation, expectations regarding reserves and recoveries; and (viii) expectations regarding the potential or proposed transactions. Estimates or expectations of future
events or results are based upon certain assumptions, which may prove to be incorrect. Such assumptions, include, but are not limited to: (i) there being no significant change to current geotechnical, metallurgical,
hydrological and other physical conditions; (ii) permitting, development, operations and expansion of operations and projects being consistent with current expectations and mine plans; (iii) political developments in any
jurisdiction in which the Company operates being consistent with its current expectations; (iv) certain exchange rate assumptions; (v) certain price assumptions for gold, copper, silver, zinc, lead and oil; (vi) prices for key
supplies; (vii) the accuracy of current mineral reserve and mineralized material estimates; and (viii) other planning assumptions. Uncertainties relating to the impacts of Covid, include, without limitation, general
macroeconomic uncertainty and changing market conditions, changing restrictions on the mining industry in the jurisdictions in which we operate, the ability to operate following changing governmental restrictions on
travel and operations (including, without limitation, the duration of restrictions, including access to sites, ability to transport and ship doré, access to processing and refinery facilities, impacts to international trade, impacts
to supply chain, including price, availability of goods, ability to receive supplies and fuel, impacts to productivity and operations in connection with decisions intended to protect the health and safety of the workforce, their
families and neighboring communities), the impact of additional waves or variations of Covid, and the availability and impact of Covid vaccinations in the areas and countries in which we operate. Such uncertainties could
result in operating sites being placed into care and maintenance and impact estimates, costs and timing of projects. Although the Company does not currently have operations in Ukraine, Russia or other parts of Europe,
Russia’s invasion of Ukraine has resulted in uncertainties in the market which could impact certain planning assumptions, including, but not limited to commodity and currency prices, costs and supply chain availabilities.
Investors are reminded that the dividend framework is non-binding and the 2023 dividend payout range does not represent a legal commitment. Future dividends beyond the dividend payable on March 23, 2023 to
holders of record at the close of business on March 9, 2023 have not yet been approved or declared by the Board of Directors, and an annualized dividend payout or dividend yield has not been declared by the Board.
Management’s expectations with respect to future dividends are “forward-looking statements” and the Company’s dividend framework is non-binding. The declaration and payment of future dividends remain at the
discretion of the Board of Directors and will be determined based on Newmont’s financial results, balance sheet strength, cash and liquidity requirements, future prospects, gold and commodity prices, and other factors
deemed relevant by the Board. Statements relating to the potential transaction to acquire the share capital of Newcrest, expectations regarding the potential value proposition and expectations regarding potential
engagement or plans to engage in due diligence or similar statements also constitute “forward-looking statements” within the meaning of Section 27A of the Securities Act of 1933, as amended, and Section 21E of the
Securities Exchange Act of 1934, as amended, which are intended to be covered by the safe harbor created by such sections and other applicable laws. There is no certainty that any transaction will occur or that further
negotiations or due diligence will take place. Risks include fluctuations in company stock price and results of operations; uncertainties regarding the outcome of discussions between Newmont and Newcrest with respect to
the potential transaction, including the possibility that the parties may not agree to pursue a business combination; uncertainties about the outcomes of the due diligence process and the ability to consummate the
potential combination or achieve the expected benefits; uncertainties with respect to shareholder approvals; potential regulatory or closing delays; and changes in the overall economic conditions. For a discussion of risks
and other factors that might impact future looking statements, see the Company’s Annual Report on Form 10-K for the year ended December 31, 2022 filed with the U.S. Securities and Exchange Commission (the “SEC”),
under the heading “Risk Factors", available on the SEC website or www.newmont.com. The Company does not undertake any obligation to release publicly revisions to any “forward-looking statement,” including, without
limitation, outlook, to reflect events or circumstances after the date of this presentation, or to reflect the occurrence of unanticipated events, except as may be required under applicable securities laws. Investors should not
assume that any lack of update to a previously issued “forward-looking statement” constitutes a reaffirmation of that statement. Continued reliance on “forward-looking statements” is at investors’ own risk. Investors are
also reminded to refer to the endnotes to this presentation for additional information.

NO OFFER OR SOLICITATION:
This presentation is neither an offer to purchase or exchange nor a solicitation of an offer to sell securities of Newmont or Newcrest. In furtherance of this potential transaction and subject to future developments,
Newmont may file one or more proxy statements or other documents with the SEC. This communication is not a substitute for any proxy statement, prospectus or other document Newmont or Newcrest may file with the
SEC and Australian regulators in connection with the potential transaction. INVESTORS AND SECURITY HOLDERS OF NEWMONT AND NEWCREST ARE URGED TO READ THE PROXY STATEMENT(S), PROSPECTUS AND OTHER
DOCUMENTS FILED WITH THE SEC CAREFULLY IN THEIR ENTIRETY IF AND WHEN THEY BECOME AVAILABLE AS THEY WILL CONTAIN IMPORTANT INFORMATION ABOUT THE POTENTIAL BUSINESS COMBINATION
TRANSACTION. Investors and securityholders may obtain a free copy of the disclosure documents (when they are available) and other documents filed by Newmont with the SEC at the SEC's website at www.sec.gov. The
disclosure documents and other documents that are filed with the SEC by Newmont may also be obtained on Newmont’s website at www.newmont.com or obtained for free from the sources listed below. Newmont and
certain of its directors and executive officers may be deemed to be participants in any solicitation of proxies from Newcrest stockholders in respect of the potential transaction between Newmont and Newcrest.
Information regarding Newmont’s directors and executive officers is available in its proxy statement for its 2022 annual meeting of stockholders, which was filed with the SEC on March 7, 2022. This document can be
obtained free of charge from the sources indicated below. Additional information regarding the interests of these participants in such proxy solicitation and a description of their direct and indirect interests, by security
holdings or otherwise, will be contained in any proxy statement and other relevant materials to be filed with the SEC in connection with the potential transaction if and when they become available.
      FOURTH QUARTER 2022 RESULTS AND 2023 GUIDANCE                                                                                                                                      NEWMONT CORPORATION                      2
AGENDA

▪ 2022 HIGHLIGHTS: Tom Palmer, President & CEO

▪ 2022 FINANCIAL PERFORMANCE: Brian Tabolt, Interim CFO

▪ OPERATIONAL OVERVIEW: Rob Atkinson, COO

▪ 2023 AND LONG-TERM OUTLOOK: Tom Palmer, President & CEO

▪ CAPITAL ALLOCATION STRATEGY: Tom Palmer, President & CEO

▪ PROPOSAL TO COMBINE WITH NEWCREST: Tom Palmer, President & CEO

FOURTH QUARTER 2022 RESULTS AND 2023 GUIDANCE                      NEWMONT CORPORATION   3
2022 Highlights
                CREATING VALUE & IMPROVING LIVES   Tom Palmer, President & CEO
                THROUGH SUSTAINABLE,
                RESPONSIBLE MINING

FOURTH QUARTER 2022 RESULTS AND 2023 GUIDANCE                NEWMONT CORPORATION   4
DRIVING A FATALITY, INJURY & ILLNESS-FREE WORKPLACE

SAFETY PERFORMANCE IS THE KEY                     2022 FATALITY RISK MANAGEMENT PROGRAM
INDICATOR OF A WELL-RUN BUSINESS
                                                   FOCUSED ON CRITICAL                      INCREASED CONTROL
                                                  CONTROL VERIFICATIONS                        VERIFICATIONS
✓   Results in more reliable operations with

                                                     620,000                                         30%
    greater efficiency from well-managed
    resources

                                                    Conducted by leaders in the field to   Increase in critical control verifications
                                                          manage fatality risks                           from 2021
✓   Applies a proactive mindset to managing
    risks and emerging issues
                                                  REDUCED SIGNIFICANT                         REVIEWED GLOBAL
                                                   POTENTIAL EVENTS                            SAFETY CULTURE
✓   Creates a strong relationship with
    employees, contracted partners and local
    communities that is built on trust and care             36%                                        50+
                                                   Decrease in the number of events that     Leaders participated in reviews to
                                                      could have resulted in a fatality     identify improvement opportunities

          A Strong, Consistent Safety Culture is Fundamental to Delivering on our Commitments
FOURTH QUARTER 2022 RESULTS AND 2023 GUIDANCE                                                         NEWMONT CORPORATION               5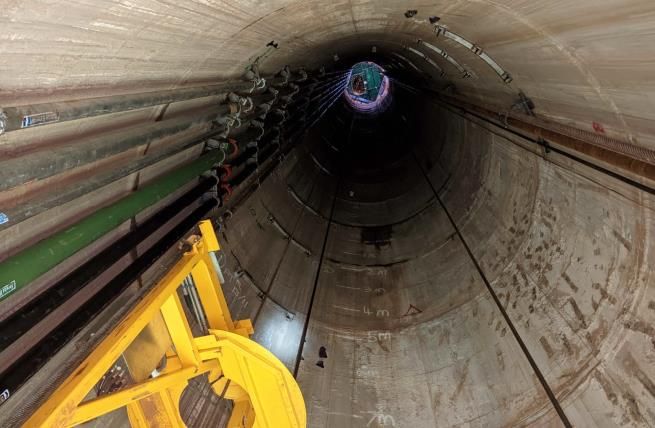
SAFELY DELIVERED ON OUR COMMITMENTS – ACHIEVED 2022 GUIDANCE

      ATTRIBUTABLE GOLD                                                         GOLD COSTS                                                               GOLD ALL-IN
                                                                                                                                                                                                                                 GOLD RESERVES
         PRODUCTION*                                                        APPLICABLE TO SALES                                                       SUSTAINING COSTS**

             6.0Moz
  Achieved original production guidance
                                                                                $933/oz
                                                                       Within updated full-year guidance range,
                                                                                                                                                      $1,211/oz
                                                                                                                                                 In line with updated guidance range &
                                                                                                                                                                                                                                     96Moz
                                                                                                                                                                                                                                   Replaced depletion with
    range with strong Q4 performance                                       managing global cost pressures                                       incorporating higher sustaining capital                                             net increase of 3.3Moz

                                                                                                                                                           RETURNS TO
        ADJUSTED EBITDA**                                                       FREE CASH FLOW**                                                                                                                               TOTAL LIQUIDITY***
                                                                                                                                                         SHAREHOLDERS**

           $4.6B
       Generated from the largest gold
                                                                                      $1.1B
                                                                         Operating cash flow of $3.2 billion with
                                                                                                                                                           $1.7B
                                                                                                                                               Dividends paid through industry-leading
                                                                                                                                                                                                                                $6.7B
                                                                                                                                                                                                                        Cash balance and undrawn revolving
        production base in the world                                          reinvestment of $2.7 billion                                                   framework                                                             credit facility

                            Success in 2022 Has Positioned Newmont to Safely Deliver on 2023 Commitments
*Includes production from the Company’s equity method investment in the Pueblo Viejo joint venture. **See endnotes re dividends and non-GAAP metrics. ***As of Q4 2022; Cash balance includes $2,877M in cash and cash equivalents and $829M in time deposits, currently included in Time
Deposits and Other Investments on the Consolidated Balance Sheet.
FOURTH QUARTER 2022 RESULTS AND 2023 GUIDANCE                                                                                                                                                                                    NEWMONT CORPORATION                                6
2022 Financial Performance
CREATING VALUE & IMPROVING LIVES Brian Tabolt, Interim CFO
THROUGH SUSTAINABLE,
RESPONSIBLE MINING
FOURTH QUARTER 2022 RESULTS AND 2023 GUIDANCE NEWMONT CORPORATION 7FULL-YEAR AND FOURTH QUARTER FINANCIAL PERFORMANCE
METRICS Q4 2022 FY 2022
Revenue ($M) $3,200 $11,915
GAAP Net Loss from Continuing Operations ($M) $(1,488) $(459)
Adjusted Net Income ($M)* $348 $1,468
Adjusted Net Income ($/diluted share)* $0.44 $1.85
Adjusted EBITDA ($M)* $1,161 $4,550
Cash from continuing operations ($M) $1,010 $3,198
Consolidated Free Cash Flow ($M)* $364 $1,067
Attributable Free Cash Flow ($M)* $349 $1,013
*See endnotes.
FOURTH QUARTER 2022 RESULTS AND 2023 GUIDANCE NEWMONT CORPORATION 8HIGHER SALES VOLUMES DRIVE STRONG Q4 RESULTS
Strong Q4 production as planned
▪ 16% increase in gold sales over Q3
Higher average realized gold price
▪ $1,758/oz compared to $1,691/oz in Q3
Q4 Adjusted Net Income of $0.44 per share
▪ Up 17 cents from Q3
GAAP Net Income includes non-cash
nonrecurring accounting adjustments of $2.0B
recorded during Q4
Safely Delivered a Strong Finish to 2022 from Industry-Leading Portfolio
FOURTH QUARTER 2022 RESULTS AND 2023 GUIDANCE NEWMONT CORPORATION 9Operational Overview
CREATING VALUE & IMPROVING LIVES Rob Atkinson, COO
THROUGH SUSTAINABLE,
RESPONSIBLE MINING
FOURTH QUARTER 2022 RESULTS AND 2023 GUIDANCE NEWMONT CORPORATION 10PEÑASQUITO TO DELIVER ~1.3 MILLION GOLD EQUIVALENT OUNCES IN 2023**
BEAT FULL-YEAR 2022 PRODUCTION GUIDANCE
▪ Exceeded full-year gold production guidance for the third consecutive year under Newmont operating model
▪ Lower gold grade in Q4 due to planned mine sequence; Steady silver, lead and zinc production
STRONG SILVER, LEAD & ZINC PRODUCTION EXPECTED IN 2023
▪ Mining weighted to Chile Colorado pit in 2023, resulting in lower gold grades and higher silver, lead and zinc grades
▪ Q1 gold grade expected to decline ~20% compared to Q4 due to this mine sequence
PEÑASQUITO METRICS 2022A 2023E
Gold Production (Koz) 566 330 – 370
Gold Costs Applicable to Sales (CAS) ($/oz) $771 $840 – $940
Gold All-In Sustaining Costs (AISC) ($/oz)* $968 $1,110 – $1,210
Silver Production (Moz) 30 31 – 35
Zinc Production (Mlb) 377 420 – 460
Lead Production (Mlb) 149 170 – 190
Delivered >$700M in Annual Synergies Since Acquired in 2019
*AISC is a Non-GAAP measure, see endnotes. **See endnote re calculation of GEOs.
FOURTH QUARTER 2022 RESULTS AND 2023 GUIDANCE NEWMONT CORPORATION 11SOUTH AMERICAN OPERATIONS TO DELIVER ~850,000 OUNCES IN 2023
A STRONG FINISH TO 2022 FROM YANACOCHA, MERIAN AND CERRO NEGRO
▪ Merian achieved highest quarterly production since 2020 due to higher grades and record mill performance
▪ Cerro Negro progressing expansions from the Marianas and Eastern districts; Completed first blast at the Silica Cap portal in December 2022
2023 EXPECTATIONS
▪ Yanacocha expecting higher production due to higher leach recoveries from the use of injection leaching
▪ Merian expecting lower production and higher unit costs due to waste stripping, resulting in lower grade ore processed
▪ Cerro Negro expecting production to increase each quarter due to sustained productivity improvements
YANACOCHA MERIAN CERRO NEGRO
METRICS 2022A 2023E 2022A 2023E 2022A 2023E
Attributable Gold Production (Koz) 230 255 – 285 302 235 – 265 278 315 – 345
Gold CAS ($/oz) $1,254 $1,370 – $1,470 $915 $980 – $1,080 $1,007 $850 – $950
Gold AISC ($/oz)* $1,477 $1,620 – $1,720 $1,105 $1,230 – $1,330 $1,262 $1,060 – $1,160
*AISC is a Non-GAAP measure, see endnotes
FOURTH QUARTER 2022 RESULTS AND 2023 GUIDANCE NEWMONT CORPORATION 12NORTH AMERICAN OPERATIONS TO DELIVER ~1 MILLION OUNCES IN 2023
CONTINUED IMPROVEMENT TREND IN Q4
▪ Musselwhite achieved best quarter for both development meters and gold production in 5 years
▪ CC&V achieved highest monthly production in December in 3 years
▪ Identified opportunities to extend production at Porcupine; Enabled deferral of Pamour layback investment decision to late 2023
STRONGLY POSITIONED TO CONTINUE MOMENTUM INTO 2023
▪ Experienced General Managers in place at all four operations to sustain performance and safely deliver on 2023 commitments
▪ CC&V expecting lower production due to waste stripping
PORCUPINE ÉLÉONORE MUSSELWHITE CC&V
METRICS 2022A 2023E 2022A 2023E 2022A 2023E 2022A 2023E
Gold Production (Koz) 280 285 – 315 215 265 – 295 173 200 – 220 182 160 – 180
Gold CAS ($/oz) $1,004 $950 – $1,050 $1,228 $960 – $1,060 $1,135 $860 – $960 $1,302 $1,150 – $1,250
Gold AISC ($/oz)* $1,248 $1,250– $1,350 $1,599 $1,300– $1,400 $1,531 $1,290– $1,390 $1,697 $1,580 – $1,680
*AISC is a Non-GAAP measure, see endnotes.
FOURTH QUARTER 2022 RESULTS AND 2023 GUIDANCE NEWMONT CORPORATION 13BODDINGTON TO DELIVER ~1.0 MILLION GOLD EQUIVALENT OUNCES IN 2023** SETTING NEW RECORDS AT CORNERSTONE OPERATION ▪ Achieved record monthly production for both gold and copper in December in 13-year mine life ▪ Best quarterly performance for the Autonomous Haul Truck fleet CONSISTENT PERFORMANCE EXPECTED IN 2023 ▪ Consistent gold production with increased copper production; Expect to be balanced between H1 and H2 ▪ Autonomous Haul Truck fleet continues to support safe operations and the management of labor costs in Australian market BODDINGTON METRICS 2022A 2023E Gold Production (Koz) 798 740 – 820 Gold CAS ($/oz) $802 $800 – $900 Gold AISC ($/oz)* $921 $960 – $1,060 Copper Production (Mlb) 84 95 – 105 *AISC is a Non-GAAP measure, see endnotes. **See endnote re calculation of GEOs. FOURTH QUARTER 2022 RESULTS AND 2023 GUIDANCE NEWMONT CORPORATION 14
TANAMI TO DELIVER ~440,000 OUNCES IN 2023

 ACHIEVED PRODUCTION GUIDANCE FOR 2022
 ▪ Maintained strong production throughout the year; Solid Q4 production from higher ore tonnes and grade

 ▪ Extreme weather events in NW Australia beginning in December, impacting Tanami track and delivery of key consumables

 CONSISTENT PERFORMANCE EXPECTED IN 2023 WHILE PROGRESSING EXPANSION
 ▪ Slightly lower production expected due to lower grades from planned mine sequencing to allow for expansion construction underground

 ▪ Closure of Tanami track in January and February impacting mill operations with underground mine continuing to deliver ore; Expect Q1 production to
   move into remaining quarters

 TANAMI METRICS                                                                              2022A                               2023E

 Gold Production (Koz)                                                                        484                               420 – 460
 Gold CAS ($/oz)                                                                              $675                             $770 – $870
 Gold AISC ($/oz)*                                                                            $960                           $1,130 – $1,230
*AISC is a Non-GAAP measure, see endnotes

     FOURTH QUARTER 2022 RESULTS AND 2023 GUIDANCE                                                                    NEWMONT CORPORATION       15
TANAMI EXPANSION 2 – INVESTING IN FUTURE GROWTH AND PROFITABILITY ▪ Delivering 1.5 km deep production shaft to support Tanami’s future as a long-life, low-cost producer through at least 2040 ▪ Overall progress: ~50% complete – Engineering: 99% – Procurement: 96% – Construction: 40% ▪ Key focus areas: – Lining of the shaft through 2024 – Commence installation of major underground infrastructure TANAMI EXPANSION 2 PROJECT UPDATE Total Projected Capital Costs ($M) $1,200 – $1,300 Completion Date H2 2025 FOURTH QUARTER 2022 RESULTS AND 2023 GUIDANCE NEWMONT CORPORATION 16
GHANA OPERATIONS TO DELIVER ~1 MILLION OUNCES IN 2023

DELIVERED STRONG Q4 PERFORMANCE
▪ Ahafo Mill achieved record throughput for the quarter

▪ Akyem delivered highest production month in 7 years

STRONGLY POSITIONED FOR HIGHER OUNCES IN 2023
▪ Ahafo’s Subika underground mining rates expected to continue to improve, delivering higher grade ore to the mill

▪ Akyem commences a new layback to extend mine life; Lower production and higher unit costs expected

                                                                     AHAFO                                              AKYEM

METRICS                                                   2022A                    2023E                     2022A                  2023E

Gold Production (Koz)                                      574                   675 – 745                    420                  315 – 345
Gold CAS ($/oz)                                           $990                  $850 – $950                   $804                $850 – $950
Gold AISC ($/oz)*                                         $1,178              $1,010 – $1,110                 $972              $1,110 – $1,210
*AISC is a Non-GAAP measure, see endnotes
  FOURTH QUARTER 2022 RESULTS AND 2023 GUIDANCE                                                                      NEWMONT CORPORATION       17
AHAFO NORTH – EXPANDING OUR FOOTPRINT IN THE AHAFO COMPLEX
▪ Delivering a greenfield mine with initial 13-year mine life, ~300koz
average annual production and significant upside potential
▪ Overall progress: ~10% complete
– Engineering: 95%
– Procurement: 72%
▪ Gained land access in January 2023
▪ Commenced construction and highway relocation activities
AHAFO NORTH PROJECT UPDATE
Total Projected Capital Costs ($M) $950 – $1,050
Completion Date H2 2025
FOURTH QUARTER 2022 RESULTS AND 2023 GUIDANCE NEWMONT CORPORATION 18NON-MANAGED JOINT VENTURES – 2022 RESULTS & 2023 OUTLOOK
NEVADA GOLD MINES METRICS (38.5%) 2022A 2023E
Gold Production (Koz) 1,169 1,190 – 1,310
Gold CAS ($/oz) $989 $850 – $950
Gold AISC ($/oz)* $1,220 $1,150 – $1,250
PUEBLO VIEJO METRICS (40%)** 2022A 2023E
Gold Production (Koz) 285 315 – 345
*AISC is a Non-GAAP measure, see endnotes. **Attributable production includes Newmont’s 40% interest in Pueblo Viejo, which is accounted for as an equity method investment.
FOURTH QUARTER 2022 RESULTS AND 2023 GUIDANCE NEWMONT CORPORATION 192023 and
CREATING VALUE & IMPROVING LIVES
THROUGH SUSTAINABLE,
Long-Term Outlook
RESPONSIBLE MINING Tom Palmer, President & CEO
FOURTH QUARTER 2022 RESULTS AND 2023 GUIDANCE NEWMONT CORPORATION 20STRONGLY POSITIONED TO SAFELY DELIVER 2023
ATTRIBUTABLE GOLD GOLD COSTS GOLD ALL-IN
PRODUCTION* APPLICABLE TO SALES SUSTAINING COSTS**
5.7 – 6.3Moz $870 – 970/oz $1,150 – 1,250/oz
EXPLORATION & ADVANCED
SUSTAINING CAPITAL DEVELOPMENT CAPITAL***
PROJECTS
$475 – 525M $1.0 – 1.2B $1.2 – 1.4B
Meaningful Reinvestment in 2023 to Strengthen Global Portfolio
*Includes production from the Company’s equity method investment in the Pueblo Viejo joint venture. **See endnotes re non-GAAP metrics. ***Includes Tanami Expansion 2, Ahafo North, Yanacocha Sulfides, Pamour and Cerro Negro Expansion 1.
FOURTH QUARTER 2022 RESULTS AND 2023 GUIDANCE NEWMONT CORPORATION 21BASIS FOR DISCIPLINED 2023 OUTLOOK
PRICING ASSUMPTIONS AND SENSITIVITIES (as of February 23, 2023)
PRICE CHANGE (-/+) FCF in $M (+/-) AISC in $/oz (-/+)
Gold ($/oz) $1,700 $100 $400 $5
Australian Dollar $0.70 $0.05 $60 $15
Canadian Dollar $0.77 $0.05 $35 $10
Oil ($/bbl) $90 $10 $20 $5
Copper ($/lb) $3.50 $0.25 $15 –
Zinc ($/lb) $1.35 $0.10 $30 –
Silver ($/oz) $20.00 $1.00 $15 $2
Lead ($/lb) $0.90 $0.10 $10 –
2023 OPERATING COSTS BY CATEGORY*
PERCENT OF TOTAL CHANGE IN COST (-/+) FCF in $M (+/-) AISC in $/oz (-/+)
Labor Costs 50% 5% $90 $25
Materials & Consumables 30% 5% $50 $15
Fuel & Energy 15% 5% $30 $10
*”Other” category of 5% primarily includes freight, technology-related costs, employee administrative costs, rents and operating leases.
Incorporating ~3% YoY Cost Escalation at $1,700/oz Gold Price Assumption
FOURTH QUARTER 2022 RESULTS AND 2023 GUIDANCE NEWMONT CORPORATION 22GOLD PRODUCTION EXPECTED TO BE NATURALLY WEIGHTED TOWARD H2
H1 2023 PROJECTED H2 2023 PROJECTED
PRODUCTION PRODUCTION
45% 55%
Q1 EXPECTATION – 21% OF 2023 GOLD PRODUCTION
▪ Strong H2 weighting at Ahafo and Cerro Negro due to mine sequence
▪ Closure of Tanami track expected to delay production from Q1 to later in year
▪ Mine sequencing at Peñasquito results in lower Q1 production, compared to Q4
▪ ~25% of sustaining & development capital spend expected in Q1
Increasing Gold Production with Declining Unit Costs Throughout 2023
FOURTH QUARTER 2022 RESULTS AND 2023 GUIDANCE NEWMONT CORPORATION 23FIVE-YEAR OUTLOOK – STRONG GOLD PRODUCTION & IMPROVING COSTS
ATTRIBUTABLE GOLD PRODUCTION (Moz)* ALL-IN SUSTAINING COSTS ($/oz)**
7.0 $1,300
= Actual = Actual
= Outlook (+/-5%) = Outlook (+/-5%)
6.5
$1,100
6.0
$900
5.5
$700
5.0
$500
4.5
4.0 $300
2022A 2023E 2024E 2025E 2026E 2027E 2022A 2023E 2024E 2025E 2026E 2027E
▪ 90% of production from top-tier jurisdictions ▪ Improving AISC to $1,000 – $1,100/oz
▪ Ahafo North and Tanami Expansion 2 ramping up in 2025 ▪ Assuming higher labor and input costs persist through 2025
▪ Adding 1.2 – 1.4 MGEOs per year from copper, silver, lead and zinc*** ▪ Improvement driven by lower-cost ounces from reinvestment
*Attributable basis includes the Company’s equity method investment in Pueblo Viejo (40%).
**Represents the midpoint of the guidance range. All-In Sustaining Costs (or AISC) is a non-GAAP measure, see endnotes. CAS is $933/oz for 2022A, $890/oz-$990/oz for 2023E, $850/oz-$950/oz for 2024E, $780/oz-$880/oz for 2025, and $750/oz-$850/oz for 2026E and 2027E.
***See endnote re calculation of GEOs.
FOURTH QUARTER 2022 RESULTS AND 2023 GUIDANCE NEWMONT CORPORATION 24Capital Allocation Strategy
CREATING VALUE & IMPROVING LIVES
THROUGH SUSTAINABLE, Tom Palmer, President & CEO
RESPONSIBLE MINING
FOURTH QUARTER 2022 RESULTS AND 2023 GUIDANCE NEWMONT CORPORATION 25DISCIPLINED CAPITAL ALLOCATION STRATEGY
MAINTAINING FINANCIAL FLEXIBILITY
Sustain an Investment-Grade Balance Sheet with Strength & Flexibility
BALANCED INVESTING IN SUSTAINABLE PRODUCTION
CAPITAL ALLOCATION Reinvest in the Business to Improve Cash Margins Over the Long Term
STRATEGY
RETURNING CASH TO SHAREHOLDERS
Deliver Sustainable Returns Through Industry-Leading Dividend Framework
Balanced Approach to Deliver Long-Term Value Through the Cycle
FOURTH QUARTER 2022 RESULTS AND 2023 GUIDANCE NEWMONT CORPORATION 26THE INDUSTRY’S STRONGEST BALANCE SHEET
CASH AND SHORT-TERM NET DEBT TO
TOTAL LIQUIDITY*
BANK DEPOSITS* ADJUSTED EBITDA**
$6.7B
Cash Balance and Undrawn Revolving
$3.7B
Maintaining Strength During Time of
0.5x
Substantially Below Target of
Credit Facility Meaningful Reinvestment Less than 1.0x
WEIGHTED AVERAGE INVESTMENT-GRADE
NEXT DEBT MATURITY
COST OF DEBT BALANCE SHEET
4.1%
Industry’s First Sustainability Linked-
2029
Provides Flexibility in Executing on
BBB+ / Baa1
Credit ratings upgraded from S&P
Bond at 2.6% Capital Allocation Priorities and Moody’s
Upgraded to Baa1 and BBB+ by Moody’s and S&P in the last 2 years
Investment-Grade Balance Sheet with Strength and Flexibility
*As of Q4 2022; Cash balance includes $2,877M in cash and cash equivalents and $829M in time deposits, currently included in Time Deposits and Other Investments on the Consolidated Balance Sheets. **See endnotes.
FOURTH QUARTER 2022 RESULTS AND 2023 GUIDANCE NEWMONT CORPORATION 27INVESTING IN SUSTAINABLE PRODUCTION
ANNUAL INVESTMENT ($B) AVERAGE ANNUAL INVESTMENT: ~$2.5B *
$5.0 ▪ Sustaining capital: ~$1.0 – $1.2B per year
Sustaining Capital (+/- 5%)
Exploration and Advanced Projects (+/- 5%)
▪ Exploration & Advanced projects: ~$400 – $500M
Development Capital (+/- 5%)
Contributions to Pueblo Viejo (40%) for Expansion
per year
$4.0
▪ Development capital: ~$0.8 – $1.0B per year
$3.0
Average 2023: EXPECTING ~$2.9B INVESTMENT
Annual Investment*
▪ Sustaining capital: ~$1.1B
$2.0 ▪ Exploration & Advanced projects: ~$500M
▪ Development capital: ~$1.3B to advance
$1.0 Tanami Expansion 2, Ahafo North, and other
key projects
▪ Note: excludes contributions to support the
- Pueblo Viejo expansion
2021A 2022A 2023E 2024E 2025E 2026E 2027E
*Represents average annual spending over a 5-year period.
Elevated Level of Reinvestment of ~$400M in 2023
FOURTH QUARTER 2022 RESULTS AND 2023 GUIDANCE NEWMONT CORPORATION 28INVESTMENT DELIVERS A STEADY 10-YEAR PRODUCTION PROFILE
*
INDICATIVE 10-YEAR PRODUCTION PROFILE
(Attributable Moz per Year)
8 Total GEO Production**
7
Gold Production***
6
5
4
3
2
1
-
2023 2024 2025 2026 2027 2028 2029 2030 2031 2032
~6 Million Ounces of Gold per Year for the Next Decade with Upside from Other Metals
*Indicative production profile includes existing assets and Yanacocha Sulfides, Pamour, and Cerro Negro Expansion 1 (which remain subject to approval), resource conversion and high confidence inventory. See endnotes.
**Gold and GEO production assumptions as of February 23, 2023; see endnote re calculation of GEOs.
***Includes Newmont’s ownership interest of 38.5% in Nevada Gold Mines and 40% in Pueblo Viejo.
FOURTH QUARTER 2022 RESULTS AND 2023 GUIDANCE NEWMONT CORPORATION 292023 DIVIDEND PAYOUT RANGE SET WITHIN ESTABLISHED FRAMEWORK
2023 DIVIDEND PAYOUT RANGE*
$2.00 – $3.00
$1.40 – $1.80
Q4 2022
Dividend
$1.00 $1.00 $1.00
$1,400/oz $1,700/oz $2,000/oz
Declared a Q4 Dividend of $0.40/share, Resulting in a Dividend Yield of ~3%
*Investors are reminded that Newmont’s dividend framework is non-binding and an annualized dividend has not been declared by the Board. Dividends beyond the current quarter dividend remain subject to future consideration and declaration is the discretion of the Board. See endnote re
dividends and returns to shareholders.
FOURTH QUARTER 2022 RESULTS AND 2023 GUIDANCE NEWMONT CORPORATION 30Proposal to Combine
CREATING VALUE & IMPROVING LIVES
THROUGH SUSTAINABLE,
with Newcrest
RESPONSIBLE MINING Tom Palmer, President & CEO
FOURTH QUARTER 2022 RESULTS AND 2023 GUIDANCE NEWMONT CORPORATION 31NEWMONT & NEWCREST – A POWERFUL VALUE PROPOSITION
The New World-Class Delivering Driving
ESG STANDARD PORTFOLIO SYNERGIES CAPITAL ALLOCATION
Annual Production of 8Moz of Gold & Proven Track Record of Newmont Newmont Returned $6.7B to
Recognized Sustainability Leader
155ktonnes of Copper Team & Operating Model Shareholders Since 2019
Sharing industry-leading safety systems, Multi-decade low-cost production profile Value creation from scale, global supply Disciplined capital allocation strategy –
processes and culture with growth options in gold and copper chain, cost efficiencies, access to talent sustain, grow and deliver shareholder
and technology returns
Values-based organization driven by Unique combination of low-risk regional
a clear purpose production platforms in Australia and Productivity gains from technology, Maintaining the industry’s strongest
Canada complementary ore body experience balance sheet with flexibility throughout
Social engagement based on inclusion, and functional excellence the commodity cycle
transparency and integrity Optionality for portfolio rationalization
and project sequence optimization >$1B annual synergies from $10B World-class global capital markets
Commitment to leading environmental Goldcorp acquisition footprint and investor relevance
practices and achieving climate goals >$1.5B disposals following Goldcorp
acquisition
COMMITTED TO VALUE DISCIPLINE
FOURTH QUARTER 2022 RESULTS AND 2023 GUIDANCE NEWMONT CORPORATION 32Appendix FOURTH QUARTER 2022 RESULTS AND 2023 GUIDANCE NEWMONT CORPORATION 33
Five Year Outlook: Gold & Consolidated Metrics
     GUIDANCE METRIC                                2023E                  2024E                            2025E                             2026E                              2027E
     Gold ($1,700/oz price assumption)

     Attributable Gold Production (Moz)            5.7 – 6.3              5.9 – 6.5                       5.9 – 6.5                          6.1 – 6.7                         6.1 – 6.7

     Gold CAS ($/oz)*                            $870 – $970            $850 – $950                     $780 – $880                       $750 – $850                        $750 – $850

     Gold AISC ($/oz)*                          $1,150 – $1,250     $1,100 – $1,200                  $1,000 – $1,100                    $1,000 – $1,100                   $1,000 – $1,100

     Sustaining Capital ($M)                    $1,000 – $1,200     $1,000 – $1,200                  $1,000 – $1,200                    $1,000 – $1,200                   $1,000 – $1,200

     Development Capital ($M)                   $1,200 – $1,400     $1,200 – $1,400                   $800 – $1,000                       $500 – $700                        $300 – $500
     *Consolidated basis; see endnotes

     GUIDANCE METRIC                                2023E         (1)   The adjusted tax rate excludes certain items such as tax valuation allowance adjustments.
                                                                  (2)   Assuming average prices of $1,700 per ounce for gold, $3.50 per pound for copper, $20.00 per ounce for silver, $0.90 per
                                                                        pound for lead, and $1.35 per pound for zinc and achievement of current production and sales volumes and cost
     General & Administrative ($M)               $260 – $290            estimates, we estimate our consolidated adjusted effective tax rate related to continuing operations for 2023 will be
                                                                        between 32%-36%.
     Interest Expense ($M)                       $200 – $220
     Depreciation and Amortization ($M)         $2,200 – $2,400
     Exploration & Advanced Projects ($M)        $475 – $525
     Adjusted Tax Rate (%)1,2                     32% – 36%

FOURTH QUARTER 2022 RESULTS AND 2023 GUIDANCE                                                                                                           NEWMONT CORPORATION                        34
Five Year Outlook: Copper, Silver, Lead & Zinc
GUIDANCE METRIC 2023E 2024E 2025E 2026E 2027E
Copper ($3.50/lb price assumption)
Copper Production (Mlbs) 95 – 105 85 – 95 45 – 55 45 – 55 55 – 65
Copper CAS ($/lb)* $1.85 – $2.15
Copper AISC ($/lb)* $2.35 – $2.65
Silver ($20/oz price assumption)
Silver Production (Moz) 31 – 35 32 – 36 35 – 39 28 – 32 30 – 34
Silver CAS ($/oz)* $11.10 – $12.10
Silver AISC ($/oz)* $15.50 – $16.50
Lead ($0.90/lb price assumption)
Lead Production (Mlbs) 170 – 190 190 – 210 210 – 230 160 – 180 250 – 270
Lead CAS ($/lb)* $0.55 – $0.65
Lead AISC ($/lb)* $0.70 – $0.80
Zinc ($1.35/lb price assumption)
Zinc Production (Mlbs) 420 – 460 550 – 590 580 – 620 460 – 500 400 – 440
Zinc CAS ($/lb)* $0.65 – $0.75
Zinc AISC ($/lb)* $1.05 – $1.15
*Consolidated basis; see endnotes
FOURTH QUARTER 2022 RESULTS AND 2023 GUIDANCE NEWMONT CORPORATION 352023 Outlooka as of February 23, 2023
Consolidated Attributable Production Consolidated All-In Attributable Sustaining Attributable Development
2023 Outlook Production (Koz) (Koz) Consolidated CAS ($/oz) Sustaining Costsb ($/oz) Capital Expenditures ($M) Capital Expenditures ($M)
CC&V 160 – 180 160 – 180 1,150 – 1,250 1,580 – 1,680 25 – 35 —
Éléonore 265 – 295 265 – 295 960 – 1,060 1,300 – 1,400 55 – 65 —
Peñasquito 330 – 370 330 – 370 840 – 940 1,110 – 1,210 135 – 145 —
Porcupine 285 – 315 285 – 315 950 – 1,050 1,250 – 1,350 45 – 55 100 – 120
Musselwhite 200 – 220 200 – 220 860 – 960 1,290 – 1,390 65 – 75 —
Cerro Negro 315 – 345 315 – 345 850 – 950 1,060 – 1,160 45 – 55 110 – 130
Yanacocha 255 – 285 255 – 285 1,370 – 1,470 1,620 – 1,720 25 – 35 320 – 360
Merianc 315 – 345 235 – 265 980 – 1,080 1,230 – 1,330 35 – 45 —
Boddington 740 – 820 740 – 820 800 – 900 960 – 1,060 95 – 105 —
Tanami 420 – 460 420 – 460 770 – 870 1,130 – 1,230 115 – 125 340 – 380
Ahafo 675 – 745 675 – 745 850 – 950 1,010 – 1,110 75 – 85 5 – 15
Akyem 315 – 345 315 – 345 850 – 950 1,110 – 1,210 25 – 35 —
Ahafo North — — — — — 245 – 275
Nevada Gold Minesd 1,190 – 1,310 1,190 – 1,310 850 – 950 1,150 – 1,250 250 – 350 50 – 150
Pueblo Viejoe — 315 – 345 — — — —
Peñasquito - Silver (Moz) 31 – 35 31 – 35 11.10 – 12.10 15.50 – 16.50
Peñasquito - Lead (Mlbs) 170 – 190 170 – 190 0.55 – 0.65 0.70 – 0.80
Peñasquito - Zinc (Mlbs) 420 – 460 420 – 460 0.65 – 0.75 1.05 – 1.15
Boddington - Copper (Mlbs) 95 – 105 95 – 105 1.85 – 2.15 2.35 – 2.65
a 2023 outlook projections are considered forward-looking statements and represent management’s good faith estimates or expectations of future production results as of February 23, 2023. Outlook is based upon certain assumptions,
including, but not limited to, metal prices, oil prices, certain exchange rates and other assumptions. For example, 2023 Outlook assumes $1,700/oz Au, $3.50/lb Cu, $20.00/oz Ag, $1.35/lb Zn, $0.90/lb Pb, $0.70 USD/AUD exchange rate,
$0.77 USD/CAD exchange rate and $90/barrel WTI. Production, CAS, AISC and capital estimates exclude projects that have not yet been approved, except for Yanacocha Sulfides, Pamour and Cerro Negro District Expansion 1 which are
included in Outlook. The potential impact on inventory valuation as a result of lower prices, input costs, and project decisions are not included as part of this Outlook. Assumptions used for purposes of Outlook may prove to be incorrect
and actual results may differ from those anticipated, including variation beyond a +/-5% range. Outlook cannot be guaranteed. As such, investors are cautioned not to place undue reliance upon Outlook and forward-looking statements
as there can be no assurance that the plans, assumptions or expectations upon which they are placed will occur. Amounts may not recalculate to totals due to rounding. See cautionary at the end of this release.
b All-in sustaining costs (AISC) as used in the Company’s Outlook is a non-GAAP metric; see below for further information and reconciliation to consolidated 2023 CAS outlook.
c Consolidated production for Merian is presented on a total production basis for the mine site; attributable production represents a 75% interest for Merian.
d Represents the ownership interest in the Nevada Gold Mines (NGM) joint venture. NGM is owned 38.5% by Newmont and owned 61.5% and operated by Barrick. The Company accounts for its interest in NGM using the proportionate
consolidation method, thereby recognizing its pro-rata share of the assets, liabilities and operations of NGM.
e Attributable production includes Newmont’s 40% interest in Pueblo Viejo, which is accounted for as an equity method investment.
FOURTH QUARTER 2022 RESULTS AND 2023 GUIDANCE NEWMONT CORPORATION 36Adjusted Net Income (Loss)
Management uses Adjusted Net Income (Loss) to evaluate the Company’s operating performance and for planning and forecasting future business operations. The Company believes the use of Adjusted Net
Income (Loss) allows investors and analysts to understand the results of the continuing operations of the Company and its direct and indirect subsidiaries relating to the sale of products, by excluding certain items
that have a disproportionate impact on our results for a particular period. Adjustments to continuing operations are presented before tax and net of our partners’ noncontrolling interests, when applicable. The tax
effect of adjustments is presented in the Tax effect of adjustments line and is calculated using the applicable regional tax rate. Management’s determination of the components of Adjusted Net Income (Loss) are
evaluated periodically and based, in part, on a review of non-GAAP financial measures used by mining industry analysts. Net income (loss) attributable to Newmont stockholders is reconciled to Adjusted net income
(loss) as follows:
Three Months Ended Year Ended (1) Per share measures may not recalculate due to rounding.
December 31, 2022 December 31, 2022 (2) For additional information regarding our discontinued operations, see Note 1 to our Consolidated Financial Statements.
(3) Adjusted net income (loss) per diluted share is calculated using diluted common shares, which are calculated in accordance
per share data (1) per share data (1)
with U.S. GAAP. For the year ended December 31, 2022, potentially dilutive shares of 1 million were excluded from the
basic diluted basic diluted computation of diluted loss per common share attributable to Newmont stockholders in the Consolidated Statement of
Operations as they were antidilutive. These shares were included in the computation of adjusted net income per diluted
Net income (loss) attributable to Newmont share for the year ended December 31, 2022.
stockholders $ (1,477) $ (1.86) $ (1.86) $ (429) $ (0.54) $ (0.54) (4) Impairment charges, included in Impairment charges represents non-cash write-downs of long-lived assets and goodwill.
(5) Reclamation and remediation charges, net, included in Reclamation and remediation, represent revisions to the reclamation
Net loss (income) attributable to Newmont and remediation plans and cost estimates at the Company’s former operating properties and historic mining operations that
stockholders from discontinued operations (2) (11) (0.01) (0.01) (30) (0.04) (0.04) have entered the closure phase and have no substantive future economic value.
(6) Pension settlements, included in Other income (loss), net, represents pension settlement charges related to the annuitization
Net income (loss) attributable to Newmont of certain defined benefit plans.
stockholders from continuing operations (1,488) (1.87) (1.87) (459) (0.58) (0.58) (7) Change in fair value of investments, included in Other income (loss), net, primarily represents unrealized gains and losses
Impairment charges (4) 1,317 1.66 1.66 1,320 1.66 1.66 related to the Company's investment in current and non-current marketable and other equity securities.
(8) Gain on asset and investment sales, included in Gain on asset and investment sales, net, primarily represents gains recognized
Reclamation and remediation charges, net (5) 700 0.88 0.88 713 0.90 0.90 on the sale of the investment in MARA, the disposal of trucks at Boddington and the sale of a royalty at NGM, partially offset
by the loss recognized on the sale of the La Zanja equity method investment for the year ended 2022.
Pension settlements (6) 7 0.01 0.01 137 0.17 0.17 (9) Settlement costs, included in Other expense, net, primarily represents a legal settlement and a voluntary contribution made
Change in fair value of investments (7) (45) (0.06) (0.06) 46 0.06 0.06 to support humanitarian efforts in Ukraine.
(10) Restructuring and severance, net, included in Other expense, net, primarily represents severance and related costs
Gain on asset and investment sales (8) (61) (0.08) (0.08) (35) (0.04) (0.04) associated with significant organizational or operating model changes implemented by the Company.
(11) COVID-19 specific costs, included in Other expense, net, represents amounts distributed from the Newmont Global
Settlement costs (9) 2 — — 22 0.03 0.03
Community Fund to help host communities, governments and employees combat the COVID-19 pandemic. Adjusted net
Restructuring and severance (10) 1 — — 4 0.01 0.01 income (loss) has not been adjusted for $2 and $35, respectively, of incremental COVID-19 costs incurred as a result of
actions taken to protect against the impacts of the COVID-19 pandemic at our operational sites.
COVID-19 specific costs (11) 2 — — 3 — —
(12) Primarily represents for the year ended, an $11 reimbursement of certain historical Goldcorp operational expenses related
Other (12) (3) — — (21) (0.03) (0.03) to a legacy project that reached commercial production in the second quarter of 2022 and $7 of penalty income from an
energy vendor early terminating a contract in 2022, included Other income (loss), net.
Tax effect of adjustments (13) (283) (0.35) (0.35) (344) (0.44) (0.44)
(13) The tax effect of adjustments, included in Income and mining tax benefit (expense), represents the tax effect of adjustments
Valuation allowance and other tax in footnotes (4) through (12), as described above, and are calculated using the applicable regional tax rate.
adjustments, net (14) 199 0.25 0.25 82 0.11 0.11 (14) Valuation allowance and other tax adjustments, net, included in Income and mining tax benefit (expense), is recorded for
items such as foreign tax credits, alternative minimum tax credits, capital losses, disallowed foreign losses, and the effects of
$ 348 $ 0.44 $ 0.44 $ 1,468 $ 1.85 $ 1.85
changes in foreign currency exchange rates on deferred tax assets and deferred tax liabilities. The adjustment for the three
months and the year ended December 31, 2022, reflects the net increase or (decrease) to net operating losses, capital
losses, tax credit carryovers, and other deferred tax assets subject to valuation allowance of $178 and $246, respectively, the
Weighted average common shares (millions): (3) 794 795 794 795 expiration of U.S. foreign tax credit carryovers of $31 and $31, respectively, the effects of changes in foreign exchange rates
on deferred tax assets and liabilities of $(38) and $(86), respectively, net removal to the reserve for uncertain tax positions of
$5 and $(8), respectively, a tax settlement in Mexico of $— and $(125), respectively, and other tax adjustments of $23 and
$24, respectively. Total amount is presented net of income (loss) attributable to noncontrolling interests of $199 and $82,
respectively.
FOURTH QUARTER 2022 RESULTS AND 2023 GUIDANCE NEWMONT CORPORATION 37EBITDA and Adjusted EBITDA
Management uses earnings before interest, taxes and depreciation and amortization (“EBITDA”) and EBITDA adjusted for non-core or certain items that have a disproportionate impact on our results for a
particular period (“Adjusted EBITDA”) as non-GAAP measures to evaluate the Company’s operating performance. EBITDA and Adjusted EBITDA do not represent, and should not be considered an alternative to, net
income (loss), operating income (loss), or cash flow from operations as those terms are defined by GAAP, and do not necessarily indicate whether cash flows will be sufficient to fund cash needs. Although
Adjusted EBITDA and similar measures are frequently used as measures of operations and the ability to meet debt service requirements by other companies, our calculation of Adjusted EBITDA is not necessarily
comparable to such other similarly titled captions of other companies. The Company believes that Adjusted EBITDA provides useful information to investors and others in understanding and evaluating our
operating results in the same manner as our management and Board of Directors. Management’s determination of the components of Adjusted EBITDA are evaluated periodically and based, in part, on a review
of non-GAAP financial measures used by mining industry analysts. Net income (loss) attributable to Newmont stockholders is reconciled to EBITDA and Adjusted EBITDA as follows:
Three Months Ended Year Ended (1) For additional information regarding our discontinued operations, refer to Note 1 to our Consolidated Financial Statements.
December 31, December 31, (2) Impairment charges, included in Impairment charges represents non-cash write-downs of long-lived assets and goodwill.
(3) Reclamation and remediation charges, included in Reclamation and remediation, represent revisions to the reclamation and
2022 2021 2022 2021 remediation plans and cost estimates at the Company’s former operating properties and historic mining operations that
Net income (loss) attributable to Newmont stockholders $ (1,477) $ (46) $ (429) $ 1,166 have entered the closure phase and have no substantive future economic value.
(4) Pension settlements, included in Other income (loss), net, primarily represents pension settlement charges related to the
Net income (loss) attributable to noncontrolling interests 19 (718) 60 (933) annuitization of certain defined benefit plans and lump sum payments to participants in 2022 and related to lump sum
Net (income) loss from discontinued operations (1) (11) (15) (30) (57) payments to participants in 2021.
(5) Change in fair value of investments, included in Other income (loss), net, primarily represents unrealized gains and losses
Equity loss (income) of affiliates (26) (28) (107) (166) related to the Company's investments in current and non-current marketable and other equity securities.
Income and mining tax expense (benefit) 112 300 455 1,098 (6) Gain on asset and investment sales, included in Gain on asset and investment sales, net, primarily represents gains
recognized on the sale of the investment in MARA, the disposal of trucks at Boddington and the sale of a royalty at NGM,
Depreciation and amortization 571 639 2,185 2,323 partially offset by the loss recognized on the sale of the La Zanja equity method investment in 2022; and the gain on the
Interest expense, net 53 66 227 274 sale of the Kalgoorlie Power business, gain on the NGM Lone Tree and South Arturo exchange transaction, and gain on the
sale of TMAC in 2021.
EBITDA $ (759) $ 198 $ 2,361 $ 3,705 (7) Settlement costs, included in Other expense, net, primarily represents a legal settlement and a voluntary contribution made
Adjustments: to support humanitarian efforts in Ukraine in 2022; and a voluntary contribution made to the Republic of Suriname in 2021.
(8) Restructuring and severance, included in Other expense, net, primarily represents severance and related costs associated
Impairment charges (2) 1,317 7 1,320 25 with significant organizational and operating model changes implemented by the Company for all periods presented.
Reclamation and remediation charges (3) $ 700 $ 1,587 $ 713 $ 1,696 (9) COVID-19 specific costs, included in Other expense, net, primarily includes amounts distributed from Newmont Global
Community Support Fund to help host communities, governments and employees combat the COVID-19 pandemic.
Pension settlements (4) 7 4 137 4 (10) Loss on assets held for sale, included in Loss on assets held for sale, represents the loss recognized due to the reclassification
of the Conga mill assets as held for sale during 2021. The assets were remeasured to fair value less costs to sell.
Change in fair value of investments (5) (45) (45) 46 135
(11) Loss on debt extinguishment, included in Other income (loss), net, primarily represents losses on the debt tender offer and
Gain on asset and investment sales (6) (61) (166) (35) (212) subsequent extinguishment of the 2023 Newmont Senior Notes and the 2023 Goldcorp Senior Notes during 2021.
(12) Impairment of investments, included in Other income (loss), net, represents other-than-temporary impairment of other
Settlement costs (7) 2 — 22 11
investments.
Restructuring and severance (8) 1 1 4 11 (13) Primarily represents for the year ended, an $11 reimbursement of certain historical Goldcorp operational expenses related
to a legacy project that reached commercial production in the second quarter of 2022 and $7 of penalty income from an
COVID-19 specific costs (9) 2 2 3 5
energy vendor early terminating a contract in 2022, included Other income (loss), net.
Loss on assets held for sale (10) — — — 571 (14) Adjusted EBITDA has not been adjusted for $—, $—, $—, and $8 of cash care and maintenance costs, included in Other
expense, net, which primarily represent costs incurred associated with certain mine sites being temporarily placed into care
Loss on debt extinguishment (11) — 11 — 11
and maintenance in response to the COVID-19 pandemic for the three months and years ended December 31, 2022 and
Impairment of investments (12) — — — 1 2021, respectively.
Other (13) (3) — (21) —
Adjusted EBITDA (14) $ 1,161 $ 1,599 $ 4,550 $ 5,963
FOURTH QUARTER 2022 RESULTS AND 2023 GUIDANCE NEWMONT CORPORATION 38Free Cash Flow
Management uses Free Cash Flow as a non-GAAP measure to analyze cash flows generated from operations. Free Cash Flow is Net cash provided by (used in) operating activities less Net cash provided by (used in)
operating activities of discontinued operations less Additions to property, plant and mine development as presented on the Consolidated Statements of Cash Flows. The Company believes Free Cash Flow is also
useful as one of the bases for comparing the Company’s performance with its competitors. Although Free Cash Flow and similar measures are frequently used as measures of cash flows generated from
operations by other companies, the Company’s calculation of Free Cash Flow is not necessarily comparable to such other similarly titled captions of other companies.
The presentation of non-GAAP Free Cash Flow is not meant to be considered in isolation or as an alternative to net income as an indicator of the Company’s performance, or as an alternative to cash flows from
operating activities as a measure of liquidity as those terms are defined by GAAP, and does not necessarily indicate whether cash flows will be sufficient to fund cash needs. The Company’s definition of Free
Cash Flow is limited in that it does not represent residual cash flows available for discretionary expenditures due to the fact that the measure does not deduct the payments required for debt service and other
contractual obligations or payments made for business acquisitions. Therefore, the Company believes it is important to view Free Cash Flow as a measure that provides supplemental information to the
Company’s Consolidated Statements of Cash Flows.
The following table sets forth a reconciliation of Free Cash Flow, a non-GAAP financial measure, to Net cash provided by (used in) operating activities, which the Company believes to be the GAAP financial
measure most directly comparable to Free Cash Flow, as well as information regarding Net cash provided by (used in) investing activities and Net cash provided by (used in) financing activities.
Three Months Ended Year Ended
December 31, December 31,
2022 2021 2022 2021
Net cash provided by (used in) operating activities $ 1,010 $ 1,299 $ 3,220 $ 4,279
Less: Net cash used in (provided by) operating activities of discontinued operations — — (22) (13)
Net cash provided by (used in) operating activities of continuing operations 1,010 1,299 3,198 4,266
Less: Additions to property, plant and mine development (646) (441) (2,131) (1,653)
Free Cash Flow $ 364 $ 858 $ 1,067 $ 2,613
Net cash provided by (used in) investing activities (1) $ (726) $ (351) $ (2,983) $ (1,868)
Net cash provided by (used in) financing activities $ (479) $ (595) $ (2,356) $ (2,958)
(1) Net cash provided by (used in) investing activities includes Additions to property, plant and mine development, which is included in the Company’s computation of Free Cash Flow.
FOURTH QUARTER 2022 RESULTS AND 2023 GUIDANCE NEWMONT CORPORATION 39Attributable Free Cash Flow
Management uses Attributable Free Cash Flow as a non-GAAP measure to analyze cash flows generated from operations that are attributable to the Company. Attributable Free Cash Flow is Net cash provided by
(used in) operating activities after deducting net cash flows from operations attributable to noncontrolling interests less Net cash provided by (used in) operating activities of discontinued operations after deducting
net cash flows from discontinued operations attributable to noncontrolling interests less Additions to property, plant and mine development after deducting property, plant and mine development attributable to
noncontrolling interests. The Company believes that Attributable Free Cash Flow is useful as one of the bases for comparing the Company’s performance with its competitors. Although Attributable Free Cash
Flow and similar measures are frequently used as measures of cash flows generated from operations by other companies, the Company’s calculation of Attributable Free Cash Flow is not necessarily comparable
to such other similarly titled captions of other companies.
The presentation of non-GAAP Attributable Free Cash Flow is not meant to be considered in isolation or as an alternative to Net income attributable to Newmont stockholders as an indicator of the Company’s
performance, or as an alternative to Net cash provided by (used in) operating activities as a measure of liquidity as those terms are defined by GAAP, and does not necessarily indicate whether cash flows will be
sufficient to fund cash needs. The Company’s definition of Attributable Free Cash Flow is limited in that it does not represent residual cash flows available for discretionary expenditures due to the fact that the
measure does not deduct the payments required for debt service and other contractual obligations or payments made for business acquisitions. Therefore, the Company believes it is important to view
Attributable Free Cash Flow as a measure that provides supplemental information to the Company’s Condensed Consolidated Statements of Cash Flows.
The following tables set forth a reconciliation of Attributable Free Cash Flow, a non-GAAP financial measure, to Net cash provided by (used in) operating activities, which the Company believes to be the GAAP
financial measure most directly comparable to Attributable Free Cash Flow, as well as information regarding Net cash provided by (used in) investing activities and Net cash provided by (used in) financing activities.
Three Months Ended December 31, 2022 Year Ended December 31, 2022
Attributable to Attributable to Attributable to Attributable to
noncontrolling Newmont noncontrolling Newmont
Consolidated interests (1) Stockholders Consolidated interests (1) Stockholders
Net cash provided by (used in) operating activities $ 1,010 $ (19) $ 991 $ 3,220 $ (83) $ 3,137
Less: Net cash used in (provided by) operating activities of discontinued
operations — — — (22) — (22)
Net cash provided by (used in) operating activities of continuing operations 1,010 (19) 991 3,198 (83) 3,115
Less: Additions to property, plant and mine development (2) (646) 4 (642) (2,131) 29 (2,102)
Free Cash Flow $ 364 $ (15) $ 349 $ 1,067 $ (54) $ 1,013
Net cash provided by (used in) investing activities (3) $ (726) $ (2,983)
Net cash provided by (used in) financing activities $ (479) $ (2,356)
(1) Adjustment to eliminate a portion of Net cash provided by (used in) operating activities, Net cash provided by (used in) operating activities of discontinued operations and Additions to property, plant and mine development attributable to noncontrolling interests, which
primarily relates to Merian (25%) for the three months and year ended December 31, 2022 and Yanacocha (48.65%) and Merian (25%) for the three months and year ended December 31, 2021. The Company acquired the remaining interest in Yanacocha in 2022,
resulting in 100% ownership interest at December 31, 2022.
(2) For the three months and year ended December 31, 2022, Yanacocha had total consolidated Additions to property, plant and mine development of $166 and $403, respectively, on a cash basis. For the three months and year ended December 31, 2022, Merian had total
consolidated Additions to property, plant and mine development of $19 and $56, respectively, on a cash basis.
(3) Net cash provided by (used in) investing activities includes Additions to property, plant and mine development, which is included in the Company’s computation of Free Cash Flow.
FOURTH QUARTER 2022 RESULTS AND 2023 GUIDANCE NEWMONT CORPORATION 40You can also read