Second Quarter 2021 Investor Presentation - Managing Key Value Drivers to Maximize Full Cycle Returns - United Rentals
←
→
Page content transcription
If your browser does not render page correctly, please read the page content below
Second Quarter 2021 Investor Presentation
Managing Key Value Drivers to Maximize Full Cycle Returns

   United Rentals, Inc., 100 First Stamford Place, Stamford, CT 06902. © 2021 United Rentals, Inc. All rights reserved.
Introductory Information
Unless otherwise specified, the information in this presentation, including forward-looking statements, is as of our most recent earnings call held on July 29, 2021. We make no commitment to update any such information contained in this
presentation.

Certain statements in this presentation are forward-looking statements within the meaning of Section 21E of the Securities Exchange Act of 1934, as amended, and the Private Securities Litigation Reform Act of 1995, known as the
PSLRA. These statements can generally be identified by the use of forward-looking terminology such as “believe,” “expect,” “may,” “will,” “should,” “seek,” “on-track,” “plan,” “project,” “forecast,” “intend,” “anticipate” or “target,” or the negative
thereof or comparable terminology, or by discussions of vision, strategy or outlook. These statements are based on current plans, estimates and projections, and, therefore, you should not place undue reliance on them. No forward-looking
statement can be guaranteed, and actual results may differ materially from those projected. Factors that could cause actual results to differ materially from those projected include, but are not limited to, the following: (1) the cyclical nature of our
business, which is highly sensitive to North American construction and industrial activities; if construction or industrial activity decline, our revenues and, because many of our costs are fixed, our profitability may be adversely affected; (2)
uncertainty regarding emerging variant strains of the coronavirus (COVID-19), and regarding the length of time it will take for the COVID-19 pandemic to subside, including the time it will take for vaccines to be broadly distributed and accepted
in the United States and the rest of the world, and the effectiveness of such vaccines in slowing or stopping the spread of COVID-19 and mitigating the economic effects of the pandemic; (3) the impact of the COVID-19 pandemic on global
economic conditions, including the impact of the various measures that have been implemented to protect public health, many of which reduced, and could in the future again reduce, demand for equipment rentals; (4) the impact of global
economic conditions (including potential trade wars) and public health crises and epidemics, such as COVID-19, on us, our customers and our suppliers, in the United States and the rest of the world; (5) rates we charge and time utilization we
achieve being less than anticipated (including as a result of COVID-19); (6) excess fleet in the equipment rental industry, including as a result of reduced demand for fleet due to the impacts of COVID-19 on our customers; (7) inability to benefit
from government spending, including spending associated with infrastructure projects; (8) trends in oil and natural gas could adversely affect the demand for our services and products; (9) competition from existing and new competitors; (10) our
significant indebtedness, which requires us to use a substantial portion of our cash flow for debt service and can constrain our flexibility in responding to unanticipated or adverse business conditions; (11) the inability to refinance our
indebtedness on terms that are favorable to us (including as a result of volatility and uncertainty in capital markets due to COVID-19), or at all; (12) the incurrence of additional debt, which could exacerbate the risks associated with our current
level of indebtedness; (13) noncompliance with financial or other covenants in our debt agreements, which could result in our lenders terminating the agreements and requiring us to repay outstanding borrowings; (14) restrictive covenants and
amount of borrowings permitted in our debt instruments, which can limit our financial and operational flexibility; (15) inability to access the capital that our businesses or growth plans may require (including as a result of uncertainty in capital or
other financial markets due to COVID-19); (16) the possibility that companies that we have acquired or may acquire could have undiscovered liabilities or involve other unexpected costs, may strain our management capabilities or may be
difficult to integrate; (17) the incurrence of impairment charges; (18) fluctuations in the price of our common stock and inability to complete stock repurchases in the time frame and/or on the terms anticipated (for example, due to COVID-19);
(19) our charter provisions as well as provisions of certain debt agreements and our significant indebtedness may have the effect of making more difficult or otherwise discouraging, delaying or deterring a takeover or other change of control of
us; (20) inability to manage credit risk adequately or to collect on contracts with a large number of customers; (21) turnover in our management team and inability to attract and retain key personnel, as well as loss, absenteeism or the inability of
employees to work or perform key functions in light of public health crises or epidemics (including COVID-19); (22) costs we incur being more than anticipated and the inability to realize expected savings in the amounts or time frames planned;
(23) inability to obtain equipment and other supplies for our business from key suppliers on acceptable terms or at all, as a result of supply chain disruptions, insolvency, financial difficulties or other factors; (24) increases in our maintenance and
replacement costs and/or decreases in the residual value of our equipment; (25) inability to sell our new or used fleet in the amounts, or at the prices, we expect; (26) risks related to security breaches, cybersecurity attacks, failure to protect
personal information, compliance with data protection laws and other significant disruptions in our information technology systems; (27) risks related to climate change and climate change regulation; (28) the fact that our holding company
structure requires us to depend in part on distributions from subsidiaries and such distributions could be limited by contractual or legal restrictions; (29) shortfalls in our insurance coverage; (30) increases in our loss reserves to address business
operations or other claims and any claims that exceed our established levels of reserves; (31) incurrence of additional expenses (including indemnification obligations) and other costs in connection with litigation, regulatory and investigatory
matters; (32) the costs of complying with environmental, safety and foreign laws and regulations, as well as other risks associated with non-U.S. operations, including currency exchange risk, and tariffs; (33) the outcome or other potential
consequences of regulatory matters and commercial litigation; (34) labor disputes, work stoppages or other labor difficulties, which may impact our productivity, and potential enactment of new legislation or other changes in law affecting our
labor relations or operations generally; and (35) the effect of changes in tax law. For a more complete description of these and other possible risks and uncertainties, please refer to our Annual Report on Form 10-K for the year ended
December 31, 2020, as well as to our subsequent filings with the SEC. The forward-looking statements contained herein speak only as of the date hereof, and we make no commitment to update or publicly release any revisions to forward-
looking statements in order to reflect new information or subsequent events, circumstances or changes in expectations.

Note: This presentation provides information about free cash flow, EBITDA, adjusted EBITDA and adjusted EPS, which are non-GAAP financial measures. This presentation includes a reconciliation between free cash flow and GAAP cash
from operations, a reconciliation between both adjusted EBITDA and EBITDA, on the one hand, and GAAP net income, on the other hand, a reconciliation between both adjusted EBITDA and EBITDA, on the one hand, and GAAP cash from
operations, on the other hand, a reconciliation between adjusted EPS and GAAP EPS and a reconciliation between forward-looking free cash flow and forward-looking GAAP cash from operations. Information reconciling forward-looking
adjusted EBITDA to GAAP financial measures is unavailable to the company without unreasonable effort. The company is not able to provide reconciliations of forward looking adjusted EBITDA to GAAP financial measures because certain
items required for such reconciliations are outside of the company’s control and/or cannot be reasonably predicted, such as the provision for income taxes. Preparation of such reconciliations would require a forward-looking balance sheet,
statement of income and statement of cash flow, prepared in accordance with GAAP, and such forward-looking financial statements are unavailable to the company without unreasonable effort. The company provides a range for its adjusted
EBITDA forecast that it believes will be achieved, however it cannot accurately predict all the components of the adjusted EBITDA calculation.

                                                                                                                                                                                                                                                      2
                                                         United Rentals, Inc., 100 First Stamford Place, Stamford, CT 06902. © 2021 United Rentals, Inc. All rights reserved.
Contents

                                      1. Introduction
                                      2. End-Market Overview
                                      3. Company Overview
                                      4. Summary of Key Financial Data
                                      5. Appendix

United Rentals, Inc., 100 First Stamford Place, Stamford, CT 06902. © 2021 United Rentals, Inc. All rights reserved.   3
1                                      Introduction

United Rentals, Inc., 100 First Stamford Place, Stamford, CT 06902. © 2021 United Rentals, Inc. All rights reserved.

Maximizing value creation across the
cycle by balancing growth, margins and
     free cash flow to drive returns

  Aggressive management of key value drivers within our control

                                                                  5
Company overview
(1)
#1 Market Share
• 2020 total revenue $8.53 billion (-8.8% Y/Y)
• 2020 adjusted EBITDA(2) $3.93 billion (-9.7 Y/Y; 46.1% margin)
1,275 locations across North America(3)
• 1,135 branches in the U.S.; locations in 49 of 50 states
United
Rentals • 140 branches in Canada; locations in all 10 provinces
Other 13% • 11 European branches in France, Germany, the United Kingdom
75% and the Netherlands
• 28 branches in Australia
• 18 branches in New Zealand
$15.1B of fleet comprised of 745,000 units(4)
Highly diversified product and end-market mix
Team of approximately 19,900 employees(5)
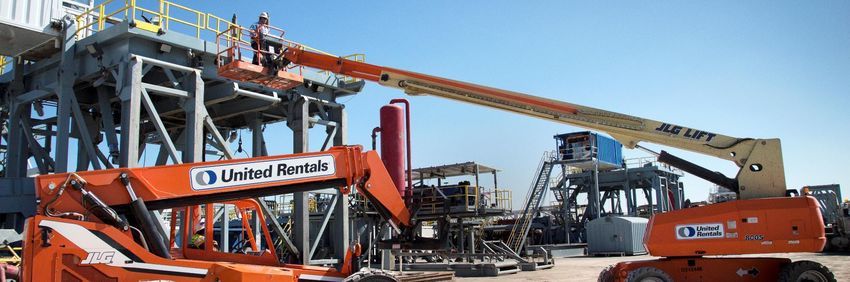
United Rentals is the North American equipment rental leader
(1) North American market share is based on 2020 rental revenues and American Rental Association (“ARA”) industry estimates. Based on the ARA estimates, (2) Adjusted EBITDA is a non-GAAP measure. See the tables provided elsewhere in this presentation for reconciliations
2020 North American equipment rental industry revenue decreased approximately 12 percent year-over-year. In 2020, our full year rental revenue decreased to the most comparable GAAP measures.
by 10.3 percent year-over-year. The decline in rental revenue includes the impact of COVID-19. We estimate that our North American market share of (3) As of June 30 2021. Excludes 11 European branches in France, Germany, the United Kingdom and the Netherlands,
approximately 13 percent increased slightly in 2020. 28 in Australia and 18 in New Zealand. Total global branch count 1,332.
(4) As of June 30, 2021. Average fleet age 55.1 months.
(5)
United Rentals, Inc., 100 First Stamford Place, Stamford, CT 06902. © 2021 United Rentals, Inc. All rights reserved.
As of June 30, 2021. 6
Our customers and the benefits of renting vs. owning
                                             Customer Mix*                                                                                                          Why Customers Rent Instead of Buy
       Residential construction
                                                                                                                                                                    •   Control expenses and inventory
       • Multi-Family
                                                                                                                      Industrial                                    •   The right equipment for any job
                                                                                                                       & Other
                                                        5%                                                                                                          •   24/7 customer care / support
                                                                                                                •    Downstream
                                                                                                                                                                    •   No need for maintenance
                                                                                                                •    Chemical
                                                                                                                •    Oil & gas                                      •   Save on storage/warehousing
                                                                                           46%                  •    Power / Utilities
                                                 Verticals                                                                                                          •   Reliability / reduce downtime
                                                                                                                •    Manufacturing
       Non-residential                 49%                                                                      •
       construction                                                                                                  Food & beverage                                •   Save on disposable costs
                                                                                                                •    Pulp & paper
       •   Private non-res                                                                                                                                          •   Equipment tracking
                                                                                                                •    Biotech & Pharma
       •   Public non-res
                                                                                                                •    Disaster response                              •   Conserve capital
       •   Infrastructure
       •   Construction & MRO                                                                                   •    Metals & Mining
                                                                                                                •    Entertainment                                  •   Manage risk

                         Despite diverse needs, customers derive many benefits from renting
*Note: Based on 2020 rental revenue.

                                             United Rentals, Inc., 100 First Stamford Place, Stamford, CT 06902. © 2021 United Rentals, Inc. All rights reserved.
                                                                                                                                                                                                          7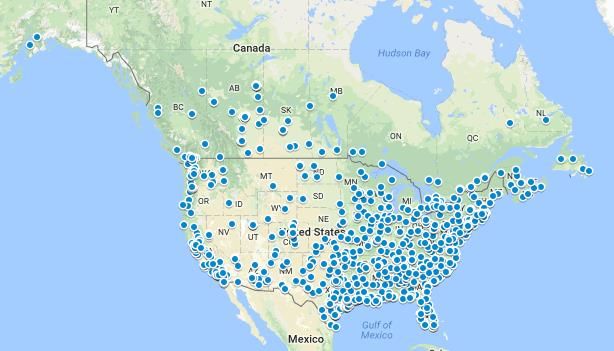
Branch locations

                                                                                                                                                                                  North American
                                                                                                                                                                                  branch count 1,275(1)
                                                                                                                                                                                  • General Rentals: 838 locations
                                                                                                                                                                                  • Specialty: 437 locations(2)

                                                                                                                                                                                  Largest U.S. states by
                                                                                                                                                                                  number of locations(1)
                                                                                                                                                                                  •   Texas: 162
                                                                                                                                                                                  •   California: 115
                                                                                                                                                                                  •   Florida: 72
                                                                                                                                                                                  •   Louisiana: 51
                                                                                                                                                                                  •   Georgia: 46

                                                           Largest and broadest footprint in North America
(1)   As of June 30, 2021, 1,275 locations in North America, 11 in Europe, 28 in Australia and 18 in New Zealand, total global branch count of 1,332.
(2)   Specialty branch count presented above includes Tools and Reliable Onsite Services branches that are part of our General Rentals reporting segment. Global specialty branch count of 494, including 11 in Europe, 28 in Australia and 18 in New
      Zealand.

                                                           United Rentals, Inc., 100 First Stamford Place, Stamford, CT 06902. © 2021 United Rentals, Inc. All rights reserved.                                                                         8
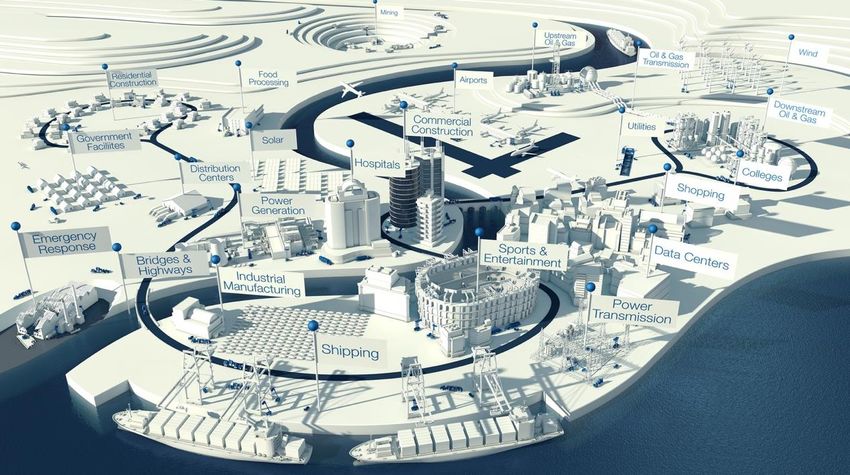
Diverse end-market exposure
                                                                                                                                                                               Infrastructure
                                                                                                                                                                               Non-Res Construction
                                                                                                                                                                               Residential
                                                                                                                                                                               Downstream O&G
                                                                                                                                                                               Midstream O&G
                                                                                                                                                                               Upstream O&G
                                                                                                                                                                2020 Revenue   Chemical Processing
                                                                                                                                                                 by Vertical
                                                                                                                                                                               Consumer-related
                                                                                                                                                                               Industrial Manufacturing
                                                                                                                                                                               Metals & Minerals
                                                                                                                                                                               Power
                                                                                                                                                                               Pulp, Paper & Wood
                                                                                                                                                                               All Other

                                       Broad customer base helps reduce full-cycle volatility
*Note: Based on 2020 rental revenue.

                                         United Rentals, Inc., 100 First Stamford Place, Stamford, CT 06902. © 2021 United Rentals, Inc. All rights reserved.
                                                                                                                                                                                                          9
A decade of continued financial improvement…
                       Total Revenue                                                                                Adjusted EBITDA(1)                                                                 Adjusted EPS(1)

  $9,000M                                                                                         $4,500M                                                                            $20
  $8,000M                               CAGR                                                      $4,000M                                        CAGR                                $18                               CAGR
  $7,000M                              14.3%                                                      $3,500M                                       19.0%                                $16                              48.7%
  $6,000M                                                                                         $3,000M                                                                            $14
                                                                                                                                                                                     $12
  $5,000M                                                                                         $2,500M
                                                                                                                                                                                     $10
  $4,000M                                                                                         $2,000M
                                                                                                                                                                                      $8
  $3,000M                                                                                         $1,500M                                                                             $6
  $2,000M                                                                                         $1,000M                                                                             $4
  $1,000M                                                                                           $500M                                                                             $2
       $0                                                                                               $0                                                                            $0
                       2010                2015                 2020                                                        2010                     2015                     2020                  2010                   2015                  2020

   Strong revenue growth                                                                            Powerful EBITDA growth                                                           Meaningful EPS growth
   •    Trailing 5-year CAGR: +8.0%                                                                 •    Trailing 5-year CAGR: +6.8%                                                 •   Trailing 5-year CAGR: +16.8% vs. +2.9% for the
   •    Trailing 10-year CAGR: +14.3%                                                               •    Trailing 10-year CAGR: +19.0%                                                   S&P 500 over the same period
                                                                                                                                                                                     •   Trailing 10-year CAGR: +48.7% vs. +4.4% for the
   Improved diversification                                                                         Sharply higher margins                                                               S&P 500 over the same period
   •    Increased industrial exposure                                                               •    Adj. EBITDA margins up ~1,300 bps vs. 2008 (2)
   •    Increased non-cyclical specialty exposure                                                   •    Adj. EBITDA margins up ~2,000 bps vs 2009 (3)

                                    Ongoing transformation of the company’s financial performance
Notes:
(1) Adjusted EBITDA and Adjusted EPS are non-GAAP measures. Adjusted EBITDA margin represents adjusted EBITDA divided by total revenue. See the tables provided elsewhere in this presentation for reconciliations to the most comparable GAAP measures.
(2) Reflects change/ improvement since peak of the last cycle relative to 2020.
(3) Reflects change/ improvement since trough of the last cycle relative to 2020.

                                                           United Rentals, Inc., 100 First Stamford Place, Stamford, CT 06902. © 2021 United Rentals, Inc. All rights reserved.
                                                                                                                                                                                                                                                           10
…that has ultimately been reflected in free cash flow
2011-2020 Average Free Cash Flow Conversion: 124%(2)
Free Cash
Flow ($M)
$2,600
$2,400
$2,200 Average FCF as % of
$2,000 EBITDA(1): 30.8%
$1,800
$1,600
$1,400
$1,200 Average FCF as % of
$1,000 EBITDA(1): 20.4%
$800
$600
$400
$200
$0
($200)
2002 2003 2004 2005 2006 2007 2008 2009 2010 2011 2012 2013 2014 2015 2016 2017 2018 2019 2020
Durable Free Cash Flow generated throughout the cycle
(1) Free Cash Flow (FCF) and EBITDA are non-GAAP financial measures. See the Appendix for reconciliations to the most comparable GAAP measures for 2008-2020.
(2) Reflects average annual free cash flow, excluding the impact of merger and restructuring payments, relative to reported net income with 2017 net income adjusted to exclude tax reform benefits.
United Rentals, Inc., 100 First Stamford Place, Stamford, CT 06902. © 2021 United Rentals, Inc. All rights reserved.
11Driving and extending our competitive advantages
• Company transformed to be considerably
more profitable and efficient
• Operations, technology and culture
differentiate us, and make us far more agile Maximize
revenue
potential with
• Diversified end-market exposure across customers, current & new
verticals and geographies customers
• Strong balance sheet and robust cash generation with
disciplined approach to smart capital allocation provide Leverage powerful Leverage growth
powerful optionality cash flow; deliver through efficiency
industry and productivity
leading returns initiatives
• Focused on balancing growth, margins, returns and FCF
to maximize long-term value creation for our shareholders
Operating model supports self-reinforcing growth, margins, returns and cash
generation
United Rentals, Inc., 100 First Stamford Place, Stamford, CT 06902. © 2021 United Rentals, Inc. All rights reserved.
122 End-market overview United Rentals, Inc., 100 First Stamford Place, Stamford, CT 06902. © 2021 United Rentals, Inc. All rights reserved.
U.S. equipment rental industry overview
Combined U.S. General Rental and Construction & Industrial Equipment The U.S. equipment rental market has outgrown its
Rental Market Size ($bn) underlying market by over 50% in the last 20 years
$60 Indexed Growth: US Equipment Rental Market
400%
$55
23-year 10-year Peak-to- Indexed Growth: Total US Construction Spending
CAGR CAGR Peak 300%
$50 4.9% 5.2% 4.0%
200%
$45
100%
$40
0%
1997
1998
1999
2000
2001
2002
2003
2004
2005
2006
2007
2008
2009
2010
2011
2012
2013
2014
2015
2016
2017
2018
2019
2020
$35
$30
$25 Largest players capturing a growing
$20
share of the U.S. equipment rental market
Top 10 U.S. Rental Companies as % of Total Industry Revenues
$15 45%
40% 36% 36%
$10 32%
35% 30%
30% 26% 27% 27%
$5 23% 24%
25% 22%
20%
$0 20%
1997
1998
1999
2000
2001
2002
2003
2004
2005
2006
2007
2008
2009
2010
2011
2012
2013
2014
2015
2016
2017
2018
2019
2020
15%
10%
2010 2011 2012 2013 2014 2015 2016 2017 2018 2019 2020
Equipment rental value proposition continues to drive secular penetration
Sources: Company reports, ARA, RER, and U.S. Census Bureau (based on most current data available as of April 2021).
United Rentals, Inc., 100 First Stamford Place, Stamford, CT 06902. © 2021 United Rentals, Inc. All rights reserved. 14Real total U.S. construction spending per capita
Real total U.S. construction spend per capita 10-year avg 20-year avg 30-year avg 40-year avg
$6,500
$6,000
$5,500
$5,000
$4,500
$4,000
$3,500
$3,000
$2,500
1964
1965
1966
1967
1968
1969
1970
1971
1972
1973
1974
1975
1976
1977
1978
1979
1980
1981
1982
1983
1984
1985
1986
1987
1988
1989
1990
1991
1992
1993
1994
1995
1996
1997
1998
1999
2000
2001
2002
2003
2004
2005
2006
2007
2008
2009
2010
2011
2012
2013
2014
2015
2016
2017
2018
2019
2020
U.S. construction investment remains below long-term average
Sources: U.S. Census Bureau (based on most current data available as of April 2021).
United Rentals, Inc., 100 First Stamford Place, Stamford, CT 06902. © 2021 United Rentals, Inc. All rights reserved.
153 Company overview United Rentals, Inc., 100 First Stamford Place, Stamford, CT 06902. © 2021 United Rentals, Inc. All rights reserved.
Core Values Provide the Foundation of Our Culture
                                                                                                  Visible Leadership
                                                                                              Lead by example in every
                    A Passion for People                                                    business decision and action,                                                       Customer-Driven
                Build a diverse workplace that                                               with a sense of humility and                                               Support the best interests of our
                 challenges all employees to                                                        responsibility.                                                      customers and develop better
                   grow professionally and                                                                                                                              ways for them to succeed at their
                                                                                                                                                                                     jobs.
                     embrace teamwork.

               Safety First                                                                                                                                                                  Absolute Integrity
      Act, and require others to act, in                                                                                                                                                  Always do the right thing,
      a manner that puts the safety of                                                                                                                                                    honor commitments and
      our employees, customers and                                                                                                                                                      ensure appropriate corporate
             communities first.                                                                                                                                                                 governance.

                                                                                                                                                                              Community-Minded
                         Sustainability                                                                                                                                    Be an outstanding corporate
                 Engage in practices that lead to                                                                                                                         citizen and a good neighbor in
                 positive change by encouraging                                               Continuous Innovation                                                       every sense by being helpful,
                    social accountability and                                                    Contribute to a culture                                                    respectful, law-abiding and
                  environmental responsibility.                                                of innovative thinking that                                                            friendly.
                                                                                                empowers employees to
                                                                                               improve quality, efficiency
                                                                                                 and customer service.

   Building a better future is our commitment to the people and communities we serve
                                    United Rentals, Inc., 100 First Stamford Place, Stamford, CT 06902. © 2021 United Rentals, Inc. All rights reserved.
                                                                                                                                                                                                                                                                    17
                                                                                                                                                      For additional details please see our 2019 Corporate Responsibility Report that can be found at www.ur.com.
Strategic evolution over 20+ years
1997–2008 2009–2013 2014–present
Become a market leader Optimize scale, diversify, Building on and transforming
and drive profitable growth the Core
2009: Increased focus
on customer service and Continued build-up of
1997: Founded / IPO improving returns through GenRent platform
financial and operating
discipline
Increased focus on Specialty
business to increase returns
2009–2011: Introduction of and reduce volatility through
1998–2001: Becomes the
Operation United; focused cross-selling
largest equipment rental
on process improvements to
company in North America
streamline branch Development of services
through ~250 acquisitions
operations & logistics businesses and solutions to
increase customer relevance
and competitive differentiation
2002–2008: Strong organic 2012–2013: Acquisition and
growth in powerful up cycle integration of RSC Launch of digital capabilities
to better serve customers and
support internal efficiency
United Rentals, Inc., 100 First Stamford Place, Stamford, CT 06902. © 2021 United Rentals, Inc. All rights reserved.
18Long-term growth and margin opportunities
Revenue Related Cost and Margin Related
• Capitalize on ongoing secular shift • Further leveraging of LEAN
towards rental over ownership • Optimization of operating costs
• Leverage cross-selling to capture more • Continual improvement of labor productivity
wallet share and maximize cyclical growth
• Fixed cost leverage via organic and M&A growth
• Evolve sales strategies and asset base to
better serve customers and capture secular • Mix shift as Specialty outpaces total growth
opportunities (infrastructure, digital, etc.) • Product and customer mix
• Differentiate services through new • Further leveraging of technology and systems
technologies and accelerated innovation
• Smart M&A
Optimizing growth and margins to maximize long-term value creation
United Rentals, Inc., 100 First Stamford Place, Stamford, CT 06902. © 2021 United Rentals, Inc. All rights reserved. 19Competitive positioning aided by structural advantages
Size, Breadth and Benefits of Scale, Investments in
Diversity of Fleet Scope & Diversification Technology
Strong Balance Strong Culture Focused Proven
Sheet + Cash Flow on Customers & Shareholders Management Team
Focus on driving and extending our leadership position
United Rentals, Inc., 100 First Stamford Place, Stamford, CT 06902. © 2021 United Rentals, Inc. All rights reserved. 20Online digital strategy and results: 2020
Increase Demand Through Enhance the Customer
Digital Marketplace + Experience + Extend Service offerings
• Generate awareness and interest • Access real-time account and • Conduct Safety training through
equipment GPS information United Academy (UA)
• Acquire new customers
• Desktop access through Total Control® • Service owned fleet with Customer
• Capture demand through online and mobile access through the United Equipment Services (CES)
digital transactions Rentals Mobile app
Customers who represent Either UA or CES are used by
UR.com revenue increase of • over
Trackhalf
GPSoffleet
revenue engaged customers who represent
~20% YOY
digitally in Q4 2020 ~65% of revenue
United Rentals, Inc., 100 First Stamford Place, Stamford, CT 06902. © 2021 United Rentals, Inc. All rights reserved.
21Enhance Customer Experience: Digital Tools
Rental Fleet Management platform which enables:
• Open and close rental contracts
• View invoices and pay bills
Total Control® • Locate GPS enabled equipment
• Customize alerts to proactively manage utilization
• Customize reports and KPIs
On the go functionality:
• View equipment catalogue and pricing
United Rentals • View upcoming deliveries
• View current contracts, extend rentals, or call off rent
Mobile App
• Locate GPS enabled equipment and view utilization
• Easily locate branches and contact information
Digital tools provide 24x7 account access wherever customers work
United Rentals, Inc., 100 First Stamford Place, Stamford, CT 06902. © 2021 United Rentals, Inc. All rights reserved.
22Telematics & FAST
Field Automation
Telematics & Related Technologies
Systems & Technologies (FAST)
Internal Benefits: Internal Benefits:
– Performance monitoring and service alerts – Increased driver and dispatcher productivity
– More efficient location and pick-up capabilities – Improved fleet efficiency
– Overtime and revenue recovery – Reduced fuel consumption
– Safety benefits
Customer Benefits:
– Environmental benefits
– Visibility into equipment utilization
– Ability to more easily locate equipment
– Billing and account access
– Fuel alerts
Using technology to drive greater efficiencies and improve customer experience
United Rentals, Inc., 100 First Stamford Place, Stamford, CT 06902. © 2021 United Rentals, Inc. All rights reserved.
23Investing in Specialty solutions to complement GenRent
Trench Safety Power & HVAC Fluid Solutions Tool Solutions Onsite Services Portable Storage &
Modular Space
• Excavation • Complete • Full range of • Tool trailers • Plastic port-a- • Portable storage,
support solutions for equipment to stocked with potties, luxury mobile offices,
solutions, confined mobile power and contain, transfer, hoisting, restroom trailers, and modular
space entry air flow and treat fluids torqueing, pipe sinks, and showers space solutions
equipment and fitting, and air
• Used for disaster • Used by tools • Core rental item • Core rental item
customer training municipalities, used across all used across all
response,
• Used for plant shut downs, industrial plants, and • Used during types of special types of industrial
construction, commercial mining, refinery and other events, and construction
utility installs, renovations, and construction, industrial construction sites, sites, commercial
manhole work, and seasonal municipal and agri- shutdowns, and and industrial applications, and
other underground climate control business customers also at large projects many other end
applications construction sites markets
Aggressive growth in Specialty competitively differentiates our product and solution
offering to customers, improves full-cycle returns, and helps reduce business volatility
United Rentals, Inc., 100 First Stamford Place, Stamford, CT 06902. © 2021 United Rentals, Inc. All rights reserved.(1)
Specialty provides strong growth opportunities
millions
$2,500
2012-2020 CAGR: 27.6% $2,168
$2,090
$2,000
$1,719
$1,500
$1,254
$1,021
$1,000 $931
$823
$471
$500
$297
$0
2012 2013 2014 2015 2016 2017 2018 2019 2020
Specialty
as % of 7.2% 9.5% 14.5% 16.0% 17.7% 18.9% 21.4% 23.2% 24.5%
Total Rev:
Specialty represented 24.5% of total revenue in 2020 at almost $2.1 billion
(1) Tool Solutions was added in 2013 and Fluid Solutions was added in April 2014.
Note: Data includes 1) Specialty reporting segment (comprised of our Fluid Solutions, Fluid Solutions Europe, Trench Safety and Power & HVAC regions) and 2) Reliable Onsite Services and Tools revenues, which are included in our General Rentals reporting segment.
United Rentals, Inc., 100 First Stamford Place, Stamford, CT 06902. © 2021 United Rentals, Inc. All rights reserved.
25Long-term capital allocation strategy
Manage Return Excess
Leverage Invest in Growth Cash to
Investors
• Target leverage range over • $500 million repurchase program
the cycle of 2.0x–3.0x. Organic M&A commenced in the first quarter of
• Net leverage(1,2): 2.5x 2020. $257 million purchased
• Continued organic • Balance sheet strategy
through June 30, 2021. The
• Total liquidity(2): $2.826 billion investments to support creates flexibility to
growth and boost pursue strategic assets program was paused in March
• Next long-term note maturity: productivity. as opportunities arise. 2020 due to COVID-19. While
2026 the company is currently unable
• Opened 15 specialty • Specialty: National to estimate if, or when, the
• Credit ratings(3): branches in 2020. Pump, BakerCorp, and program will be restarted, it may
• S&P: BB+/Stable Targeting 30 legacy General Finance to
URI branch openings augment Specialty. restart the program at any time.
• Moody’s: Ba1/Stable in 2021, consistent • Since 2012, United Rentals has
with 2018 and 2019 • GenRent: NES, Neff,
and BlueLine to returned $4.0 billion to
levels.
support “grow the core” shareholders, representing 37%
strategy. of total issued shares.
Disciplined, prudent, efficient, and opportunistic approach to capital allocation
(1) Leverage ratio calculated as net debt, divided by LTM adjusted EBITDA. Net debt calculated as the balance sheet value of debt less cash and cash equivalents.
(2) As of June 30, 2021.
(3) As of July 26, 2021.
United Rentals, Inc., 100 First Stamford Place, Stamford, CT 06902. © 2021 United Rentals, Inc. All rights reserved.
26M&A strategy: Disciplined and opportunistic
Strategic Financial Cultural
• Proactively supports growth in • Invest capital at attractive returns • Safety
attractive markets over cycle
• Talent
• Difficult to replicate organically • Revenue growth
• Margin opportunities • Ethics and integrity
• Access to new customers
• Manage leverage • Management philosophy
• Enhance cross-selling
• Internal Rate of Return • Customer focus
• Best practice adoption
• ROIC
• Geographic coverage • Community
• Volatility
• Diversification
Proven integration capabilities are a key advantage in realizing greater value from M&A
United Rentals, Inc., 100 First Stamford Place, Stamford, CT 06902. © 2021 United Rentals, Inc. All rights reserved.
27Record of value creation through M&A
RSC National Pump NES Neff Rentals BakerCorp BlueLine General Finance
(2012) (2014) (2017) (2017) (2018) (2018) (2021)
• Size: $4.2B • Size: $780M • Size: $965M • Size: $1.3B • Size: $720M • Size: $2.1B • Size: $1.0B
transaction value transaction value transaction value transaction value transaction value transaction value transaction value
(cash and stock) (cash) (cash) (cash) (cash) (cash) (cash)
• Type: ‘Grow-the- • Type: Specialty • Type: ‘Grow-the- • Type: ‘Grow-the- • Type: Specialty • Type: ‘Grow-the- • Type: Specialty
core’ gen rent adjacency in the core’ gen rent core’ gen rent adjacency in the core’ gen rent adjacency in the
acquisition pump rental sector acquisition acquisition fluid control sector acquisition mobile storage and
portable office sector
• Rationale: Positions • Rationale: Expand • Rationale: • Rationale: • Rationale: Expand • Rationale: Bolstered
URI as leader in offerings in higher Strengthened aerial Introduced new dirt offerings in higher URI’s position as a • Rationale:
North American margin / return capabilities and capabilities and return and lower leader in the North Expanded product
rental industry assets added two-way expertise in volatility assets American rental and solution offering
cross-selling infrastructure; industry while also via higher return and
• Value: Targeted • Value: Delivered on • Value: Targeted
opportunities provided two-way adding to presence lower volatility assets
$200M cost savings growth thesis by $19M cost savings
cross-selling with local and mid- while further
from branch capitalizing on • Value: Targeted and $60M of cross-
opportunities sized customer differentiating URI’s
consolidation and cross-selling $40M cost savings sell revenue
segment ability to provide
overhead opportunity and $35M of revenue • Value: Targeted opportunity
one-stop shopping
rationalization • Secured foothold cross-sell opportunity $35M cost savings • Value: Targeted
• Exceeded initial in energy-related and $15M of revenue $45M cost savings • Value: Targeted
cost savings end markets cross-sell opportunity and $35M of cross- $17M cost savings
estimates - sell revenue and $65M of revenue
• Strongly opportunity synergies
Raised target to diversified into
$230M - $250M core construction
and industrial
markets
With 20+ years of execution experience for ~300 transactions, team has successfully integrated
assets in different environments and across the spectrum from bolt-ons to transformational
United Rentals, Inc., 100 First Stamford Place, Stamford, CT 06902. © 2021 United Rentals, Inc. All rights reserved.
28ESG Highlights: Environmental
Our Impacts Along the Value Chain Energy Intensity (MWh/$M revenue)
200 194.4
177.5
180 173.1
External impacts
162.3
160
Internal impacts
140
120
100
2016 2017 2018 2019
GHG Intensity (MT CO2e/$M revenue)
60
50.6 51.0
47.4
50 42.4
40
30
Integration of LEAN practices to support Continuous Improvement across operations 20
Energy: Energy management across entire branch network 10
Emissions: Emissions management within both rental fleet and delivery trucks 0
2016 2017 2018 2019
Transportation: New and efficient trucks, route and load optimization, telematics, etc.
Technology: Customer-facing consumption management tools (i.e., Total Control) 2030 Target: 30.8 MT CO2e/ $M revenue (based on a 35% reduction from 2018-base level)
Helping build a better future for all stakeholders including the environment
For additional details please see our 2019 Corporate Responsibility Report that can be found at www.ur.com. 2020 information will be provided upon the release of our 2020 corporate responsibility report.
United Rentals, Inc., 100 First Stamford Place, Stamford, CT 06902. © 2021 United Rentals, Inc. All rights reserved.
29ESG Highlights: Social & Employee Related
TRIR Rate (Safety Measurement)
2019 Selected Highlights 1.00 0.83 0.77 0.79 0.78
62% increase in diverse supplier spending to 9% of overall spend in North America 0.80
0.60
137% increase in spending with minority-owned enterprises 0.40
0.20
Adopted a Human Rights Policy and Statement on Modern Slavery and Human Trafficking 0.00
2016 2017 2018 2019
Internal 1UR peer recognition program celebrated 16,000+ points of exceptional service
Diverse employees in sales and management positions as % of total
#1 provider of confined space training in the world with a focus on safety 29.1%
30%
91% of branches were injury-free 28% 26.5% 26.8%
26% 25.3%
0.78 Total Recordable Incident Rate (TRIR)
24%
Almost 717,000 hours of employee training 22%
2016 2017 2018 2019
Almost $740,000 distributed to employees through the United Compassion Fund
Total purchasing spend with diverse suppliers ($M) As % of Total
Approximately 1,800 veterans employed or ~10% of total employee base $1,000 10.0%
7.5%
Awarded the large employer Platinum Award by the HIRE Vets Award Program $500
5.0%
Awarded the Diversity and Inclusion Excellence Award and ABC National Diversity Excellence $0 2.5%
Award by Associated Builders and Contractors of America 2016 2017 2018 2019
Making a difference for our employees, their families, and our communities
For additional details please see our 2019 Corporate Responsibility Report that can be found at www.ur.com. 2020 information will be provided upon the release of our 2020 corporate responsibility report.
United Rentals, Inc., 100 First Stamford Place, Stamford, CT 06902. © 2021 United Rentals, Inc. All rights reserved.
30ESG Highlights: Corporate Governance
Corporate Governance Highlights Board of Directors Overview
Board Independence Board Performance The strength of our Board is highlighted by our directors' collective skills and expertise, as illustrated
• Nine of 11 Directors are independent • Risk oversight by the following list of aggregate prioritized director competencies:
• Lead Independent Director • Robust board evaluations
Key Characteristic / Experience/ Skill Set Number of Directors Possessing each Competency
• Required committees are fully independent • Commitment to board refreshment
and succession planning
Public Company CEO 3
• Management succession planning
P&L Owner 8
Other Board & Board Committee Practices Shareholder Rights Financial Acumen & Capital Markets Experience 6
• Separate Chair and CEO • Proxy access
• Annual election of Directors • Shareholder rights to call special meetings Digital 3
• No hedging or pledging of company shares • Shareholder right to act by written consent
• Robust stock ownership guidelines • No poison pill Sales & Marketing 6
• Authority to retain outside advisors • Simple majority voting requirements
• Director retirement age policy • Annual election of all Directors Product Development & Distribution 8
• Diverse in gender, ethnicity, experience • Majority voting for Director elections
and perspectives Rental Industry 4
Capital Intensive Industry 9
Executive Compensation Overview
Annual Incentive Compensation Plan (AICP)
International Experience 7
Metric: Adjusted EBITDA
Weighting: 50% of AICP
Metric Focus: Profitability
Metric: Economic Profit Improvement (EPI)
Weighting: 50% of AICP The strength of our Board is further illustrated by the diversity and other characteristics of our directors:
Metric Focus: Returns
Individual - Human Capital (safety, diversity, employee
Discretionary experience and retention)
Adjustment of 90- - Customer Experience
110% of Funding
- Digital & Technology
Based on Strategic
Factors Linked to: - Individual goals (specified)
Long-Term Incentive Plan (LTIP)
Metric: Total Revenue
Weighting: 50% of LTIP
Metric Focus: Growth
Metric: Return on Invested Capital (ROIC)
Weighting: 50% of LTIP
Metric Focus: Returns
Policies ensure alignment of interests between management and investors
For additional details please see our 2021 Proxy Statement that can be found at www.ur.com.
United Rentals, Inc., 100 First Stamford Place, Stamford, CT 06902. © 2021 United Rentals, Inc. All rights reserved.
314 Summary of key
financial data
United Rentals, Inc., 100 First Stamford Place, Stamford, CT 06902. © 2021 United Rentals, Inc. All rights reserved.Key financial results snapshot
Adjusted Earnings per Share
Total Revenue ($M) Adjusted EBITDA(1) ($M)
(EPS)(1,2,3)
2020 5-Year CAGR: 2021 Implied Growth: 2020 5-Year CAGR: 2021 Implied Growth:
2020 5-Year CAGR: +16.8%
+8.0% +12.5% +6.8% +9.4%
$10,000
$5,000 $20
$9,000 $4,500
$8,000 $4,000
$15
$7,000 $3,500
$6,000 $3,000
$5,000 $2,500 $10
$4,000 $2,000
$3,000 $1,500
$5
$2,000 $1,000
$1,000 $500
$0 $0 (3) $0
(3) 2015 2016 2017 2018 2019 2020 2021F 2015 2016 2017 2018 2019 2020
2015 2016 2017 2018 2019 2020 2021F
Notes:
(1) Adjusted EBITDA and Adjusted EPS are non-GAAP measures. See the tables provided elsewhere in this presentation for reconciliations to the most comparable GAAP measures.
(2) 2017 Adjusted EPS excludes a one-time benefit from the Tax Act of $8.05. 2018, 2019 and 2020 reflect a reduction in the U.S. federal corporate statutory rate from 35% to 21% as a result of the Tax Act.
(3) 2021F reflects the mid-point of guidance. Adjusted EPS is not forecasted.
United Rentals, Inc., 100 First Stamford Place, Stamford, CT 06902. © 2021 United Rentals, Inc. All rights reserved.
33Structural changes are key to increased margins
Adjusted EBITDA Margin(1) (%)
Key Drivers of Margin Gains
Adjusted EBITDA margin
1,200 bps above prior peak (3)
• Strong fixed-cost absorption
60%
• Cyclical leverage (e.g., SG&A as % of sales)
50% • M&A cost synergies (e.g., RSC, NES, Neff)
40% • Operational efficiency gains
• Process improvements (e.g., LEAN, 5S, etc.)
30%
• Technology (e.g., logistics, CORE, telematics)
20%
• Improved mix
10% • Shift towards higher margin Specialty
0%
• Improved segment/end-market mix
(2)
2008 2009 2010 2011 2012 2013 2014 2015 2016 2017 2018 2019 2020 2021F • De-emphasis of low margin/return businesses
• Improved used equipment sales strategies
Dramatic cycle-over-cycle margin improvement
Notes:
(1) Adjusted EBITDA is a non-GAAP measure. Adjusted EBITDA margin represents adjusted EBITDA divided by total revenue. See the tables provided elsewhere in this presentation for reconciliations to the most comparable GAAP measures.
(2) 2021F reflects the mid-point of guidance.
(3) Reflects change between 2008 and 2021F.
United Rentals, Inc., 100 First Stamford Place, Stamford, CT 06902. © 2021 United Rentals, Inc. All rights reserved.
34Consistent free cash flow generation
$2,500 $2,454
$2,100
$1,700
$1,700 $1,592
$1,334
$1,300 $1,195
$924 $983
$900
$574
$500 $421
$335 $367
$227
$100 $23
($73)
-$300
(3)
2008 2009 2010 2011 2012 2013 2014 2015 2016 2017 2018 2019 2020 2021F
~$7.6B of free cash flow generated over last 5 years(2)
Notes:
(1) Free cash flow is a non-GAAP measure. See tables provided elsewhere in this presentation for reconciliations to the most comparable GAAP measure. Merger and restructuring related payments were first reported for 2012. The information required to
determine the amount of merger and restructuring related payments for periods prior to 2012 is unavailable without unreasonable effort. Free cash flow for 2012 and subsequent periods above excludes merger and restructuring related payments.
(2) Reflects 5 year period from 2016 to 2020, excluding merger and restructuring related payments.
(3) 2021F reflects the mid-point of guidance.
United Rentals, Inc., 100 First Stamford Place, Stamford, CT 06902. © 2021 United Rentals, Inc. All rights reserved.
352Q 2021 Results
Total Revenue • $2.287 billion (17.9% Y/Y)
Net Income • $293 million (12.8% margin; +190 bps Y/Y)
Adjusted EBITDA* • $999 million (43.7% margin; -270 bps Y/Y)
• $747 million, after gross purchases of $1.208
Net Rental Capital Expenditures (Year-to-Date)
billion
Net Cash Provided by Operating Activities
• $1.934 billion
(Year-to-Date)
Free Cash Flow* (Year-to-Date) • $1.171 billion**
* Adjusted EBITDA and Free Cash Flow are non-GAAP measures. See the tables provided elsewhere in this presentation for reconciliations to the most comparable GAAP measures.
** Excludes aggregate merger and restructuring related payments of $9 million.
United Rentals, Inc., 100 First Stamford Place, Stamford, CT 06902. © 2021 United Rentals, Inc. All rights reserved.
362021 Financial Outlook
Total Revenue • $9.45 billion to $9.75 billion
Adjusted EBITDA* • $4.225 billion to $4.375 billion
• $1.5 billion to $1.7 billion, after gross purchases
Net Rental Capital Expenditures
of $2.5 billion to $2.7 billion
Net Cash Provided by Operating Activities • $3.25 billion to $3.65 billion
Free Cash Flow* • $1.6 billion to $1.8 billion**
*Adjusted EBITDA and Free Cash Flow are non-GAAP measures. See the table provided elsewhere in this presentation for a reconciliation of forecasted Free Cash Flow to the most comparable GAAP measure. Information reconciling forecasted
adjusted EBITDA to the most comparable GAAP financial measures is unavailable to the company without unreasonable effort, as discussed in the “Introductory Information” slide.
**Excludes aggregate merger and restructuring related payments. FCF outlook assumptions include 2021 cash taxes of $250M and cash interest of $390M.
United Rentals, Inc., 100 First Stamford Place, Stamford, CT 06902. © 2021 United Rentals, Inc. All rights reserved.
37Fleet productivity: overview
• Fleet Productivity provides greater insight into the interplay and combined impact of key decisions made by
managers every day across (a) rental rates, (b) time utilization, and (c) changes in mix on our Owned
Equipment Rental Revenue (i.e., the revenue we generate with our owned rental assets).
• Mix includes impact of changes in customer mix, fleet mix, geographic mix and business mix (i.e., Specialty).
Fleet Productivity is a metric that better explains how the combined changes in rental rates, time utilization,
and mix come together to produce revenue and how management flexes the combination of these factors to
drive efficient growth and benefits returns.
• Fleet Productivity is a comprehensive measure that combines the impact of the change in rental rates plus
the impact of changes in time utilization plus the revenue impact from changes in mix in one metric.
Fleet Productivity provides better insight into the decisions made to
optimize growth and returns
United Rentals, Inc., 100 First Stamford Place, Stamford, CT 06902. © 2021 United Rentals, Inc. All rights reserved.
38Fleet productivity: historical results (1)
As Reported Historical Results
Actual YoY Change in Assumed YoY Impact of OEC Fleet Contribution from Reported YoY Change
Average OEC Inflation on Rent Rev Productivity(2) Ancillary and Re-Rent in Rental Revenue
1Q 2017 3.9% (1.5%) 1.4% 0.6% 4.4%
2Q 2017(3) 14.3% (1.5%) 0.7% * (NES) ** 0.1% 13.5%
3Q 2017 15.7% (1.5%) 1.7% 0.3% 16.2%
4Q 2017(3) 27.5% (1.5%) 0.5% * (Neff) 0.3% 26.8%
1Q 2018 27.7% (1.5%) (0.8%) (0.3%) 25.1%
2Q 2018 16.2% (1.5%) 4.5% 0.1% 19.3%
3Q 2018(3) 19.5% (1.5%) 2.3% * *(NES)
(BakerCorp) 0.8% 21.2%
4Q 2018(3)
* 18.8% (1.5%) 1.5% * (BlueLine) 2.0% 20.8%
1Q 2019 23.7% (1.5%) (1.3%)* (Neff) 2.1% 23.0%
*
2Q 2019 23.2% (1.5%) (3.1%) 1.6% 20.2%
3Q 2019 18.1% (1.5%) (1.3%) 0.1% 15.4%
* (BakerCorp)
4Q 2019 * 7.6% (1.5%) (2.4%)
* (BlueLine)
0.0% 3.7%
1Q 2020 * 2.2% (1.5%) (1.2%) (0.2%) (0.7%)
2Q 2020 (0.7%) (1.5%) (13.6%)(4) (0.4%) (16.2%)
3Q 2020 (4.6%) (1.5%) (8.0%)(4) 0.8% (13.3%)
4Q 2020 (5.6%) (1.5%) (3.8%)(4) 0.8% (10.1%)
Q1 2021 (5.7%) (1.5%) (0.5%)(4) 1.2% (6.5%)
Q2 2021(3) 0.2% (1.5%) 17.8% * (General Finance) 2.3% 18.8%
(1) Provided on an As Reported basis. (3) Denotes quarter in which URI closed a material acquisition (NES = 2Q17; Neff = 4Q17; BakerCorp = 3Q18; BlueLine = 4Q18;
(2) Fleet Productivity reflects the combined impact of changes in rental rates, time utilization, and mix that contribute to Owned General Finance = 2Q21).
Equipment Rental revenue (OER). (4) The negative fleet productivity above includes the impact of COVID-19.
United Rentals, Inc., 100 First Stamford Place, Stamford, CT 06902. © 2021 United Rentals, Inc. All rights reserved.
39Balance sheet strength has improved
Leverage Ratio(1)
(2)
3.6x
3.0x 3.0x (4)
2.9x 2.8x 2.9x (3)
2.7x
2.6x
2.4x 2.5x(5)
2012 2013 2014 2015 2016 2017 2018 2019 2020 2Q 2021
2.0x – 3.0x targeted leverage range across the cycle
(1) Leverage Ratio calculated as net debt divided by LTM adjusted EBITDA.
(2) Pro Forma assumes RSC acquisition occurred on January 1, 2012.
(3) Reflects leverage as reported, which includes borrowings related to the acquisitions of both NES and Neff without full-year benefits of EBITDA contribution.
(4) Reflects leverage as reported, which includes borrowings related to the acquisitions of both Baker and BlueLine without full-year benefits of EBITDA contribution.
(5) Reflects leverage as reported, which includes borrowings related to the acquisition of General Finance without full-year benefits of EBITDA contribution.
United Rentals, Inc., 100 First Stamford Place, Stamford, CT 06902. © 2021 United Rentals, Inc. All rights reserved.
40No long-term note maturities until 2026
Millions Total Liquidity of $2.826B(1)
$5,000
$4,500 Fixed vs. Floating Ratio: 70%/30%
$4,000
$3,750
$3,500
$3,000
$2,384
$2,500 Unused ABL
Facility
$2,000 $1,750 $1,673 $1,500
$750
$1,500 3.875%
$750
$900 $973 $1,000
Secured
Notes 4.00% $1,100
4.875%
$1,000 Senior
Senior Unsecured
Notes
$106 Unused A/R Facility $1,366 $1,000 $1,000 3.875%
$973 5.875% Unsecured Senior
Used ABL(2) 5.5% $750
$500 Term Senior Notes(3) 5.25% Unsecured
$794 Senior
Loan B Unsecured Unsecured Senior Unsecured Notes
Used A/R Facility
Notes Notes Notes
$0
2021 2022 2023 2024 2025 2026 2027 2028 2029 2030 2031
Aggressive management of long-term maturity towers
Note: As of June 30, 2021.
(1) Includes total cash, cash equivalents and availability under ABL and A/R facilities as of June 30, 2021.
(2) Includes $64M in Letters of Credit.
(3) Comprised of two separate 4.875% notes, a note with $1.669B principal amount and a note with $4M principal amount .
United Rentals, Inc., 100 First Stamford Place, Stamford, CT 06902. © 2021 United Rentals, Inc. All rights reserved.
415 Appendix United Rentals, Inc., 100 First Stamford Place, Stamford, CT 06902. © 2021 United Rentals, Inc. All rights reserved.
Adjusted Earnings Per Share GAAP Reconciliation
We define “earnings per share – adjusted” as the sum of earnings per share – GAAP, as-reported plus the impact of the following special items: merger related costs, merger related intangible asset amortization, impact on depreciation
related to acquired fleet and property and equipment, impact of the fair value mark-up of acquired fleet, restructuring charge and asset impairment charge. Management believes that earnings per share - adjusted provides useful information
concerning future profitability. However, earnings per share - adjusted is not a measure of financial performance under GAAP. Accordingly, earnings per share - adjusted should not be considered an alternative to GAAP earnings per share.
The table below provides a reconciliation between earnings per share – GAAP, as-reported, and earnings per share – adjusted.
                                                                                                                                                                       Three Months Ended                Six Months Ended
                                                                                                                                                                                June 30,                     June 30,
                                       $ Millions
                                                                                                                                                                          2021              2020         2021          2020
                                       Earnings per share - GAAP, as-reported
                                                                                                                                                                      $        4.02     $   2.93     $    6.82     $    5.25
                                       After-tax impact of:
                                       Merger related costs (2)
                                                                                                                                                                               0.03           —           0.03           —
                                       Merger related intangible asset amortization (3)
                                                                                                                                                                               0.48         0.59          0.97          1.15
                                       Impact on depreciation related to acquired fleet and property and equipment (4)
                                                                                                                                                                               0.01         0.02          0.03          0.06
                                       Impact of the fair value mark-up of acquired fleet (5)
                                                                                                                                                                               0.08         0.10          0.20          0.23
                                       Restructuring charge (6)
                                                                                                                                                                                —           0.04          0.01          0.06
                                       Asset impairment charge (7)
                                                                                                                                                                               0.04           —           0.04          0.27
                                       Earnings per share - adjusted
                                                                                                                                                                      $        4.66     $   3.68     $    8.10     $    7.02
                                       Tax rate applied to above adjustments (1)
                                                                                                                                                                               25.4 %       25.2 %        25.3 %        25.2 %
                                     (1)     The tax rates applied to the adjustments reflect the statutory rates in the applicable entities.
                                     (2)     Reflects transaction costs associated with the General Finance acquisition that was completed in May 2021. Merger related costs only include costs
                                             associated with major acquisitions completed since 2012 that significantly impact our operations (the "major acquisitions," each of which had annual
                                             revenues of over $200 million prior to acquisition).
                                     (3)     Reflects the amortization of the intangible assets acquired in the major acquisitions.
                                     (4)     Reflects the impact of extending the useful lives of equipment acquired in certain major acquisitions, net of the impact of additional depreciation
                                             associated with the fair value mark-up of such equipment.
                                     (5)     Reflects additional costs recorded in cost of rental equipment sales associated with the fair value mark-up of rental equipment acquired in certain major
                                             acquisitions and subsequently sold.
                                     (6)     Primarily reflects severance and branch closure charges associated with our closed restructuring programs and our current restructuring program. We
                                             only include such costs that are part of a restructuring program as restructuring charges. Since the first such restructuring program was initiated in 2008,
                                             we have completed five restructuring programs. We have cumulatively incurred total restructuring charges of $351 million under our restructuring
                                             programs.
                                     (7)     Reflects write-offs of leasehold improvements and other fixed assets. The 2020 charges primarily reflect the discontinuation of certain equipment
                                             programs, and were not related to COVID-19.

                                                        United Rentals, Inc., 100 First Stamford Place, Stamford, CT 06902. © 2021 United Rentals, Inc. All rights reserved.
                                                                                                                                                                                                                                          43
EBITDA and Adjusted EBITDA GAAP Reconciliations
EBITDA represents the sum of net income, provision for income taxes, interest expense, net, depreciation of rental equipment, and non-rental depreciation and amortization. Adjusted EBITDA represents EBITDA plus the sum of the merger
related costs, restructuring charge, stock compensation expense, net, and the impact of the fair value mark-up of acquired fleet. These items are excluded from adjusted EBITDA internally when evaluating our operating performance and for
strategic planning and forecasting purposes, and allow investors to make a more meaningful comparison between our core business operating results over different periods of time, as well as with those of other similar companies. The net
income and adjusted EBITDA margins represent net income or adjusted EBITDA divided by total revenue. Management believes that EBITDA and adjusted EBITDA, when viewed with the company’s results under GAAP and the
accompanying reconciliation, provide useful information about operating performance and period-over-period growth, and provide additional information that is useful for evaluating the operating performance of our core business without
regard to potential distortions. Additionally, management believes that EBITDA and adjusted EBITDA help investors gain an understanding of the factors and trends affecting our ongoing cash earnings, from which capital investments are
made and debt is serviced.
The table below provides a reconciliation between net income and EBITDA and adjusted EBITDA. Three Months Ended Six Months Ended
June 30, June 30,
$ Millions 2021 2020 2021 2020
Net income
$ 293 $ 212 $ 496 $ 385
Provision for income taxes
84 39 156 92
Interest expense, net
100 130 199 266
Depreciation of rental equipment
385 395 760 821
Non-rental depreciation and amortization
90 95 181 195
EBITDA
$ 952 $ 871 $ 1,792 $ 1,759
Merger related costs (1)
3 — 3 —
Restructuring charge (2)
— 3 1 5
Stock compensation expense, net (3)
35 15 56 28
Impact of the fair value mark-up of acquired fleet (4)
9 10 20 22
Adjusted EBITDA
$ 999 $ 899 $ 1,872 $ 1,814
Net income margin
12.8 % 10.9 % 11.4 % 9.5 %
Adjusted EBITDA margin
43.7 % 46.4 % 43.1 % 44.6 %
(1) Reflects transaction costs associated with the General Finance acquisition that was completed in May 2021. Merger related costs only include costs
associated with major acquisitions.
(2) Primarily reflects severance and branch closure charges associated with our closed restructuring programs and our current restructuring program. We
only include such costs that are part of a restructuring program as restructuring charges. Since the first such restructuring program was initiated in
2008, we have completed five restructuring programs. We have cumulatively incurred total restructuring charges of $351 million under our
restructuring programs.
(3) Represents non-cash, share-based payments associated with the granting of equity instruments.
(4) Reflects additional costs recorded in cost of rental equipment sales associated with the fair value mark-up of rental equipment acquired in certain
major acquisitions and subsequently sold.
United Rentals, Inc., 100 First Stamford Place, Stamford, CT 06902. © 2021 United Rentals, Inc. All rights reserved.
44You can also read


