Quality-based Pulse Estimation from NIR Face Video with Application to Driver Monitoring
←
→
Page content transcription
If your browser does not render page correctly, please read the page content below
Quality-based Pulse Estimation from NIR Face
                                           Video with Application to Driver Monitoring

                                             Javier Hernandez-Ortega1[0000−0001−6974−3900] , Shigenori Nagae2 , Julian
                                             Fierrez1[0000−0002−6343−5656] , and Aythami Morales1[0000−0002−7268−4785]
arXiv:1905.06568v2 [cs.CV] 20 May 2019

                                                         1
                                                           Universidad Autonoma de Madrid, Madrid, Spain
                                                   {javier.hernandezo,julian.fierrez,aythami.morales}@uam.es
                                                 2
                                                    OMRON Corporation, Kyoto, Japan shigenori.nagae@omron.com

                                               Abstract. In this paper we develop a robust for heart rate (HR) esti-
                                               mation method using face video for challenging scenarios with high vari-
                                               ability sources such as head movement, illumination changes, vibration,
                                               blur, etc. Our method employs a quality measure Q to extract a remote
                                               Plethysmography (rPPG) signal as clean as possible from a specific face
                                               video segment. Our main motivation is developing robust technology for
                                               driver monitoring. Therefore, for our experiments we use a self-collected
                                               dataset consisting of Near Infrared (NIR) videos acquired with a camera
                                               mounted in the dashboard of a real moving car. We compare the per-
                                               formance of a classic rPPG algorithm, and the performance of the same
                                               method, but using Q for selecting which video segments present a lower
                                               amount of variability. Our results show that using the video segments
                                               with the highest quality in a realistic driving setup improves the HR
                                               estimation with a relative accuracy improvement larger than 20%.

                                               Keywords: Remote Plethysmography · Driver Monitoring · Heart Rate
                                               · Quality Assessment · Face Biometrics · NIR Video

                                         1    Introduction

                                         Traffic accidents have become one of the main non-natural causes of death in
                                         today’s society. The World Health Organization (WHO) published a report in
                                         2018 [18] declaring that 1.35 millions of people die annually all over the world
                                         due to traffic accidents, even becoming the main cause of death among young
                                         population (those under 30 years old).
                                            Some types of traffic accidents can not be predicted by any manner because
                                         they occur due to external factors such as bad weather, roads in poor condition,
                                         mechanical issues, etc. However, there is still a high amount of accidents caused
                                         by human factors that can be avoided [14]. For example, fatigue is one of the
                                         most common causes of accidents, and it is also one of the most preventable.
                                         Drivers experiencing fatigue have a decrease in their visual perception, reflexes,
                                         and psychomotor skills, and they may even fall asleep while driving.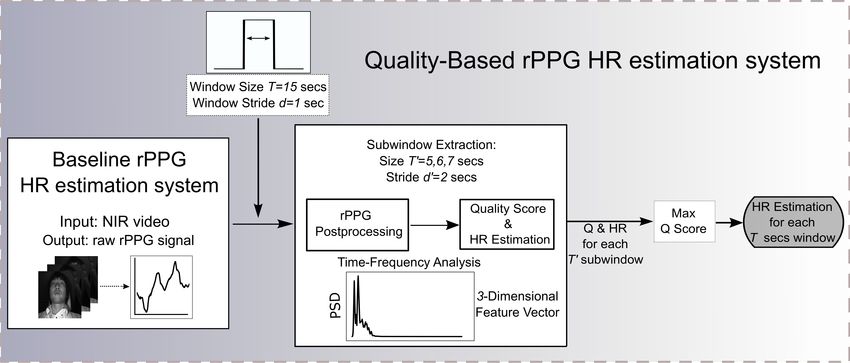
2      J. Hernandez-Ortega et al.

     In order to reduce the number of accidents, driver monitoring has attracted a
lot of research attention in the recent years [12,7,3]. A driver monitoring system
must be able to detect the presence of signals related to fatigue, allowing to
take preventive actions to avoid a possible accident. Some of these actions are
recommending the driver to stop in a rest area until he is fully recovered, and
displaying acoustic and luminous warnings inside the car to keep the driver
awake until he can stop.
     Driver monitoring systems may follow different ways for achieving their tar-
get. Some of them use information about the way the driver is conducting the
car, i.e. movements of the steering wheel, status of the pedals, etc [11]. Physio-
logical signals such as the heart rate (HR), the blood pressure, the brain activity,
etc, can also be used to detect fatigue in the driver [10].
     A monitoring system capable of estimating physiological components such
as the heart rate, or the blood pressure, may present additional benefits. These
systems could be able not only to detect signs of fatigue, but also changes in
the driver’s general health condition. This kind of monitoring systems allow to
acquire and process health information daily and non-intrusively. The captured
data can be used to help doctors to make better diagnostics, or even for recom-
mending the driver to visit a practitioner if a potential health issue is detected.
     The accurate extraction of physiological signals in a real driving scenario is
still a challenge. There exist different approaches depending of the acquisition
method, i.e. contact-based and image-based, each one with its own strengths and
weaknesses. In this paper we focus in improving the performance of an image-
based method by introducing a quality assessment algorithm [2]. The target of
this algorithm is selecting the video sequences more favorable to a specific heart
rate estimation method, in a kind of quality-based processing [6].
     The rest of this paper is organized as follows: Section 2 introduces driver
monitoring techniques, with focus in remote photoplethysmography and its chal-
lenges. Section 3 describes the proposed system. Section 4 summarizes the dataset
used. Section 5 describes the evaluation protocol and the results obtained. Fi-
nally, the concluding remarks and the future work are drawn in Section 6.

2   Driver Monitoring Techniques

Early research in driver monitoring was mostly based on acquiring accurate
physiological signals from the drivers using contact sensors (e.g. ECG, EEG, or
EMG), but this approach may result uncomfortable and impractical in a realistic
driving environment. Some parameters that can be obtained this way are the
heart rate, respiration, brain activity, muscle activation, corporal temperature,
etc. Some works related to this approach are [10] and [16].
    Contactless approaches are more convenient for its use in real driver monitor-
ing without bothering the driver with cables and other uncomfortable devices.
Regarding this approximation, computer vision techniques result really practi-
cal since they use images acquired non-invasively from a camera mounted inside
the vehicle. These images can be processed to analyze physiological parameters
Quality-based rPPG HR Estimation for Driver Monitoring 3
Table 1. Selection of works related to pulse extraction and/or driver monitoring
using contact sensors or images.
Method Type of Data Parameters Extracted Performance Target
Brandt et al. 2004 [4] RGB and NIR Video Head Motion and Eye Blinking N/A Driver Fatigue
Shin et al. 2010 [16] ECG Heart Rate N/A Driver Fatigue
Jo et al. 2011 [9] NIR Video Head Pose and Eye Blinking Accuracy = 98.55% Driver Drowsiness and Distraction
Poh et al. 2011 [15] RGB Video Heart and Breath Rate, HR Variab. RMSE = 5.63% Physiological Measurement
Jung et al. 2014 [10] ECG Heart Rate N/A Driver Drowsiness
Tasli et al. 2014 [17] RGB Video Heart Rate, HR Variab. MAE = 4.2% Physiological Measurement
McDuff et al. 2014 [13] RGB-CO Video Heart and Breath Rate, HR Variab. Correlation = 1.0 Physiological Measurement
Chen et al. 2016 [5] RGB and NIR Video Heart Rate RMSE = 1.65% Physiological Measurement
Present Work NIR Video Heart Rate MAE = 8.76% Driver Monitoring
using remote photoplethysmography (rPPG). With this technique it is possi-
ble to estimate the heart rate, the oxygen saturation, and other pulse related
information using only video sequences [15].
2.1 Remote Photoplethysmography
Photoplethysmography (PPG) [1] is a low-cost technique for measuring the car-
diovascular Blood Volume Pulse (BVP) through changes in the amount of light
reflected or absorbed by human vessels. PPG is often used at hospitals to mea-
sure physiological parameters like the heart rate, the blood pressure, or the
oxygen saturation. PPG signals are usually be measured with contact sensors
often placed at the fingertips, the chest, or the feet. This type of contact mea-
surement may be suitable for a clinic environment, but it can be uncomfortable
and inconvenient for daily driver monitoring.
In recent works like [15], [17], [13], and [5] remote photoplethysmography
techniques have been used for measuring physiological signals from face video
sequences captured at distance. These works used signal processing techniques
for analyzing the images, and looking for slight color and illumination changes
related with the BVP. However, using these methods in a real moving vehicle
is not straightforward due to all the variability sources present in this type of
video sequences. A selection of works related to driver monitoring and photo-
plethysmography is shown in Table 1.
2.2 Challenges and Proposed Approach
A moving vehicle is not a perfect environment for obtaining high accuracy when
using rPPG algorithms. Images acquired in this scenario may present external
illumination changes, low illumination levels, noise, movement of the driver,
occlusions, and vibrations of the camera due to the movement of the vehicle.
All these factors can make the performance of the rPPG algorithms to drop
significantly [2].
In this work we propose a system for pulse estimation for driver monitoring
that tries to overcome some of these challenges. We use a NIR camera with active
infrared illumination mounted in the dashboard of a real moving car. The NIR4 J. Hernandez-Ortega et al.
spectrum band is highly invariant to ambient light, providing robustness against
this external source of variability at a low cost. This also allowed us to extend
the application of heart rate estimation to very low illumination environments,
e.g. night conditions.
Regarding to the presence of other variability factors such as movement or
occlusions, a quality-based approach to rPPG could be adequate [6]. With a
short-time analysis, small video segments without enough quality for extracting a
robust rPPG signal could be discarded without affecting the global performance
of pulse estimation. To accomplish this target, we have proposed a quality metric
for short segments of rPPG signals.
Summarizing, in this work: i) we performed pulse estimation using NIR active
illumination to be robust to external illumination variability; ii) we proposed a
quality metric for classifying short rPPG segments and deciding which ones can
be used and which ones should be discarded in order to obtain a robust heart rate
estimation; and iii) we compared the performance of a classic rPPG algorithm
and our quality-based approach.
3 Proposed System
In this section, we describe the improvements we have done to a baseline rPPG-
based heart rate estimation system to increase its performance in a real driving
scenario. Classic rPPG systems drastically degrade when facing the variability
sources mentioned in the previous sections. This performance problem is caused
by the low quality of the extracted rPPG signals which may be affected (in their
totality or only in some fragments) by variability sources that the rPPG method
does not know how to deal with.
Having this into mind, we thought that computing a quality measure for
knowing the amount of variability in each temporal segment of a rPPG signal
could be useful for deciding which segments are more suitable for extracting a
robust heart rate estimation.
In the next subsection we describe the vanilla rPPG system we used to obtain
the baseline results. This method corresponds to the system shown in Figure 1.
In the second subsection we describe the addition of a quality metric to the
baseline system. That approach is shown in Figure 2. In the third subsection
we describe how we have obtained the groundtruth of the heart rate for our
experiments.
3.1 Baseline rPPG System
The basic method is based in the one used in [8], and consists of the next three
main steps:
– Face detection and ROI tracking: The first step consists in detecting the
face of the driver on the first frame of the NIR video. We used the Matlab
implementation of the Viola-Jones algorithm. This algorithm is known toQuality-based rPPG HR Estimation for Driver Monitoring 5
NIR Video Sequence
Fig. 1. Architecture of the baseline rPPG system for HR estimation. Given
a facial NIR video, the face is detected and the rPPG signal is extracted from the ROI.
The raw rPPG signal is windowed and postprocessed in order to obtain an individual
HR estimation for each video segment.
perform reasonably well and in real time when dealing with frontal faces, as
in our case. After the recognition stage we selected the left cheek as the Re-
gion Of Interest (ROI), since it is a zone lowly affected by objects like hats,
glasses, beards, or mustaches. The next step consisted of detecting corners
inside the ROI for tracking them over time using the Kanade-Lucas-Tomasi
algorithm, also implemented in Matlab. If at some point of the video the
ROI is lost, the face will be redetected, and after that also the ROI and the
corners.
– rPPG signal extraction: For each frame from the video, we calculated its
raw rPPG value as the averaged intensity of the pixels inside the ROI. The
final output for each video sequence is a rPPG temporal signal composed by
the concatenation of these averaged intensities.
– rPPG postprocessing: We wanted to estimate a HR value each d seconds.
In order to achieve that target, we extracted windows of T seconds from
the rPPG signal, with a stride of d seconds between them. The length of
the window (T ) is configurable in order to perform a time dependent analy-
sis. For each window we postprocessed the raw rPPG signal and we obtained
an estimation of the HR. This postprocessing method consists of three filters:
• Detrending filter: this temporal filter is employed for reducing the sta-
tionary part of the rPPG signal, i.e. eliminating the contribution from
environmental light and reducing the slow changes in the rPPG level
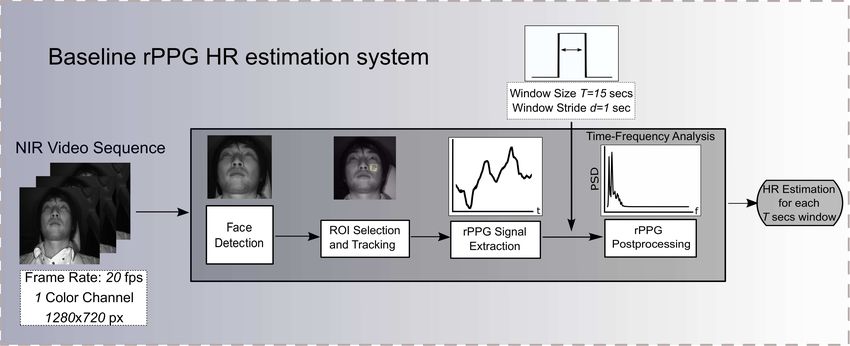
that are not part of the expected pulse signal.6 J. Hernandez-Ortega et al.
Quality-Based rPPG HR estimation system
Q & HR
for each
T' subwindow
Fig. 2. Architecture of the quality-based rPPG system for HR estimation.
We extracted some features from subwindows of the postprocessed rPPG signal. These
features were used to compute a quality metric for estimating the presence of noise,
head motion, or external illumination variability in the rPPG signal. For each T seconds
window we selected the T ′ seconds subwindow with the highest quality.
• Moving-average filter: this filter is designed to eliminate the random noise
on the rPPG signal. That noise may be caused by imperfections on the
sensor and inaccuracies in the capturing process. This filter consists in
a moving average of the rPPG values (size 3).
• Band-pass filter: we considered that a regular human heart rate uses to
be into the 40-180 beats per minute (bpm) range, which corresponds to
signals with frequencies between 0.7 Hz and 3 Hz approximately. All the
rPPG frequency components outside that range are unlikely to corre-
spond to the real pulse signal so they are discarded.
After this processing stage we transformed the signal from the time domain
to the frequency domain using the Fast Fourier Transform (FFT). Then,
we estimated its Power Spectral Density (PSD) distribution. Finally, we
searched for the maximum value in that PSD. The frequency correspondent
to that maximum is the estimated HR of that specific video segment.
3.2 Proposed Quality-Based Approach
The baseline method is able to obtain robust HR estimations in controlled sce-
narios without too much variability or noise in the recordings. However, the raw
rPPG signals acquired in a realistic driver monitoring scenario use to have high
variations due to external illumination changes, and frequent movements of the
drivers head. There are also other sources of noise, e.g. noise inherent to the
acquisition sensor.Quality-based rPPG HR Estimation for Driver Monitoring 7
(a) Frontal Pose (b) Partial Occlusion (c) Lateral Pose
Fig. 3. Images extracted from the OMRON database: (a) shows a image with
a low level of variability. A high quality rPPG signal could be extracted from a video
composed by this type of images; (b) and (c) show examples of images with high
variability, such as occlusions and head rotation respectively.
All the mentioned factors make the performance of the baseline rPPG algo-
rithm to dramatically fall. In order to make it as robust as possible, we decided
to develop an new approach, consisting of an evolution of the basic system com-
bined with a quality metric of the raw rPPG signals. A scheme of the proposed
quality-based method can be seen in Figure 2.
The target of using the quality metric is selecting the temporal subwindow
of T seconds with the highest quality from all the subwindows available inside
each T seconds window. The criteria for determining the best quality consists
in looking for the rPPG segment with the less presence of noise, head motion,
and external illumination variability, i.e. the rPPG signal closest to one that has
been captured with a contact sensor.
In order to compute the quality level, we divided each window into several
subwindows of T seconds, with a stride of d seconds between them (both param-
eters are configurable). Then we performed the processing of the rPPG signal
in the same way done in the baseline system. From each processed rPPG sub-
window we extracted several features, and we combined them to obtain a single
numerical quality measure (Q) representative of how close is the rPPG signal of
each subwindow to one acquired in perfect conditions.
Finally, from each T seconds window, we selected the segment of T seconds
with the highest Q, and we estimate the user’s HR with that rPPG segment. This
way we discarded the rPPG fragments that may be more affected by variability.
This value of the HR is used as the final HR estimation for the whole T seconds
window.
4 Dataset
4.1 OMRON Database
We tested our method with a self-collected dataset called OMRON Database.
The data in the dataset is composed by Near Infrared (NIR) active videos of8 J. Hernandez-Ortega et al.
Table 2. Left: Features extracted to compute the quality of the rPPG postpro-
cessed signals. Right: Final configuration of the parameters of the quality-based
method. *From each window of T seconds, we extracted subwindows of T ′ = 5, 6, and
7 seconds of duration, and we selected the one with the highest Q value.
Feature Description Parameter Value
Power of the maximum value in the PSD
Signal Noise Ratio (SNR) and its two first harmonics, Window Size T 7 seconds
divided by the rest of the power.
Bandwidth containing the 99% of the power,
Bandwidth (BW) Window Stride d 1 second
centered in the maximum value of the PSD.
Power of the highest peak in the PSD divided
Ratio Peaks (RP) Subwindow Size T’ 5, 6, and 7 seconds*
by the power of second highest peak.
Subwindow Stride d’ 2 seconds
Feature Vector SNR, BW, and RP
the driver’s faces, recorded with a camera mounted in a car dashboard. The
images were captured at a sampling rate of 20 fps, and a resolution of 1280 × 720
pixels. The PPG signals used for the groundtruth were captured using a BVP
fingerclip sensor with a sampling rate of 500 Hz, and then downsampled to 20
Hz to synchronize them with the images from the camera.
The dataset is comprised of 7 male users, with different ages, skin tones and
some of them wearing glasses. Each participant was in front of the camera during
a single session with a different duration for each one. The sessions went from 20
minutes to 60 minutes long. The full database contains 400, 000 images with an
average of 57, 000 images for each subject. The recordings try to represent a real
driving scenario inside a moving car. They present different types of variabil-
ity such as head movement, occlusions, car vibration, or external illumination.
These variations mean different levels of quality in the estimated rPPG signals.
Examples of images from this database can be seen in Figure 3.
5 Evaluation
In this section we compare the performance of the heart rate estimations ob-
tained using the quality-based rPPG method with the performance obtained
using the baseline rPPG method.
5.1 Setting quality parameters and features
The quality-based method has several parameters to be configured: the window
size T , the subwindow size T , the window stride d, and the subwindow stride d.
It is also necessary to decide which features to extract from the rPPG signals,
as they must contain information about the quality level of each subwindow T ′ .
For this work we extracted 3 different features that can give us information
about how close/far is a rPPG signal from the one captured in perfect conditions.
The features and their descriptions can be seen in Table 2 (left). The final quality
metric is computed as the arithmetic mean of these 3 features after normalizing
them to the [0,1] range using a tanh normalization [6].Quality-based rPPG HR Estimation for Driver Monitoring 9
Table 3. Results of HR estimation for the rPPG baseline method and the quality-
based approach. The results comprehend the individual Mean Absolute Errors (MAE)
with respect to the groundtruth HR. The mean value and the standard deviation of the
MAE for the whole evaluation data has been also computed. The relative improvement
of the MAE is shown between parentheses.
MAE [bpm] Video Number 1 2 3 4 5 6 7 8 9 10 11
Baseline Method 11.9 15.9 7.5 12.6 11.2 12.5 9.6 8.0 9.2 9.6 10.1
Proposed Method 9.1 9.9 7.5 8.1 10.9 8.2 7.9 8.7 5.7 5.8 10.5
MAE [bpm] Video Number 12 13 14 15 16 17 18 19 Mean Std
Baseline Method 8.8 14.6 10.3 13.1 7.9 11.1 9.8 15.2 11.0 2.4
8.7 1.7
Proposed Method 9.3 7.6 7.0 7.9 8.4 9.1 11.2 12.7
(21%) (29%)
Based on our own previous rPPG experiments, we decided to test values of
T going from 5 seconds to 15 seconds, with 1 second of increment for the loop.
From our previous work [8] we know that T = 5 seconds was the lowest value
that gave good HR estimation with favorable conditions, and using windows
longer than 15 seconds did not show to improve the results.
For setting the subwindow duration T , we decided to test values going from 5
seconds (limited by the minimum possible T size), to the correspondent T value
in each case. We also incremented the T ′ values using a step of 1 second. The
stride d is set to 1 second in order to give an estimation of the HR for each second
of the input video. The stride d, i.e. the temporal step between each subwindow,
took values going from a minimum of 1 second to a maximum of 5 seconds (when
possible), with 1 second of increment. After this initial configuration experiments
the best results were obtained for the parameters shown in Table 2 (right).
To compute the performance of heart rate estimations we decided to use the
Mean Absolute Error (MAE) between the groundtruth heart rate in beats per
minute (bpm), and the one estimated with the rPPG algorithm.
5.2 Results
For the final evaluation of both methods (baseline and proposed quality-based),
we processed 19 NIR videos of 1 minute duration each one from the OMRON
Database. We used the configuration of parameters shown in Table 2 (right)
for both methods (only T and d in the case of the baseline system). We first
computed the Mean Absolute Error (MAE) for each NIR video separately. We
did this to have an idea of which videos are working better and which ones are
working worse. We also computed the mean and standard deviation of the MAE
for the whole evaluation dataset.
As can be seen in Table 3, using the quality-based rPPG approach we ob-
tained a MAE value averaged across videos of 8.7 beats per minute (bpm), and
a standard deviation of 1.7 bpm for the whole evaluation dataset. Compared to10 J. Hernandez-Ortega et al.
Fig. 4. Quality Scores obtained from T ′ seconds windows. We have selected
those videos with a mean MAE under 8 bpm as representative of high quality videos,
and those with a mean MAE over 10 bpm as low quality videos. The histograms show
two different distributions, with the high quality videos presenting a higher mean value
of the quality score Q.
this result, the baseline system (without the quality approach) obtained a MAE
of 11.0 bpm and a MAE standard deviation of 2.4 bpm for the 19 minutes. This
difference in the performance represents a relative improvement of a 21% in the
mean value, and of the 29% in the standard deviation of the Mean Absolute
Error.
Table 3 also shows the MAE values for each NIR video of the evaluation
dataset, both using the baseline and the quality-based methods. It can be seen
that for some specific videos the baseline result is obtaining a more accurate es-
timation of the HR, but in general, the MAE values obtained using the quality-
based approach are lower. The specific cases in which the quality-based method
is working worse coincide with those videos with long sequences with high vari-
ability, what makes difficult to find clean segments.
In Figure 4 we are showing the quality scores Q we obtained for a selection
of the evaluation videos. We decided to show the distribution of Q scores from
those videos with a MAE value (obtained with the quality-based method) lower
than 8 bpm, and those with a MAE value higher than 10 bpm. The histograms
show two different distributions, with the best performing videos (i.e., MAE ¡ 8
bpm) presenting a higher mean value of the quality score Q.
The results of this section evidenced that, at least with the data from the
OMRON Dataset, the quality metric Q has shown to be an effective way to
discard segments of video that may impact negatively to the general performance
in rPPG, and therefore obtaining an improvement of the global accuracy of HR
estimation.Quality-based rPPG HR Estimation for Driver Monitoring 11
6 Conclusion and Future Work
In this paper we developed a method for improving heart rate (HR) estimation
using remote photoplethysmography (rPPG) in challenging scenarios with mul-
tiple sources of high-variability and degradation. Our method employs a quality
measure to extract a rPPG signal as clean as possible from a specific face video
segment, trying to obtain a more robust HR estimation.
Our main motivation is developing robust technology for contactless driver
monitoring using computer vision. Therefore, in our experiments we employed
Near Infrared (NIR) videos acquired with a camera mounted in a car dash-
board. This type of videos present a high number of variability sources such as
head movement, external illumination changes, vibration, blur, etc. The target
of the quality metric Q we have proposed consists in estimating the amount of
presence of those factors. Even though our experimental framework is around
driver monitoring, our methods may find application in other high-variability
face-based human-computer interaction scenarios such as mobile video-chat.
We have compared the performance of two different methods for HR estima-
tion using rPPG. The first one consisted in a classic rPPG algorithm. The second
method consisted in the same algorithm, but using the quality measure Q for se-
lecting which video segments present a lower amount of variability. We used those
segments for extracting rPPG signals and their associated HR estimations. The
quality metric Q showed to be a reliable estimation of the amount of variability.
We achieved better performance in HR estimation using the video segments with
the highest possible quality, compared to using all the video frames indistinctly.
Our solution is based on defining the quality Q as a combination of hand-
crafted features. As future work, other definitions of quality could be also in-
vestigated. A different set of features that may correlate more accurately to the
presence of noise factors in the rPPG signal can be studied. Training a Deep
Neural Network (DNN) for extracting Q from the video sequences is also an
interesting possibility. This type of networks may be able of estimating the qual-
ity level by learning which factors are more relevant for obtaining robust rPPG
signals directly from training data. However, the lack of labeled datasets makes
it difficult to train DNNs from scratch, so it would be also beneficial to acquire a
larger database. This new database may contain a higher number of users, and it
may also present more challenging conditions for testing our quality-based rPPG
algorithm, e.g. variant ambient illumination, motion, blur, occlusions, etc.
7 Acknowledgements
This work was supported in part by projects BIBECA (RTI2018-101248-B-I00
from MICINN/FEDER), and BioGuard (Ayudas Fundacion BBVA). The work
was conducted in part during a research stay of J. H.-O. at the Vision Sensing
Laboratory, Sensing Technology Research Center, Technology and Intellectual
Property H.Q.,OMRON Corporation, Kyoto, Japan. He is also supported by a
PhD Scholarship from UAM.12 J. Hernandez-Ortega et al.
References
1. Allen, J.: Photoplethysmography and its application in clinical physiological mea-
surement. Physiological measurement 28(3), R1 (2007)
2. Alonso-Fernandez, F., Fierrez, J., Ortega-Garcia, J.: Quality Measures in Biometric
Systems. IEEE Security Privacy 10(6), 52–62 (2012)
3. Awasekar, P., Ravi, M., Doke, S., Shaikh, Z.: Driver fatigue detection and alert
system using non-intrusive eye and yawn detection. Int. Journal of Computer Ap-
plications 975, 88–87 (2019)
4. Brandt, T., Stemmer, R., Rakotonirainy, A.: Affordable visual driver monitoring
system for fatigue and monotony. In: IEEE Int. Conf. on Systems, Man and Cy-
bernetics. pp. 6451–6456 (2004)
5. Chen, J., Chang, Z., Qiu, Q., Li, X., Sapiro, G., Bronstein, A., Pietikäinen, M.:
RealSense = real heart rate: Illumination invariant heart rate estimation from
videos. In: Image Processing Theory Tools and Applications (IPTA) (2016)
6. Fierrez, J., Morales, A., Vera-Rodriguez, R., Camacho, D.: Multiple classifiers in
biometrics. part 2: Trends and challenges. Information Fusion 44, 103–112 (Novem-
ber 2018)
7. Flores, M.J., Armingol, J.M., de la Escalera, A.: Real-time warning system for
driver drowsiness detection using visual information. Journal of Intelligent &
Robotic Systems 59(2), 103–125 (2010)
8. Hernandez-Ortega, J., Fierrez, J., Morales, A., Tome, P.: Time Analysis of Pulse-
based Face Anti-Spoofing in Visible and NIR. In: IEEE CVPR Computer Society
Workshop on Biometrics (2018)
9. Jo, J., et al.: Vision-based method for detecting driver drowsiness and distraction
in driver monitoring system. Optical Engineering 50(12), 127202 (2011)
10. Jung, S.J., Shin, H.S., Chung, W.Y.: Driver fatigue and drowsiness monitoring
system with embedded electrocardiogram sensor on steering wheel. IET Intelligent
Transport Systems 8(1), 43–50 (2014)
11. Kang, H.B.: Various approaches for driver and driving behavior monitoring: a
review. In: IEEE Int. Conf. on Computer Vision Workshops (2013)
12. Lal, S.K., et al.: Development of an algorithm for an EEG-based driver fatigue
countermeasure. Journal of Safety Research 34(3), 321–328 (2003)
13. McDuff, D., Gontarek, S., Picard, R.W.: Improvements in remote cardiopulmonary
measurement using a five band digital camera. IEEE Transactions on Biomedical
Engineering 61(10), 2593–2601 (2014)
14. Pakgohar, A., Tabrizi, R.S., Khalili, M., Esmaeili, A.: The role of human factor in
incidence and severity of road crashes based on the CART and LR regression: a
data mining approach. Procedia Computer Science 3, 764–769 (2011)
15. Poh, M.Z., McDuff, D.J., Picard, R.W.: Advancements in noncontact, multiparam-
eter physiological measurements using a webcam. IEEE Transactions on Biomedi-
cal Engineering 58(1), 7–11 (2011)
16. Shin, H.S., Jung, S.J., Kim, J.J., Chung, W.Y.: Real time car driver’s condition
monitoring system. IEEE Sensors pp. 951–954 (2010)
17. Tasli, H.E., Gudi, A., den Uyl, M.: Remote PPG based vital sign measurement us-
ing adaptive facial regions. In: IEEE International Conference on Image Processing
(ICIP). pp. 1410–1414 (2014)
18. WHO: Global status report on road safety.
https://www.who.int/violence_injury_prevention/road_safety_status/2018/en/
(2018)You can also read