QUARTERLY ECONOMIC - Vindilac Analytics
←
→
Page content transcription
If your browser does not render page correctly, please read the page content below
Volume.2 | Issue No.3    ISSN: 2706-896X

                                  QUARTERLY
                               ECONOMIC
                            CHRONICLES

©Vindilac Analytics|2020
ABOUT THIS PUBLICATION
The Quarterly Economic Chronicles is Vindilac Analytics’ economic flagship, highlighting a
series of economic events taking place at the national, regional and global levels. It is highly
driven by the need for economic literacy and financial journalism on the African continent. By
providing an economic report that is clear to a non-economist, we unintentionally create an
enabling environment for citizens to make informed economic decisions. Our report is unique
for it is now compiled and published in several official languages spoken in South Africa. This
enables readers to understand economic chronicles in their mother tongues. It is worth noting
that this report aims to complement existing economic reports in South Africa.

ISSN: 2706-896X
© 2020 Vindilac Analytics
Copyright to this material work is held by Vindilac Analytics. This work may be reproduced,
in whole or in part, for non-commercial purposes as long as full attribution to this work is
given. The contents of this work are intended for general information only and are not intended
to serve as financial or other advice. Vindilac Analytics does not accept any liability for any
direct or indirect loss whatsoever that might result from unintentional inaccurate data and
interpretations provided in this report as well as any interpretations by third parties. The views
expressed and conclusions reached are those of the authors and should not be attributed to
Vindilac Analytics.

All queries should be addressed to info@vindilac-analytics.co.za
For more information on Vindilac Analytics’ services, please visit the website below:
www.vindilac-analytics.co.za

©Vindilac Analytics|2020
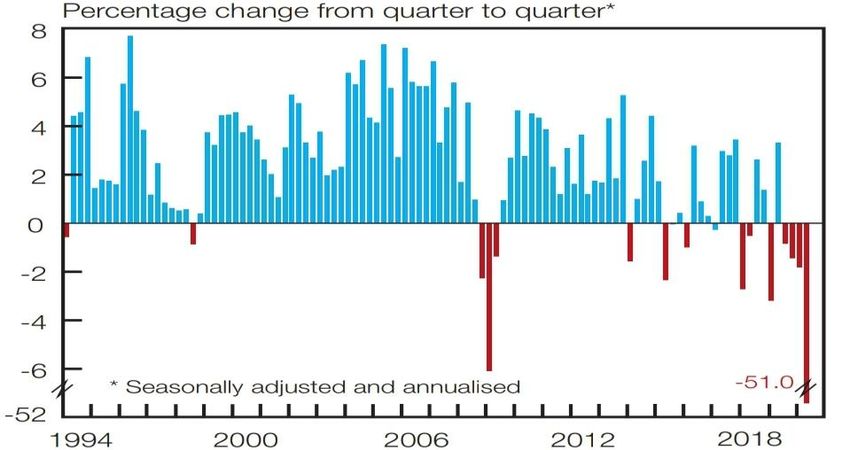
Table of Contents
ACKNOWLEDGEMENTS ................................................................................................... iv

1.   EXECUTIVE SUMMARY .............................................................................................. 1

2.   COMMUNITIES AND LIVELIHOODS ....................................................................... 3

3.   EDUCATION AND HEALTH ........................................................................................ 6

4.   FISCAL POLICY AND GOVERNANCE ..................................................................... 8

5.   BUSINESS AND FINANCE .......................................................................................... 11

6.   MONETARY FRAMEWORK ...................................................................................... 14

7.   TRADE & FINANCIAL MARKETS ........................................................................... 17

8.   ENERGY & TECH ........................................................................................................ 20

©Vindilac Analytics|2020
ACKNOWLEDGEMENTS
We would like to acknowledge and give special thanks to our team members who contributed
significantly to this project. The contributors to this project are as follows:

Team Leader                                       Seasonal Writer
Mr Baneng Naape                                   Ms Olwethu Shedi

Full-time Writer                                  Seasonal Writer
Mr Marius Masoga                                  Ms Zaziwe Maluleke

Seasonal Writer                                   Seasonal Writer
Ms Thando Mkhombo                                 Ms Mkrola Chwayita

Full-time Writer                                  Seasonal Writer
Ms Tumelo Matlhako                                Mr Caleb Qoyo

Fill-time Writer                                  Sepedi Translator
Mr Bekithemba Qeqe                                Ms Elizabeth Maite Kgopa

Full-time Writer                                  isiXhosa Translator
Mr Thabang Kumalo                                 Ms Sinesipho Ndlovu

Seasonal Writer                                    Setswana Translator
Ms Mkrola Chwayita                                 Ms Tebogo Tau

Seasonal Writer                                   Editor
Mr Thabang Serobe                                 Mr Ndivhuwo Doctor Sundani

Xitsonga Translator                               Tshivenḓa Translators
Ms Lucerth Makamu                                 Ms Muneiwa Mphidi
Ms Catherine Muhava                               Ms Mosibudi Munyadziwa

The whole team would like to give thanks to the Almighty God, for the strength and guidance
throughout this work.

                                                                                   i | Page
©Vindilac Analytics|2020
1. EXECUTIVE SUMMARY
The coronavirus pandemic took the global economy by storm, disrupting economic activity
through lockdown restrictions that were imposed to reduce local transmissions. This saw the
bulk of recent economic reports and research studies centred on the impact of Covid-19 on the
economy. The general finding is that the Covid-19 pandemic had a significant negative impact
on labour, output and investment. Although economic activity is slowly resuming amid the
lifting of lockdown restrictions, the road to economic recovery and expansion remains an
uphill. Findings in the report indicate that the economy suffered a steep slump during Covid-
19 than during the 2008 financial crisis. The European Union seems to have suffered the most
both during Covid-19 and the 2008 financial crisis, followed by advanced market economies
and emerging market economies. South Africa in particular, was harder hit during the Covid-
19 pandemic as compared to the 2008 financial crisis. This is evidenced by the recent economic
contraction of 16 per cent between the first and second quarters of 2020 (StatsSA, 2020). On
an annual basis, this translates into an annualised economic contraction of 51 per cent.
During the 2008 financial crisis, the South African economy contracted by 1.8 per cent in the
final quarter of 2008, followed by an annualised, quarter-on-quarter contraction of 6.4 per cent
in the first three months of 2009 (Marais, 2009). The gap between government revenue and
government spending has also been of great concern as it stands at 6.3 per cent of GDP and is
expected to widen to 15.7 per cent of GDP in the fiscal year ending March 2021 (Bloomberg,
2020). Meanwhile, government debt is expected to rise from 63.4 per cent in 2019/20 to 81.8
per cent in 2021/22. Of interest currently, is how policymakers are planning to reshape public
finances to ensure that there’s fiscal sustainability. This, however, will be delayed by the need
for further spending to stimulate and recover the ailing global economy.
As of 21 September 2020, South Africa moved to level 1 which saw a further relaxing of
restrictions and the closest return to pre-Covid-19 normality that we have seen this year and
will see in the near future. Estimates show that a return to pre-2019 economic activity would
take at least 5 years without major economic interventions (United Nations Development
Programme, 2020). In the last months, data on the impact of the national shutdown has been
slowly released confirming the case made in first-quarter report that restrictions had locked out
those in the informal sector, endangering the livelihoods of the poorest and that interventions
through social grants were best suited for combating the harmful effects. The gradual easing of
a lockdown has seen a reduced hunger and increased employment. The crisis had an effect of
worsening inequality as the gender wage gap has increased and employment in rural
communities has been slow to recover compared to urban areas. This has all served to confirm
that adverse shocks can and do easily generate poverty traps.
Despite employment of certain strategies to ascertain continued delivery of good quality
education, the negative shock to the education system is so significant that it is reasonable to
expect a drop in the school completion rate and subsequently a rise in repetition rate in all
levels of education. Failure to address the negative impact of Covid-19 on education outcomes
may create a cycle of unsatisfactory education outcomes. Reduced completion rate and
increased class repetition rate may overwhelm the education infrastructure through the
increased ratio of pupil to teacher, increased number of students per textbook, and the number
of students per class; and other related matters.
1 | Page
©Vindilac Analytics|2020South Africa has come a long way from the start of the lockdown level 5 in March 2020 to
lockdown level 1 announced in September 2020. After a long six months of limited economic
activity and limited mobility, the damage seems irreversible for most businesses as some have
ceased to exist due to existing business difficulties. However, for a few businesses it was an
opportunity to venture into new ways of doing business. On the retail front, Edcon has been in
business rescue since April 2020 with over 17000 jobs at stake. As of 25 September 2020, the
Foschini Group (TFG) has concluded the sale of 382 South African Jet stores saving
approximately 4800 employees (TFG, 2020). While for airlines such as FlySafair and Mango
it is business as usual, the South African Airways (SAA) and Comair have not returned to the
skies. Comair which also owns Kulala is still under business rescue and aims to be back on the
skies in November 2020. For SAA, it is uncertain as it needs R10.5 billion for the entity to
resume business. Nonetheless, the business confidence index gained momentum in the third
quarter of 2020 to 24 from a record low of 5 in the second quarter of 2020. All sectors have
shown improvements with the retail sector improving significantly to 33 from 11 in the second
quarter of 2020. The wholesale sector improved the most to 33 from 4 in the previous quarter.
This has shown how the easing of economic activity has driven the confidence of the
respondents.
Lockdown restrictions created a negative supply shock and consequently a negative demand
shock. This exacerbated the already low investor confidence as well as low consumer
confidence (SARB, 2020). Low consumer demand as a result of job losses as well as a decline
in oil prices resulted in a low inflation rate. As a result, inflation was below the target range of
3-6 %, sitting at 2.2% in June 2020 before falling back into the target range at 3.2% in July
2020 (Stats SA, 2020). Although there was a slight increase in inflation on a month-to-month
basis, these figures are relatively lower than the pre-Covi-19 figures.
In commodity markets, crude oil prices have hit a major slump since the start of the year. On
September 28th, the OPEC basket stood at $41.61 per barrel, compared to $ 42.43 for Brent
crude oil and $ 40.57 for West Texas Intermediate (WTI) oil (Sonnichsen, 2020). Oil demand
drastically declined following lockdowns and travel restrictions due to the coronavirus
pandemic. Furthermore, initial outlooks and uncertainty surrounding the pandemic led to a
disagreement between two of the largest oil producers (Russia and Saudi Arabia) in early
March. Negotiations between global oil producers led to an agreement on April 13th, with
promises to cut petroleum output and help stabilize the oil prices. Following the outbreak of
the virus and its subsequent declaration as a global health crisis in March 2020, the stock market
in the US hit a circuit breaker for the first time since 1997.
There is a great need to establish a working relationship between the state and the central bank.
The relationship can enhance an informed response to domestic economic conditions as well
as global threats. An adequate response to macroeconomic concerns requires a balanced
response from the central bank and the ministry of finance. South Africa battles enormous
structural problems, with electricity shortages being a major problem. Electricity shortages will
delay economic recovery and expansion in the medium to the long-term. Eskom outlined that
load shedding will persist further into 2021. This, of course, will cost the country millions of
rands in production and further exacerbate unemployment. Therefore, plans for economic
recovery should focus more on infrastructure development as an incentive to drive the
recovery.
2 | Page
©Vindilac Analytics|20202. COMMUNITIES AND LIVELIHOODS
- Caleb Qoyo
2.1.Introduction
The year 2020 proved to be challenging as the Covid-19 pandemic resulted in a nationwide
lockdown that drastically reduced economic activity. As of 21 September 2020, South Africa
moved to level 1 which saw a further relaxing of restrictions and the closest return to pre-
Covid-19 normality that we have seen this year and will see in the near future. Estimates show
that a return to pre-2019 economic activity would take at least 5 years without major economic
interventions (United Nations Development Programme, 2020). In the last months, data on the
impact of the national shutdown has been slowly released confirming the case made in first-
quarter report that restrictions had locked out those in the informal sector, endangering the
livelihoods of the poorest and that interventions through social grants were best suited for
combating the harmful effects. The gradual easing of a lockdown has seen a reduced hunger
and increased employment. The crisis had an effect of worsening inequality as the gender wage
gap has increased and employment in rural communities has been slow to recover compared to
urban areas. This has all served to confirm that adverse shocks can and do easily generate
poverty traps.
2.2.Informal sector- Hardest hit, slowest to recover
A person is defined as informally employed if they have no written contract with their
employer, this is regardless of whether they are self-employed, are casual worker, or work fixed
regular hours (International Labour Organization, 2004). The nature of the sector is such that
there is still no sufficient data to meaningfully determine the depth of the impact of Covid-19.
However, the interest in researching and formulating meaningful policy for this sector that has
come about in the last decade has shed some light on it. The informal sector tends to be more
sensitive to negative shocks than the formal sector as data gathered from the 2008/09 Financial
Crisis showed that the sector did not act as a shock absorber (taking in new entrants) but rather
shed more jobs than the formal sector (Fourie, 2018). Seeing that the underlying structural issue
of the economy has not improved much since then we can expect the effect of the Covid-19
pandemic to be similar and even more acute to the informal sector.
Figure 2.1: Percentage net loss in employment between February and June 2020 by sub-group
Source: Jain et al 2020, NIDS-CRAM Wave 2
3 | Page
©Vindilac Analytics|2020Jain et al (2020) observed that for the first half of the year (February to June) workers who are
from rural areas, mostly female, experienced the largest drop in employment within the
informal sector. Relaxed restrictions in the second half of the year should show a steady
recovery of jobs in each sector as data for the 3rd and 4th quarter comes out. The observation
period ended in June 2020 when restrictions were moderate but notably still excluded
consumption of food and beverages at or in a place of sale. In this regard, this is anticipated to
give a much-needed boost to the parts of the sector (e.g. restaurants and shebeens) that was still
severely impacted by restrictions.
Research in South Africa and globally shows consistent gender differences in the labour market
responses to economic crises, with women often experiencing a decrease in self-employment
and an increase in unpaid work (Fallon and Lucas, 2002; Horn, 2010). Rogan and Skinner
(2020) showed that for April 2020 women in the informal economy saw a decrease of 49
percent in the typical hours worked while men in informal employment saw a 25 percent
decrease in typical hours. The prolonged closure of schools created the added responsibility of
childcare, of which was done mostly by women.
2.3.The Social wage – A Largely successful intervention
In response to the Covid-19 crisis and regulations which restricted movement and interaction,
governments around the world expanded their social protection systems as a means of
providing relief to vulnerable individuals and households (Köhler & Bhorat, 2020). This was
also the case in South Africa as the government expanded its unconditional cash transfers
(social grants) by increasing both the amounts of all existing transfers and introducing a special
Covid-19 Social Relief of Distress grant for six months from May to October 2020.
Figure 2.2: Relative increase in per capita household income attributable to Child Support Grant
Source: (Köhler & Bhorat, 2020)
Apart from the inefficiencies with delivery, this has largely been an effective measure since
grants substantially increase the incomes of poor households in relative terms. For the poorest
30 percent of households, getting a child support grant increased the per capita household
income by 63 per cent while for the richest 30 per cent it resulted in a 3 per cent increase. It
also happens that 63 per cent of employed people in the needy households work in the informal
4 | Page
©Vindilac Analytics|2020sector and 78 per cent of those in the poorest 10 per cent of households that receive the child
support grant are informally employed as well (Köhler & Bhorat, 2020). Figure 2 bellow
further highlights the effectiveness of the cash transfers.
2.4.Conclusion
As year-end approaches, restrictions relax and measures such as those made in social wage
increase, expire. The livelihoods of many, however, remain worse off than they were this time
last year. The crisis has only served to highlight existing structural weaknesses in the economy
and hopefully present the need to rebuild a post-crisis economy that is more robust to negative
shocks. To do so potential areas that need reform are:
• Further support for the SMME sector that also considers the peculiarities of the informal
sector.
• Government may need to extend the Child Support Grant top up past October.
With countries such as France, Poland, Netherlands, Germany, and Brazil experiencing signs
of a second wave under relaxed restrictions, there is a possibility that this might happen in
South Africa. While it is unlikely that we will ever return to strict levels of lockdown if such
an event arises then we can implement the lessons and failures learned this year.
5 | Page
©Vindilac Analytics|20203. EDUCATION AND HEALTH
- Chwayita Mkrola
Mkrola (2020) documented some potential impacts of Covid-19 on education outcomes and
financing education. Despite employment of certain strategies to ascertain continued delivery
of good quality education, the negative shock to the education system is so significant that it is
reasonable to expect a drop in the school completion rate and subsequently a rise in repetition
rate in all levels of education. The following figure shows the school completion rate and
repetition rate per level of education for the years 2016 and 2017, which is the latest data
available at Unesco Institute for Statistics. The school completion rates were 96.13 for primary
schools, 87.67 for lower secondary schools, and 46.52 in upper secondary schools. It is evident
that as pupils progress to higher grades, the completion rate decreases. The graduation rate in
tertiary institutions increased from 9.72 to 10.26 percent. These graduation rates remain low
compared to most countries including Russia (70.29), India (27.92) and China (32.94).
Figure 3.1: school completion rates
reduced
completion/g
120,00%
96,13% raduation
100,00% 87,67% rate
80,00%
PERCENT
60,00% 46,52%
increased
40,00% reduced class
20,00% 9,72% 10,26% productivity repetition
rate
0,00%
overwhelmed
education
LEVEL OF EDUCATION infrastructure
Source: Unesco Institute for Statistics (2020)
Failure to address the negative impact of Covid-19 on education outcomes may create a cycle
of unsatisfactory education outcomes as shown in figure 3.1. Reduced completion rate and
increased class repetition rate may overwhelm the education infrastructure through the
increased ratio of pupil to teacher, increased number of students per textbook, and the number
of students per class; and other related matters. To reduce this impact, education expenditure
must be increased according to per-capita spending per level of education and the number of
repeaters. However, the economic impact of Covid-19 may limit the fiscal power to inject
finances into the education system.
One of the most immediate response would be to make voluntary work in the final year of
study compulsory for NSFAS and Funza Lushaka beneficiaries, these final year students must
be allocated to schools with high repetition rates; to reduce the number of pupils per teacher,
while simultaneously allowing university students to gain experience and increase their
employability status. Additionally, an option for distant and independent learning in all levels
of school must be made available; students may then appear in schools only for exams. This
can reduce the number of students per classroom and avoid overwhelming education
6 | Page
©Vindilac Analytics|2020infrastructure. Concerning tertiary institutions who failed with ensuring successful
implementation of remote learning strategies on time, affected students must be allowed free
registration with the institution, tuition fee enrolment when a student takes the option to study
independently and remotely but only appear for exams. This can avoid increased student debt
and can reduce the burden of financing education for both households and government (through
NSFAS), especially given the impact of Covid-19 on household income and government
revenues. Private schools should also offer tuition-free or enrolment for students who repeat a
class due to Covid-19 and offer them a sit for exams.
7 | Page
©Vindilac Analytics|20204. FISCAL POLICY AND GOVERNANCE
- Baneng Naape
4.1.The impact of the 2008 financial crisis vis-a-vi the Covid-19 pandemic
The coronavirus pandemic took the global economy by storm, disrupting economic activity
through lockdown restrictions that were imposed to reduce local transmissions. This saw the
bulk of recent economic reports and research studies centred on the impact of Covid-19 on the
economy. The general finding is that the Covid-19 pandemic had a significant negative impact
on labour, output and investment. Although economic activity is slowly resuming amid the
lifting of lockdown restrictions, the road to economic recovery and expansion remains an
uphill. In this issue, our focus is on comparing the impact of the 2008 Global Financial Crisis
vis-a-vi the impact of the global coronavirus pandemic on the economy. It is worth mentioning,
that our comparisons of the impact of Covid-19 on the economy are based on estimates and
illustrated using figures 4.1 and 4.2.
Figure 4.1: Trends in Real GDP growth Figure 4.2: Trends in the inflation rate
Real GDP (Annual Growth) Inflation rate (Annual Percentage change)
10 120
100
5
80
0 60
40
-5
20
-10 0
1980 1990 2000 2010 2020 1980 1990 2000 2010 2020
2008 Crisis Covid19 2008 Crisis Covid19
South Africa Advanced Economies South Africa Advanced Economies
Emerging Economies European Union Emerging Economies European Union
Source: World Development Indicators (2020)
It is undoubtedly clear from figure 4.1 that the economy suffered a steep slump during Covid-
19 than during the 2008 financial crisis. The European Union seems to have suffered the most
both during Covid-19 and the 2008 financial crisis, followed by advanced market economies
and emerging market economies. South Africa in particular, was harder hit during the Covid-
19 pandemic as compared to the 2008 financial crisis. This is evidenced by the recent economic
contraction of 16 per cent between the first and second quarters of 2020 (StatsSA, 2020). On
an annual basis, this translates into an annualised economic contraction of 51 per cent. During
the 2008 financial crisis, the South African economy contracted by 1.8 per cent in the final
quarter of 2008, followed by an annualised, quarter-on-quarter contraction of 6.4 per cent in
the first three months of 2009 (Marais, 2009).
The inflation rate can also be used to illustrate the impact of a crisis on the economy. During a
crisis, the inflation rate usually deteriorates since consumption and production become
depressed. As a result, the affected nation would experience deflation. To the extent to which
expansionary policies are employed, the inflation rate would gain momentum in the long run.
8 | Page
©Vindilac Analytics|2020This theory can be observed empirically from figure 4.2. During the 2008 financial crisis,
several advanced market economies including Japan, the United Kingdom (UK) and the United
States (US) experienced deflation. As a result, several central banks had to execute large-scale
asset purchases or the so-called “Quantitative Easing” in response to the deteriorating inflation
rate. During the Covid-19 pandemic, a similar trend was observed. The Covid-19 pandemic
stroke the global economy at the back of historically low inflation rates, sluggish growth and
low-interest rates. As such, countries had to employ their fiscal policy tools by providing tax
relief measures to struggling businesses and individuals and increasing spending through
deficit financing. To some extent, the combination of these measures managed to stimulate
demand and avoid further deflation. It can be seen again from figure 4.2 that deflation was
more severe during the Covid-19 pandemic than during the 2008 financial crisis.
4.2.The Fiscal Stance: Do the numbers balance?
It is clear from earlier discussions that the Covid-19 pandemic had severe effects on the global
economy than the 2008 financial crisis had. A major difference between the two crises lies in
the way policymakers responded to them. For example, during the 2008 financial crisis,
policymakers made use of expansionary monetary policy tools through bulk long-term asset
purchases. In contrast, during the Covid-19 pandemic, policymakers exhausted fiscal policy
tools through increased spending, borrowing and tax relief measures. Of interest currently, is
how policymakers are planning to reshape public finances to ensure that there’s fiscal
sustainability. This, however, will be delayed by the need for further spending to stimulate and
recover the ailing global economy.
Figure 4.3: Trends in unemployment rate Figure 4.4: Trends in fiscal indicators
Unemployment rate (Annual change) Fiscal Indicators: South Africa
40 90
35 80
70
30
60
25 50
20 40
15 30
20
10
10
5 0
0 2000 2003 2006 2009 2012 2015 2018 2021
1980 1990 2000 2010 2020
2008 Crisis Covid19 Expenditure
2008 Crisis Covid19 South Africa Revenue Gross Debt
Source: World Development Indicators (2020)
The skyrocketing unemployment rate remains one of the triple challenges in South Africa. A
recent study by the National Income Dynamics Coronavirus Rapid Mobile Survey revealed
that close to 3 million people lost their jobs over the lockdown in South Africa. This is three
times the number of jobs lost during the 2008 financial crisis1. Nonetheless, the South African
1
For a detailed discussion on unemployment in South Africa, please see the featured article on page 13
9 | Page
©Vindilac Analytics|2020economy was performing exceptionally well during the early 1990s and to a great extent, this
benefited revenue mobilisation through automatic stabilizers. Government revenue was
performing well above government expenditure and because the gap between government
revenue and expenditure was narrow, minimal budget deficits were incurred. Notably, minimal
budget deficits imply reduced borrowing requirements and the opportunity to significantly
reduce government debt. This can also be seen in figure 6 from the downward trend in the level
of gross government debt between the period 2000 and 2008. Following the 2008 financial
crisis, government debt rose significantly as a result of increased deficit spending by the
government. Post the period 2008, government expenditure has been well above government
revenue. Today, the gap between government revenue and government spending stands at 6.3
per cent of GDP and is expected to widen to 15.7 per cent of GDP in the fiscal year ending
March 2021 (Bloomberg, 2020). Meanwhile, government debt is expected to rise from 63.4
per cent in 2019/20 to 81.8 per cent in 2021/22. It is clear from these statistics that the fiscal
numbers do not balance and are not expected to balance any time soon.
10 | Page
©Vindilac Analytics|20205. BUSINESS AND FINANCE
- Zaziwe Maluleke
5.1. How far we have come
South Africa has come a long way from the start of the lockdown level 5 in March 2020 to
lockdown level 1 announced in September 2020. After a long six months of limited economic
activity and limited mobility, the damage seems irreversible for most businesses as some have
ceased to exist due to existing business difficulties. However, for a few businesses it was an
opportunity to venture into new ways of doing business. On the retail front, Edcon has been in
business rescue since April 2020 with over 17000 jobs at stake. As of 25 September 2020, the
Foschini Group (TFG) has concluded the sale of 382 South African Jet stores saving
approximately 4800 employees (TFG, 2020). This is an opportunity TFG got from the
lockdown.
While for airlines such as FlySafair and Mango it is business as usual, the South African
Airways (SAA) and Comair have not returned to the skies. Comair which also owns Kulala is
still under business rescue and aims to be back on the skies in November 2020. For SAA, it is
uncertain as it needs R10.5 billion for the entity to resume business. The Department of Public
Enterprises (DPE) is clear that the national carrier will not be liquidated and prioritises the
finalisation and implementation of the business rescue process (DPE, 2020).
From the start of lockdown level 4, there has been a rise in the number of businesses
liquidations2 . The figure below illustrates the number of liquidations that took place since
December 2019, this has seen the liquidations drop to 0 in April 2020 as the country was in
lockdown level 5. The number of liquidations rose to 228 in August, which includes both
voluntary and involuntary business liquidations. Most of the liquidations came from financing,
insurance, real estate, business services which has the most businesses and employs a lot of
people with 74 liquidations concluded for August (StatsSA, 2020). Trade, catering and
accommodation have 39 liquidations for August (StatsSA, 2020). This is evidence that for most
businesses, the easing of restrictions still made it difficult for a business to continue.
Figure 5.1: Number of Business Liquidations
250
200
150
100
50
0
Oct-19 Dec-19 Jan-20 Mar-20 Apr-20 Jun-20 Aug-20 Sep-20
Source: StatsSA, 2020
5.2.Business confidence
The business confidence index gained momentum in the third quarter of 2020 to 24 from a
record low of 5 in the second quarter of 2020. All sectors have shown improvements with the
2
Liquidation is a formal insolvency procedure in which a company is ended; all its assets are liquidated and the proceeds
from the sale of assets is used to repay creditors.
11 | Page
©Vindilac Analytics|2020retail sector improving significantly to 33 from 11 in the second quarter of 2020. The wholesale
sector improved the most to 33 from 4 in the previous quarter. This has shown how the easing
of economic activity has driven the confidence of the respondents.
Figure 5.2: RMB/BER Business confidence index 3
60
50
40
PERCENTAGE
30
20
10
0
2008Q1
2008Q3
2009Q1
2009Q3
2010Q1
2010Q3
2011Q1
2011Q3
2012Q1
2012Q3
2013Q1
2013Q3
2014Q1
2014Q3
2015Q1
2015Q3
2016Q1
2016Q3
2017Q1
2017Q3
2018Q1
2018Q3
2019Q1
2019Q3
2020Q1
2020Q3
Source: Bureau for Economic Research (2020)
5.3.Tourist accommodation income
South African tourism has lost significant income due to the domestic and international borders
being closed to contain the virus in various countries. This has seen income drop to an all-time
low of approximately 40 million, but it is slowly recovering, at 200 million in July.
Figure 5.3: Tourist accommodation income
R2 250
R2 000
R1 750
R1 500
MILLIONS
R1 250
R1 000
R750
R500
R250
R0
Source: StatsSA (2020)
The biggest losses came from caravan parks and camping parks which peaked -99% between
April and June and slowly recovering to -97.6% in July; guest-houses and guest-farms where
contractions peaked -99.4% in May and recovering to -87.4% in July; and hotels peaking at -
98% in April and May and recovering to -88.1% in July (StatsSA, 2020). The opening of
international borders will allow tourists to visit South Africa which will improve revenues for
the sector. Health requirements remain a concern as anyone entering or leaving the country
needs to have tested negative for Covid-19 within 72 hours.
3
An index less than 50 is said to indicate a loss of confidence, while an index of more than 50 shows increased confidence.
12 | Page
©Vindilac Analytics|20205.4.What can South African businesses do differently?
Businesses should investigate phasing out the typical physical business structure as Covid-19
has proven that people can work remotely from home without compromising productivity or
sales. Providing employees with Information and Communications Technology (ICT) training
is also crucial to ensure that employees are up to date with technologically led ways of doing
business.
13 | Page
©Vindilac Analytics|20206. MONETARY FRAMEWORK
- Thabang Serobe
6.1. Economic Overview
6.1.1. GDP trends
South Africa’s economy was already in shambles pre-Covid-19, characterized by high
unemployment figures, low output rates, high inequality gap and low investor confidence.
Output levels had already contracted three consecutive quarters before Covid-19 lockdown
(South African Reserve Bank, 2020). For example, GDP contracted by 0.8% in the third quarter
of 2019, followed by a contraction of 1.4% in the fourth quarter of 2019 and a contraction of
1.8% in the first quarter of 2020 (STATS SA, 2020). This year’s first-quarter contraction can
be attributed to intense electricity load shedding which significantly impacted the
manufacturing and mining sectors, resulting in lower production.
Lockdown restrictions in March 2020 exacerbated the situation leading to a GDP contraction
of 51.0% in the second quarter of 2020. Manufacturing contributed greatly to the contraction
with a decline of 74. 9% in the second quarter of 2020.
Figure 6.1: Growth in GDP (%)
Source: SARB (2020)
6.2.Inflation
Lockdown restrictions created a negative supply shock and consequently a negative demand
shock. This exacerbated the already low investor confidence as well as low consumer
confidence (SARB, 2020). Low consumer demand as a result of job losses (an estimation of
2.2 million job losses) as well as a decline in oil prices resulted in a low inflation rate. As a
result, inflation was below the target range of 3-6 %, sitting at 2.2% in June 2020 before falling
back into the target range at 3.2% in July 2020 (Stats SA, 2020).
Although there was a slight increase in inflation on a month-to-month basis, these figures are
relatively lower than the pre-Covi-19 figures. “Price changes for products banned for sale in
June were also imputed in this as there are no actual June prices available to use for comparison
with actual July prices.” (Stats SA, 2020).
14 | Page
©Vindilac Analytics|2020Table 6.2: CPI headline year-on-year rates
Source: STATS SA (Second quarter CPI, 2020)
6.3.Interest rates
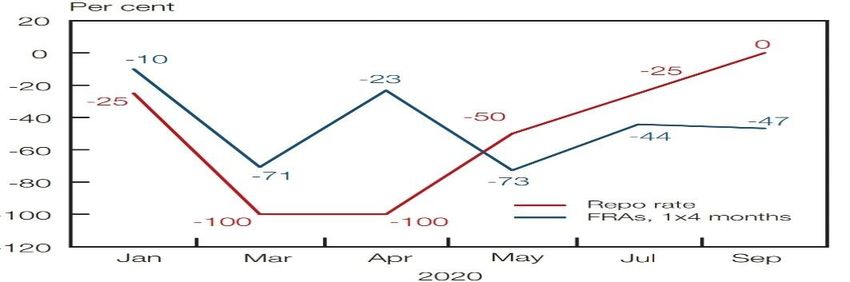
At the height of the pandemic, SARB used interest rates as the major instrument to stimulate
the economy, and influence inflation and demand. In response to the global spread of Covid-
19, the Monetary Policy Committee (MPC) decided to cut the repo rate by 100 basis points in
March 2020. However, the decision did not take into consideration the domestic lockdown that
was to follow. As a result, the MPC decided to further cut the repo rate by 100 basis points in
April 2020 following the announcement of domestic lockdown (SARB, 2020).
Figure 6.3: Short-term rates: market expectations versus actual outcome
Source: Bloomberg and SARB (2020 )
Following the Quarterly Projection Model (QPM) repo rate projections, the MPC decided to
further implement two consecutive repo rate cuts of 50 and 25 basis points over the second half
of 2020. This left the repo rate at 3.5% and the prime lending rate at 7%.
6.4.The coordination between the central bank and the National Treasury
There is a great need to establish a working relationship between the state and the central bank.
The relationship can enhance an informed response to domestic economic conditions as well
as global threats. An adequate response to macroeconomic concerns requires a balanced
response from the central bank and the treasury. Evident in the South African case, an
independent response by either the treasury or the central bank is inadequate to address the
economic challenges. Therefore, the government’s response to the economic crisis requires a
sound and scientific integrated plan inclusive of both fiscal policy and monetary policy.
A working relationship between the South African Reserve Bank and the National Treasury
can lower the interest in nationalization of the reserve bank. The relation can, in essence,
15 | Page
©Vindilac Analytics|2020support the political independence of the central bank. It can also help to insulate monetary
policy decisions from political processes. With no interference, the central bank will be able to
independently implement its mandate.
6.5.Conclusion
South Africa battles enormous structural problems, with electricity shortages being a major
problem. Electricity shortages will delay economic recovery and expansion in the medium to
the long-term. (SARB, 2020). Eskom outlined that load shedding will persist further into 2021.
This, of course, will cost the country millions of rands in production and further exacerbate
unemployment. Therefore, plans for economic recovery should focus more on infrastructure
development as an incentive to drive the recovery. The government and the central bank can
play an important role in stimulating both demand and supply.
Expansionary monetary policy, for the Covid-19 period, has begun to yield results as there are
signs of recovery in the mortgage applications and grants through the help of low-interest rates.
Low-interest rates support credit growth as well as government borrowing. Moreover, lower
interest rates assist to curb inflation and to ensure that it is contained within the target range
(SARB 2020).
To strengthen the recovery, the government should put more emphasis on sovereign debt
sustainability, fiscal policy stance as well as structural reforms. It will take some time for the
economy to return to pre-2019 levels. However, with proper measures in place, appropriate
monetary policy instruments and sufficient resources, economic recovery is certain.
16 | Page
©Vindilac Analytics|20207. TRADE & FINANCIAL MARKETS
- Bekithemba Qeqe
The outbreak of the Covid-19 pandemic has created significant uncertainty surrounding almost
every aspect including employment, people’s livelihoods, businesses, the capacity of
healthcare systems to meet an extraordinary challenge; how long it will take to develop
effective vaccines; the ultimate size of the mortality shock; the duration and effectiveness of
social distancing, market lockdowns, and containment strategies; the near-term economic
impact of the pandemic and policy responses; the speed of global economic recovery, etc.
While volatility is regarded as a natural occurrence in financial markets, the uncertainty
associated with the outbreak of the virus has inspired a greater than normal amount of volatility,
especially during the first three months of 2020. Following the outbreak of the virus and its
subsequent declaration by the World Health Organisation (WHO) as a global health crisis in
March 2020, the stock market in the US hit a circuit breaker for the first time since 1997.
A circuit breaker is a “fail safe-measure” aimed at curbing panic selling in the stock market
(Fronda, 2020). They typically involve stopping trading for a period of some time, in the event
that share prices fall to below predetermined levels. Stock markets in Europe and Asia also
plunged during this period. Figure 10 shows changes in the Chicago Board Options Exchange
(CBOE) VIX index, a measure of global market volatility between the end of the 1st quarter
and the beginning of the 4th quarter of 2020. As can be seen on the graph, the VIX index closed
at around 57.08% on 30 March 2020, indicating a significant amount of uncertainty and
volatility during the first quarter. Central banks and authorities around the world responded
immediately by throwing their policy instruments into the market. The South African Reserve
Bank in particular, cut the repo rate by a total of 300 basis points to 3.50%, leading also to a
reduction in prime rate quoted by commercial banks to 7.00 %.
Additional measures taken by the monitory authorities include providing regulatory relief to
the financial sector to maintain credit flow as well as the buying of governments in the
secondary market to improve market functioning. These measures coupled with fiscal policy
responses and a gradual return to economic activity in different parts of the world, inspired
forward-looking optimism and this led to a decline in volatility to below 30% by the 1st of
October 2020 as shown in figure 7.1.
Figure 7.1: Changes in CBOE VIX global stock market volatility index
60
(%INDEX)
50
40
30
20
10
0
30/03/2020 30/06/2020 30/09/2020 01/10/2020
SOURCE : OWN DIAGRAM MADE WITH DATA FROM CBOE
17 | Page
©Vindilac Analytics|2020Local stocks followed a similar trend as the global markets, with the Johannesburg Stock
Exchange All Share Index (JSE ALSI) closing at 54 445.78 on 1st October 2020, 20.26% higher
than the 43 413.63 observed on the last day of March 2020. In the currency markets, the rand
and other emerging market currencies weakened significantly against the relatively stronger
US dollar for most of the time since the start of the year. The rand fell 19% against the dollar
in the first six months of the year, while the Brazilian Real was down 26%, Mexico Peso was
down 18% and the Turkey lira was down by almost 13% over the same period as investors
were pulling back from emerging markets due to growing uncertainty and poor economic
growth prospects (BusinessTech, 2020). The rand was sitting at R16/$ on 1st October 2020 as
compared to the R17/$ observed on the last day of March 2020.
In commodity markets, crude oil prices have hit a major slump since the start of the year. On
September 28th, the OPEC basket stood at $41.61 per barrel, compared to $ 42.43 for Brent
crude oil and $ 40.57 for West Texas Intermediate (WTI) oil (Sonnichsen, 2020). Oil demand
drastically declined following lockdowns and travel restrictions due to the coronavirus
pandemic. Furthermore, initial outlooks and uncertainty surrounding the pandemic led to a
disagreement between two of the largest oil producers (Russia and Saudi Arabia) in early
March. Negotiations between global oil producers led to an agreement on April 13th, with
promises to cut petroleum output and help stabilize the oil prices.
However, with storage facilities and oil tankers quickly filling up, fears grew over where to
store excess oil, leading to benchmark prices seeing record negative prices between April 20
and April 22 (Sonnichsen, 2020). Some industry experts have estimated that oil demand may
take until 2022 to see a full recovery, especially if the possibility of a second wave of
coronavirus eventually materializes. The price of precious metals has been on the rise since the
start of the year. Gold prices have increased more than 32% so far this year, breaching the
$2,000 mark for the first time in history in August 2020. Silver prices also followed in the same
direction, increasing more than 30% thus far (Tan, 2020).
The effects of the pandemic were also felt through the disruptions to international trade and
global supply chains. This affected mainly the trade-dependent, least developed countries in
Africa due to their strong reliance on exports of commodities, tourism as well as imports of
medical, pharmaceutical and food products (Agarwal & Mulenga, 2020). While countries have
tried to keep trade open to reduce the negative impact on vulnerable populations around the
world by announcing policy measures to ensure supply of essential goods and maintain supply
chain connectivity, they have also been forced implement restrictive measures to protect their
domestic markets in the form of export bans, import restrictions and subsidies to import-
substituting industries to reduce dependence on imported goods and improve self-reliance
(Agarwal & Mulenga, 2020).
18 | Page
©Vindilac Analytics|2020Figure 7.2: African Trade Statistics (March 2020-August 2020)
2E+10
1,5E+10
1E+10
Trade(R-billions)
5E+09
0
MARCH APRIL MAY JUNE JULY AUGUST
Months
Export Imports
SOURCE : OWN DIAGRAM MADE WITH DATA FROM SARS
Figure 7.2 above shows the African trade statistics from March to August 2020. A slowdown
in economic activity due to the closing of national borders meant that essential commodities
cannot be moved to vulnerable regions, thus depriving people of much-needed health care and
food supplies. This is shown in the graph by the sharp decline in trade (exports and imports)
during April 2020. As shown in the figure, trade improved from May 2020 as more and more
countries including South Africa began to lift restrictions and return to economic activity.
South Africa in a particular recorded a trade surplus of R38.87 billion in August 2020 as
compared to the R24.25 billion realised in March 2020 (South African Revenue Services
(SARS), 2020). The trade surplus was attributable to exports of R130.22 billion and imports of
R91.35 billion during August (SARS, 2020).
Financial markets usually move in the same direction as the real economy, however, there were
times during the year where some disconnect was observed between the markets and the real
economy. An example is when unemployment in the US increased significantly, with 36
million Americans filing for unemployment claims and US GDP falling by 4.8%, but US stock
was surprisingly increasing (Reinicke, 2020). Notwithstanding this, however, what has
remained clear since the start of the year is that markets don’t react well to uncertainty, hence
it is expected that the down and up fluctuations in the markets will continue to exist for some
reasonable time into the future. Investors are thus encouraged during this time of uncertainty
and volatility to avoid reacting from a place of fear or panic, always have an emergency fund,
focus on diversifying their portfolios and develop a long-term perspective when making
financial plans or investments.
19 | Page
©Vindilac Analytics|20208. ENERGY & TECH
- Thabang Serobe
8.1.Energy (Focus on IPPs)
“Electricity is differentiated from the other services we find in the home. Unlike air or water
that can be harvested from nature, electricity must be manufactured” (Eskom, 2020). Electricity
is vital to economic growth. It fuels the economy, creates employment and stimulates output.
In the second half of 2020, Eskom continued to battle with load shedding crisis emanating from
the constant growing electricity demand. Much of lockdown restrictions offered the power
utility an opportunity to service and maintain its power stations to mitigate the load shedding
crisis, however, Eskom's progress has been eroded as the power utility cannot meet the
electricity demands due to the easing of lockdown restrictions. The latest load shedding
schedules were blamed on cold conditions that sparked the demand.
In the past few years, there has been an enormous demand for electricity than Eskom can
generate. The average annual electricity demand is estimated to grow by 2.0% by 2030 and
1.66% by 2050. This calls for a geared-up response in electricity generation capacity to meet
the growing demand. Much has been said on the effects of load shedding on the economy,
however, with the current generation, frequent load shedding schedules are inevitable. Other
methods of electricity generation are “either impractical or much more expensive” as Eskom
alludes (Eskom, 2020). This acknowledges that the country is far from reaching sustainable
clean energy and the energy crisis will persist for the foreseeable future. However, with the use
of Independent Power Producers, the country can gradually move to sustainable and green
energy.
Through the Renewable Energy Independent Power Producer Procurement Programme
(REIPPPP), the government has been able to achieve a significant step in addressing the
incapacity of Eskom to meet the demand. IPPs contribute about 5% to the electricity generated
in the country (Power Futures South Africa, 2020). The REIPPPP is a vehicle launched to
manage the tender process and to facilitate private sector investment in renewable energy to
the national grid (Eberhard & Naube, 2016). “South Africa continues to pursue a diversified
energy mix that reduces reliance on a single or a few primary energy sources” (IRP, 2019).
There is an opportunity for IPPs to enter the electricity generation market to capitalize on
Eskom’s weaknesses in the energy crisis. To offer an opportunity to IPPs and to acquire
assistance with electricity generation, Eskom has set up the Grid Access Unit (GAU) for
Independent Power Producers (IPPs) and generators.
The main objective of GAU is to create an entry for IPPs and generators to connect with
Eskom’s grid. This offers Eskom a sustainable solution to the energy crisis (Eskom, 2020). In
light of this, the Department of Energy offered mining companies permission to self-generate
electricity for their operations (South African Government News Agency, 2020). This move
comes to alleviate the disruptions caused by load shedding on mining companies. The country
needs an elevated response to the crisis with renewable energy sources and Independent Power
Producers offer that. At the beginning of 2020, the South African power sector had an installed
generation capacity of 56,392 MW and installed an IPP capacity of 5,492 MW with a peak load
of 34,256 MW (African Energy Reports, 2020).
20 | Page
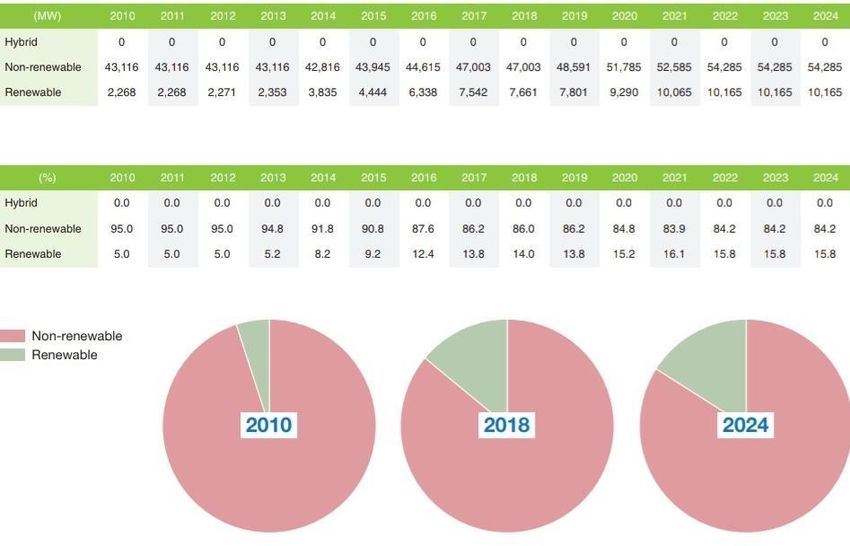
©Vindilac Analytics|2020Figure 8.1: Renewables vs Non-renewable
Source: (African Energy report, 2020)
Shown above is data reflecting off-grid capacity between 2010-2024. In detail, the above
reflects on the capacity of renewable and nonrenewable energy on the national grid. There is a
steady increase in renewable energy from 5,0% in 2010 to 15,8% in 2024. Translated as 2,268
MW in 2010 and 10,165 MW in 2024. Whereas there is a decline in nonrenewable energy
from 95,0% in 2010 to 84,2% in 2024. This comes in light of the growing demand for
renewable energy as a solution to the country’s energy crisis.
Investment in renewable energy is a long-lasting solution to the energy crisis in South Africa.
Current methods of production are not sustainable and power cuts cost the economy billions of
rands. To mitigate these issues, there should be a working relationship between the private
sector and government to scale the generation capacity of Independent Power Producers to
increase their impact on the national power grid. Licensing and funding of these producers
should be at the top of the agenda when addressing the energy crisis.
8.2.Tech (focus on Banking)
The need to digitalize the economy has offered vast opportunities to financial institutions.
Banking is one of the rapidly growing sectors in innovation and digitization. Lockdowns
offered banks and other financial institutions the opportunity to scale their digital platforms. In
a like manner, remote working and social distancing protocols have evoked new heights of
innovation. South African banks (i.e. Nedbank, Standard Bank, Absa and FirstRand) pursued
transformation in their remote banking services to adopt transformation programs that seek to
improve customer experience digital transformation and enterprise-wide cost reduction (PwC,
2020).
21 | Page
©Vindilac Analytics|2020“The future of banking in South Africa is dynamic and exciting. Agile new entrants with a
differentiated value proposition in a business model focused on the monetization of customer
insights will compete for head-on with universal banks reinvigorated by innovation strategies”
(PwC, 2020). New entrants offer a competitive edge and unlock new levels of innovation
consequently prompting large banks to scale their operations and introduce new sophisticated
banking services. Max Chuard from the World Economic Forum alludes that the Covid-19
pandemic has accelerated demands for new banking technologies and cost-cutting efficiencies
(World Economic Forum, 2020). Fourth Industrial Revolution, Covid-19 crisis and
introduction of the 5G network offer endless possibilities for business in the digital space to
scale to newer heights.
22 | Page
©Vindilac Analytics|2020Sources
Agarwal, P., Mulenga, M. C. (2020). Impact of Covid-19 on International Trade: Lessons from
African LCD's. Available at: https://www.unescap.org/sites/default/files/129%20Final-
Team%20Prachi%20Agarwal-India.pdf
African Energy Reports. 2020. South Africa Power Report 2020/21. www.africa-energy.com
Bureau of Economic Research. (2020). Business Confidence Index. Available at:
https://www.ber.ac.za/knowledge/pkviewdocument.aspx?docid=12718
BusinessTech. (2020). Some bright spots on South Africa's economic landscape. Available at:
https://businesstech.co.za/news/business/422534/some-bright-spots-on-south-africas-
economic-landscape/
Department of Energy. (2019). Integrated Resource Plan (2019). Department of Energy.
Department of Public Enterprises. (2020). DPE Finalising funding for SAA restructuring
process. Available at: https://dpe.gov.za/wp-content/uploads/2020/09/Dpe-finalising-funding-
for-saa-restructuring-process_V3-002.pdf
Eskom. 2020. Generating electricity.
https://www.eskom.co.za/AboutElectricity/ElectricityTechnologies/Pages/Generating_Electri
city.aspx
Eskom. 2020. Grid Access Unit for IPPs and generators.
https://www.eskom.co.za/Whatweredoing/Pages/Info_Site_For_IPPs.aspx
ESI Africa. 2020. Load-shedding forcing self-reliance and a move away from Eskom.
https://www.esi-africa.com/industry-sectors/generation/solar/loadshedding-forcing-
embedded-generation-and-a-move-away-from-eskom/
Eberhard, A & Naube, R. (2016). The South African Renewable Energy Independent Power
Producer Procurement Programme: A review and lessons learned.
http://www.scielo.org.za/scielo.php?script=sci_arttext&pid=S1021-447X2016000400001
ESI Africa. 2020. Women in energy means more clean energy for all across Africa.
https://www.esi-africa.com/industry-sectors/future-energy/women-in-energy-means-more-
clean-energy-for-all-across-africa/
Ceicdata. (2020). https://www.google.com/amp/s/www.ceicdata.com/en/south-
africa/banking-performance-indicator/banks-return-on-assets/amp
Fronda, A. (2020). What are circuit breakers in the stock market. Available at:
https://www.ig.com/za/news-and-trade-ideas/what-are-circuit-breakers-in-the-stock-market--
200313
Fallon, P. & Lucas, R., 2002. The impact of financial crises on labor markets, household
incomes,and poverty: A review of evidence. World Bank Research Observer, Vol.17, No.1,
pp. 21-46.
Fourie, F. (2018). Creating jobs, reducing poverty III: Barriers to entry and growth in the
informal sector – and business cycle vulnerabilities. Available at:
23 | Page
©Vindilac Analytics|2020https://www.econ3x3.org/article/creating-jobs-reducing-poverty-iii-barriers-entry-and-
growth-informal-sector-%E2%80%93-and-business
Horn, Z. (2010). The effects of the global economic crisis on women in the informal economy:
research findings from WIEGO and the Inclusive Cities partners. Gender and Development,
18(2), pp. 263-276.
International Labour Organization. (2004). Statistical definition of informal employment:
Guidelines endorsed by the Seventeenth International Conference of Labour Statisticians.
Available at: https://ilo.org/public/english/bureau/stat/download/papers/def.pdf
ITWeb. (2020). Banking in the future: five trends.
https://www.google.com/amp/s/amp.itweb.co.za/content/VJBwEr7nkeaM6Db2
Köhler, T. & Bhorat, H., 2020. COVID-19, Social Protection,and the Labour Market in South
Africa: Are social grants being targeted at the mostvulnerable? Available at:
https://cramsurvey.org/wp-content/uploads/2020/07/K%C3%B6hler-COVID-19-social-
protection-and-the-labour-market-in-South-Africa.pdf
Marais, H. (2009). The Impact of the Global Recession on South Africa. Retrieved from:
http://www.realinstitutoelcano.org/wps/portal/rielcano_en/contenido?WCM_GLOBAL_CON
TEXT=/elcano/elcano_in/zonas_in/cooperation+developpment/ari115-2009
PwC. (2020). https://www.pwc.co.za/en/publications/digital-disruption-in-sa-banking-
sector.html
Power Futures South Africa. 2020. Information Brief: Independent Power Producers.
www.powerfutures.org
Reinicke, C., 2020. US GDP slumped 4.8% in the first quarter, ending the longest economic
expansion on record. Available at: https://www.businessinsider.com/us-gdp-falls-first-quarter-
impact-coronavirus-economy-recession-economy-2020-4?IR=T
Rogan, M. & Skinner, C. (2020). The Covid-19 crisis and the South African informal economy:
‘Locked out’ of livelihoods and employment. Available at: https://cramsurvey.org/wp-
content/uploads/2020/07/Rogan-Covid-crisis-and-the-South-African-informal-economy.pdf
Statistics South Africa. (2020). Statistics of liquidations and insolvencies (Preliminary).
Available at: http://www.statssa.gov.za/publications/P0043/P0043August2020.pdf
Statistics South Africa. (2020). Tourist accommodation (Preliminary). Available at:
http://www.statssa.gov.za/publications/P6410/P6410July2020.pdf
SARS, 2020. SA Trade Statistics for August 2020.
Sonnichsen, N. (2020). Weekly crude oil prices for Brent, OPEC basket, and WTI 2019-2020.
Available at: https://www.statista.com/statistics/326017/weekly-crude-oil-prices/
South African Government News Agency. 2020. Government mulls allowing energy
generation for self-use. https://www.sanews.gov.za/south-africa/government-mulls-allowing-
energy-generation-self-use
24 | Page
©Vindilac Analytics|2020You can also read