Journal o f Transport Geography
←
→
Page content transcription
If your browser does not render page correctly, please read the page content below
Journal of Transport Geography 22 (2012) 164-178
C o n te n ts lis ts a v a ila b le a t S c iV e rs e S c ie n c e D ire c t
Journal o f T ransport Geography
ELSEVIER journal homepage: www.elsevier.com/locate/jtrangeo
Towards a new intermediate hub region in container shipping? Relay
and interlining via the Cape route vs. the Suez route
Theo E. Notteboom*
ITMMA - University of Antwerp, Kipdorp 59, BE-2000 Antwerp, Belgium
Antwerp Maritime Academy, Noordkasteel Oost 6, 2030 Antwerp, Belgium
A R T I C L E I N F O A B S T R A C T
Keywords: The Suez Canal plays a p iv o ta l ro le in today's global co n ta in e r s h ip p in g n e tw o rk , in p a rtic u la rly in accom
Container shipping m o d a tin g vessels sa ilin g on th e im p o rta n t A sia-E uro pe tra de lane. This p a per analyses to w h a t e x te n t and
Vessel routing fo r w h ic h tra de lanes th e Cape ro ute cou ld develop in to a c o m p e titiv e a lte rn a tiv e to th e Suez ro ute. The
Competition m a rk e t p o te n tia l o f th e Cape ro ute is analysed using a distance analysis, a tra n s it tim e analysis and a gen
Interlining
eralized cost analysis fo r a large set o f 0 /D re la tions. W e com pare vessel in te rlin in g via th e p o rt o f A lgec-
Suez Canal
iras w ith in te rlin in g v ia th e n e w p o rt o f N gqura in South A frica. The results sho w th a t th e Cape ro u te has
Cape
th e p o te n tia l to serve as an a lte rn a tiv e to th e Suez ro ute on 11 tra de lanes. A scenario and s e n s itiv ity anal
ysis reveals th a t in te rlin in g v ia a hu b near th e Cape is expected to becom e m ore c o m p e titiv e due to a
c o m b in a tio n o f h igh er Suez Canal tra n s it fees, b e tte r vessel econom ics, h ig h e r b u n k e r costs, slo w steam
in g practices and subject to a m ore c o m p e titiv e te rm in a l p ric in g stra tegy o f s ou thern A fric a n tra n s h ip
m e n t fa c ilitie s . The expected em ergence o f th e Cape ro u te sho uld be seen as th e e m b o d im e n t o f a
p ro m is in g de v e lo p m e n t o f s o u th -s o u th tra de volum es b e tw e e n Asia, Sub-Saharan A frica and S outh
A m erica.
© 2012 Elsevier Ltd. A ll rig h ts reserved.
1. Introduction M editerranean, to name b u t a few. The role o f interm ediate hubs
in m a ritim e hub-and-spoke systems has been discussed exten
From a n e tw o rk perspective, the location and fu n ctio n o f sively in recent lite ra tu re (see fo r instance Baird, 2006; Fagerholt,
te rm in a l facilities is not always guided by ce n tra lity vis-à-vis a 2004; Guy, 2003; McCalla et al., 2005). The hubs have a range o f
local/regional service area. Flem ing and H ayuth (1994) pointed com m on characteristics in term s o f nautical accessibility, p ro x im
o u t th a t interm ediate locations can emerge between origins and ity to m ain shipping lanes and ow nership, in w hole o r in part, by
destinations. W h ile the concepts o f ce n tra lity and interm ediacy carriers o r m u ltin a tio n a l te rm in a l operators. These nodes m u ltip ly
are not always clear-cut in practice, interm ediate nodes are added shipping options and im prove con ne ctivity w ith in the n e tw o rk
to a n e tw o rk w h en considered appropriate by the n e tw o rk opera th ro u g h th e ir pivotal role in regional hub-and-spoke netw orks
tors in v ie w o f overall performance o f the netw ork. Interm ediacy and in cargo relay and in te rlin in g operations between the carriers’
ty p ic a lly im proves the overall n e tw o rk con ne ctivity and service ea st-w est services and oth er in te r- and in tra -reg ion al services.
frequency, allow s be tte r use o f economies o f scale in transp ort Rodrigue and Notteboom (2010) argue th a t such interm ediate
equipm ent and generates a d ditiona l cargo handling in the netw ork. hubs in some cases go beyond a pure transfer fu n ctio n in the net
Interm ediacy has become increasingly prevalent in container w o rk th ro u g h processes o f foreland-based regionalization.
lin e r shipping. Container cargo is bundled by co m b in in g /lin kin g M ost o f the interm ediate hubs are located along the global b e lt
tw o o r more lin e r services th ro u g h the setting o f hub-and-spoke w ay o r equatorial ro u n d -th e -w o rld route (i.e. the Caribbean,
netw orks th a t rely on m ainline/feeder, relay and in te rlin in g a ctiv Southeast and East Asia, the M id dle East and the M editerranean).
ities in interm ediate hub term inals. Interm ediate hubs emerged Port sites situated close to strategic passage ways such as the
since the m id-1990s w ith in m any global po rt systems: Freeport Straits o f G ibraltar, the Suez Canal, the Panama Canal and the M a
(Bahamas), Salalah (Oman), Tanjung Pelepas (Malaysia), Gioia lacca Straits act as magnets on the developm ent o f transhipm ent,
Tauro, Algeciras, Taranto, Cagliari, D am ietta and M alta in the relay and in te rlin in g activities. W h ile the route via the Cape at
the southern tip o f the A frican con tine nt can also be considered
as a strategic passage way, at present it does not play a significant
* Address: ITMMA - University of Antwerp, Kipdorp 59, BE-2000 Antwerp,
Belgium. T el: +32 3 265 51 52/3 205 64 30; fax: +32 3 265 51 50. role in the global container shipping netw ork. The container port
E-mail address: theo.notteboom@ua.ac.be systems in countries like South Africa, M ozam bique, Nam ibia and
0966-6923/$ - see front m atter © 2012 Elsevier Ltd. All rights reserved,
doi: 10.1016/j.j trangeo.2012.01.003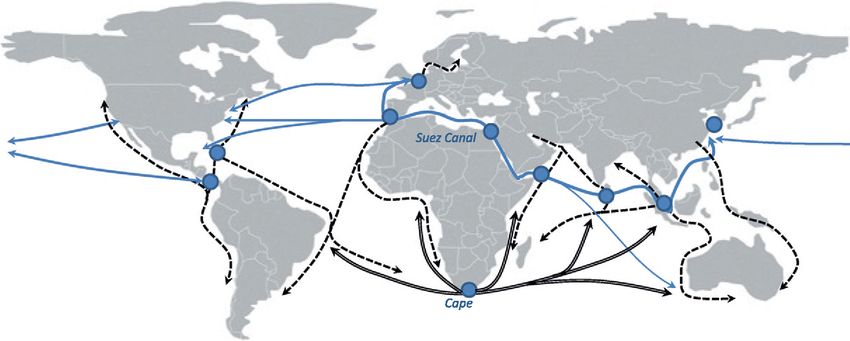
T.E. Notteboom /Journal o f Transport Geography 22 (2012) 164-178 165
the islands o f Madagascar and M au ritius are considered rem ote to M id dle East/Asia and Europe. This process has accelerated since
the m ain n e tw o rk and are served by a lim ite d num ber o f container the 1970s w hen significant scale increases in o il tankers and bu lk
carriers (m a in ly M aersk Line, MSC, MOL, Evergreen and CMA CGM). carriers coincided w ith m ajor upgrades o f the Suez Canal. The glo
There are no hub-and-spoke and re la y /in te rlin in g operations in the bal container shipping n e tw o rk n o w p rim a rily relies on the equa
region comparable to the ones found along the global beltw ay. The to ria l route in w h ich the Suez Canal is a key m a ritim e passage.
geographical location and the curre nt lim ite d cargo po tentia l o f 6852 container vessels transited the Suez Canal in 2010, an in
southern Africa seem to make the ports in the region no m atch crease o f 46% com pared to 2001. M ore than a th ird o f a ll vessels
fo r the tra d itio n a l re la y /in te rlin in g centres located at the cross using the Canal are container vessels (Table 2). About 646 m illio n
roads o f ea st-w est and n o rth -s o u th trade. As a result, tra n sh ip tons o f cargo passed via the Canal in 2010. Some 57% o f the cargo
m ent incidence in A frica was around 32% in 2008, b u t this is volum e is containerized (Table 3). Total container volum es reached
m a in ly the result o f the N o rth -A frican transh ip m ent hubs o f Port an estim ated 33 m illio n TEU in 2010 compared to 20 m illio n in
Said (transh ip m ent incidence o f 96.3%), Dam ietta (83.1%), Alessen- 2004. Nearly 93% o f these container flow s are related to the Eur-
dria (77.3%) and Tanger Med (99.1%). Africa, excluding these N orth ope-Asia trade routes. N o rth Am erica (East Coast)-Asia trade rep
A frican hubs, has a lo w transh ip m ent incidence o f o n ly 12% w h ich resents about 5.3% (figures Boston Consulting and Suez Canal
points to a po rt system w ith a w eak ‘in te rm ed iacy’ in the global A u th o rity).
container shipping netw ork. Im p o rta n t for this study is th a t the N o rth -S o u th and diagonal
Recent histo ry has show n th a t container shipping rem ains a trade lanes (e.g. N o rth Europe-W est Africa and N o rth Europe-
h ig h ly dynam ic m arket. Shippers and shipping lines are co n tin u South Am erica) are largely connected to the m ain be ltw a y via tra n
ously re-assessing the design o f th e ir shipping and d is trib u tio n shipm ent and in te rlin in g /re la y hubs such as Algeciras in Spain,
netw orks in search o f high cost efficiency, manageable risks and in Tanger M ed in Morocco and Port Said and D am ietta in Egypt.
creased ro u tin g fle x ib ility . Against this background, this paper In this paper we w ill analyze the m arket po tentia l o f the Cape
analyses to w h a t extent and fo r w h ich trade lanes in te rlin in g /re la y route by answ ering the fo llo w in g research question:
operations along the Cape route could develop in to a com petitive
W h a t is the curre nt and expected future m arket position o f
alternative to existing routes. W e p a rticu la rly zoom in on the po
interm ediate hub locations in southern A frica vis-à-vis in te rm e
te n tia l for ports in southern part o f Africa to serve as an alternative
diate hubs in the M editerranean fo r east-w est and n o rth -s o u th
to the m ain hubs on the ea st-w est shipping routes fo r attractin g
relay and in te rlin in g operations?
re la y /in te rlin in g business. This paper not on ly assesses the current
com p etitive position o f southern Africa in this respect, b u t also Fig. 1 gives a schem atic representation o f the m ethodology de
elaborates on the conditions th a t need to be m et in order to make ployed. The concept o f ‘m arket po sitio n ’ is made operational by
the Cape route a viable o p tion in container shipping networks. analyzing and com paring relative distances, tra n sit tim es and gen
In the firs t part o f this paper, we develop the research question eralized costs on a set o f o rig in -d e s tin a tio n relations. A firs t qu al
and a m ethodology to analyse route co m p e titio n between the Cape ita tive analysis o f the relevant routes to consider w h en com paring
route and the Suez route. Next, the results o f the route co m p e titio n the Cape route and the Suez route resulted in 14 relevant o rig in -
analysis are discussed. The paper concludes w ith a discussion on d e stination relations (Table 4). The choice o f the 14 routes w ill
key issues related to the com p etitive position o f the Cape route be fu rth e r substantiated in the distance and tra n sit tim e analyses.
vs. the Suez route. M ost o f the selected routes relate to shipm ents between W est A fri
ca and Asia and South Am erica and Asia.
2. Research question and methodology W e compare the Suez route and the Cape route by using pivotal
ports: the po rt o f Algeciras as a m ain transh ip m ent and in te rlin in g /
Over the last 50 years o r so, the developm ent and upgrading o f relay hub linked to the Suez route and the new po rt o f Ngqura in
the Suez Canal (Table 1 ) gradually underm ined the position o f the South Africa as a po tentia l transh ip m ent and in te rlin in g /re la y
route via the Cape as the do m in ant vessel route between the hub linked to the Cape route.
Table 1
Evolution o f the nautical characteristics o f the Suez Canal. Source: Own elaboration based on data Suez Canal Authority.
U nit 1869 1956 1962 1980 1994 1996 2001 2008
W idth at 11 m depth m 44 60 90 160 210 210 210 210
Maximum draft o f vessels feet 22 35 38 53 56 58 62 68
Overall length km 164 175 175 190.25 190.25 190.25 190.25 190.25
Doubled parts km - 29 29 78 78 78 78 78
W ater depth m 10 14 15.5 19.5 20.5 21 22.5 23.5
Max. tonnage o f vessel (DWT) ton 5000 30,000 80,000 150,000 180,000 185,000 210,000 210,000
Table 2
Key data on Suez Canal transit (absolute figures and growth compared to the previous year). Source: Based on Government o f Egypt and Suez Canal Authority.
Growth
2001 2002 2003 2004 2005 2006 2007 2008 2009 2010 2001-2010
Total crossing vessels 13,986 13,447 15,667 16,850 18,224 18,664 20,384 21,415 17,228 17,993 29%
-3.85% 16.51% 7.55% 8.15% 2.41% 9.22% 5.06% -19.55% 4.44%
Net tonnage (m illion tons) 456.1 444.8 549.4 621.2 671.8 742.7 848.2 910.1 734.5 846.4 86%
-2.48% 23.52% 13.07% 8.15% 10.55% 14.20% 7.30% -19.29% 15.23%
Number o f container vessels 4700 4549 5209 5928 6557 6974 7718 8156 6080 6852 46%
-3.21% 14.51% 13.80% 10.61% 6.36% 10.67% 5.68% -25.45% 12.70%
Total cargo volume (m illion tons) 372.4 368.8 457.9 521 571.1 628.6 710.1 723.0 559.2 646.1 73%
-0.97% 24.16% 13.78% 9.62% 10.07% 12.97% 1.81% -22.65% 15.54%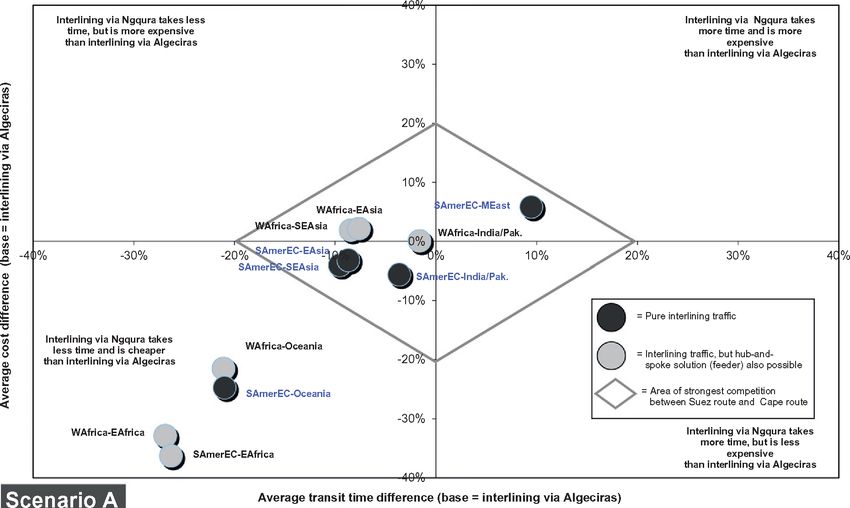
166 T.E. Notteboom /Journal o f Transport Geography 22 (20Í2) 164-178
Table 3
Cargo volumes transiting the Suez Canal and estimation o f TEU volumes. Source: Based on Government o f Egypt and Suez Canal Authority -estimates in TEU based on 1
TEU = 11 tons.
In m illion tons 2004 2005 2006 2007 2008 2009 2010
All cargoes
North to South 211.6 244.8 252.2 286.0 309.6 295.4 318.1
South to North 309.4 326.3 376.4 424.0 413.4 263.9 328.0
Total 521.0 571.1 628.6 710.1 723.0 559.3 646.1
Containerized cargo
North to South 108.3 119.0 126.1 141.4 156.0 149.7 179.7
South to North 112.0 128.1 150.8 177.1 188.0 159.2 187.3
Total 220.4 247.1 276.9 318.5 344.0 308.9 367.0
Share o f containerized cargo
North to South 51% 49% 50% 49% 50% 51% 57%
South to North 36% 39% 40% 42% 45% 60% 57%
Total 42% 43% 44% 45% 48% 55% 57%
Estimated loaded TEU in millions (1 TEU = 11 tons)
North to South 9.849 10.819 11.462 12.853 14.180 13.609 16.337
South to North 10.185 11.648 13.711 16.101 17.092 14.473 17.027
Total 20.034 22.467 25.173 28.953 31.271 28.082 33.364
Inputs:
Distance analysis Distance tables for routing via Algeciras
and via Ngqura (South Africa)
Inputs:
Transit time analysis Sailing times, dwell time at interlining terminal,
P ort-to-portbasis time at intermediate ports of call, canal transit
time, delays
Inputs:
Cost analysis Handling rates at interlining terminal, ship
C osts per TE U - operating costs, canal transit fees, port dues
perspective o f shipping line
Fig. 1. Sub-analyses in the route competition analysis.
Table 4
Identification o f relevant routes for the Cape route in competition w ith the Suez route.
North Africa (Maghreb)
US East Coast/Gulf
US West Coast
Southeast Asia
India/Pakistan
North Europe
Europe Med
Middle East
West Africa
East Africa
Carribbean
East Asia
Oceania
SAWC
SAEC
To
From
W est Africa I s l s s s s p p s S - Suez Canal now typically used
East Africa 1 S s s s s s p
North Africa (Maghreb s s s s p p s P = Panama Canal now typically used
India/Pakistan s s s s s
Southeast Asia s s S/P S/P S/P S/P = now via Suez Canal and/or Panama Canal
East Asia s s S/P S/P S/P
Middle East s s s s s S/P □ = trade route that does not represent a market
North Europe p p s for relay/interlining via the Cape
Europe Med p p s
Carribbean p p p □ = trade route that might represent a market
SAEC lii p p S/P for relay/interlining via the Cape
SAWC ill p
US East Coast/Gulf 1 p S/P
US W est Coast
Oceania
Note: SAEC = South America East Coast, SAWC = South America West Coast.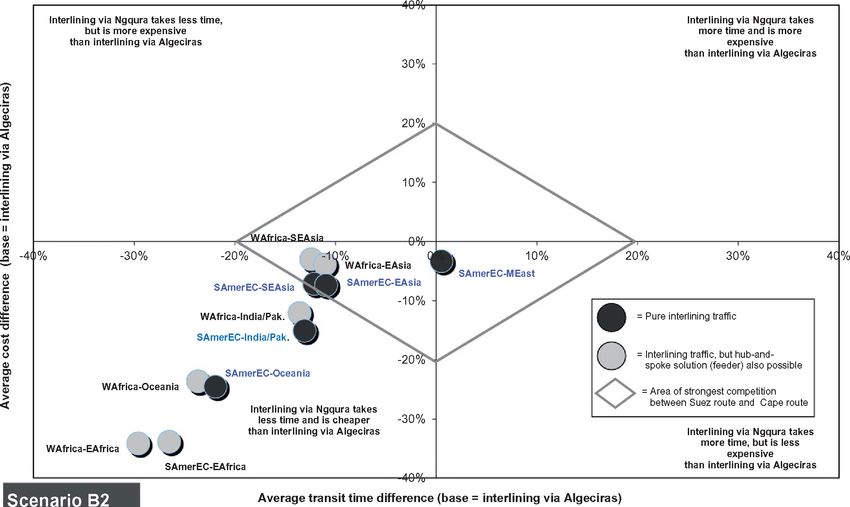
T.E. Notteboom /Journal o f Transport Geography 22 (20Í2) 164-178 167
The port o f Algeciras is a key te rm in a l fa c ility in the w o rld w id e transh ip m ent po in t between ea st-w est (m a in ly Europe-Asia) and
lin e r n e tw o rk o f Maersk Line fu n ctio n in g as a m ajor in te rlin in g and n o rth -s o u th container flow s (m a in ly from Europe to South Am er-
Table 5
Distance analysis - Cape route vs. Suez route (in nautical miles) (dataioy distance tables).
Position
From To via Suez via Cape Difference Cape
1. W est Africa East Africa Dakar-Muqdisho 5954 6505 551
Dakar-Maputo 7801 4728 -3 073 Favourable
Douala-Muqdisho 7942 5316 -2 626
Douala-Maputo 9789 3508 -6281
2. W est Africa India/Pakistan Dakar-Mumbai 6497 8240 1743
Dakar-Calcutta 8161 9126 965 Mixed
Douala-Mumbai 8486 7020 -1 466
Douala-Calcutta 10,150 7906 -2 244
3. W est Africa Southeast Asia Dakar-Singapore 8487 9255 768
Dakar-Kaohsiung 10,099 10,867 768 Mixed
Douala-Singapore 10,475 8035 -2 4 4 0
Douala-Kaohsiung 12,087 9647 -2 4 4 0
4. West Africa East-Asia Dakar-Shanghai 10,696 11,472 776
Dakar-Tokyo 11,389 12,157 768 Mixed
Douala-Shanghai 12,684 10,207 -2 477
Douala-Tokyo 13,377 10,937 -2 4 4 0
5. W est Africa Middle East Dakar-Jeddah 4163 8298 4135
Dakar-Dubai 6363 8418 2055 Weak
Douala-Jeddah 6151 7078 927
Douala-Dubai 8351 7198 -1153
6. W est Africa Oceania Dakar-Perth 9763 8464 -1299
Dakar-Auckland 12,830 11,320 -1 510 Very
Douala-Perth 11,751 7244 -4 507 favourable
Douala-Auckland 14,818 10,100 -4 718
7. East Africa SAEC Maputo-Georgetown (Guy.) 9658 6132 -3 526
Maputo-Buenos Aires 11,606 4809 -6 797 Favourable
Muqdisho-Georgetown 7811 7940 129
Muqdisho-Buenos Aires 9759 6617 -3 142
8. India/Pakistan SAEC Mumbai-Georgetown 11,967 9207 -2 7 6 0
Mumbai-Buenos Aires 10,303 8321 -1982 Favourable
Calcutta-Georgetown 10,019 10,530 511
Calcutta-Buenos Aires 11,967 9207 -2 7 6 0
9. Middle East SAEC Jeddah-Georgetown 6020 9702 3682
Jeddah-Buenos Aires 7968 8379 411 Weak
Dubai-Georgetown 8220 9822 1602
Dubai-Buenos Aires 10,168 8499 -1669
Table 6
Distance analysis - Cape route vs. routes via the Suez Canal and the Panama Canal (in nautical miles).
From To via Suez via Panama via Cape Difference Difference Position
Suez Panama Cape
10. Southeast Asia SAEC Singapore-Georgetown 10,344 12,119 10,659 315 -1 460
Singapore-Buenos Aires 12,292 16,042 9336 -2 9 5 6 -6 706 Favourable
Kaohsiung-Georgetown 11,956 10,534 12,271 315 1737
Kaohsiung-Buenos Aires 13,904 14,457 10,948 -2 9 5 6 -3 509
11. Southeast Asia East Coast/Gulf Singapore-New York 10,201 12,620 12,439 2238 -181
Singapore-Houston 11,762 12,212 13,165 1403 953 Weak
Kaohsiung-New York 11,813 11,035 14,051 2238 3016
Kaohsiung-Houston 13,374 10,627 14,777 1403 4150
12. East-Asia SAEC Shanghai-Georgetown 12,553 10,127 12,831 278 2704
Shanghai-Buenos Aires 14,501 14,050 11,508 -2 993 -2 542 Mixed*
Tokyo-Georgetown 13,246 9252 13,561 315 4309
Tokyo-Buenos Aires 15,194 13,175 12,238 -2 9 5 6 -9 3 7
13. SAEC Oceania Georgetown-Perth 11,620 12,709 9868 -1752 -2841
Georgetown-Auckland 14,687 8065 12,724 -1963 4659 Very favourable
Buenos Aires-Perth 13,568 16,632 8545 -5 023 -8 087
Buenos Aires-Auckland 16,635 11,988 11,401 -5 2 3 4 -5 8 7
14. East Coast/Gulf Oceania New York-Perth 11,477 13,210 11,648 171 -1 562
New York-Auckland 14,544 8566 14,505 -3 9 5939 Mixed
Houston-Perth 13,038 12,802 12,374 -6 6 4 -4 2 8
Houston-Auckland 16,105 8158 15,230 -8 7 5 7072
Favourable to Brasil, Argentina, Paraguay and Uruguay.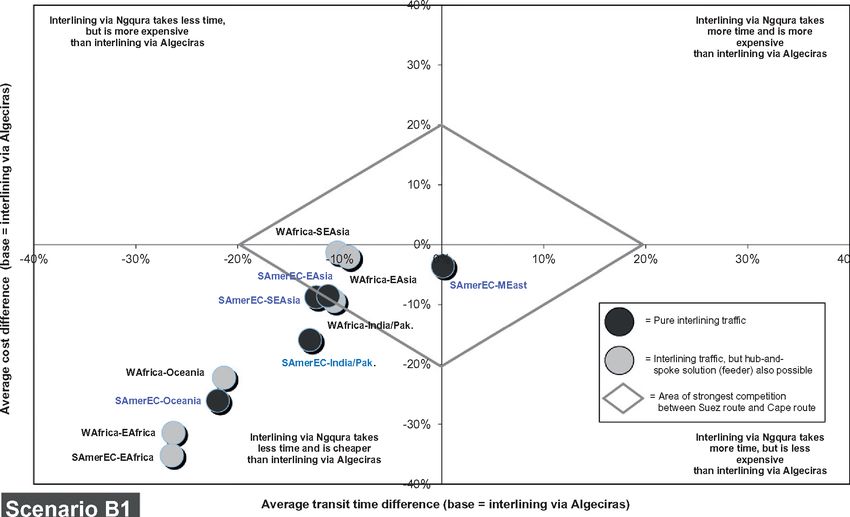
168 T.E. Notteboom /Journal o f Transport Geography 22 (20Í2) 164-178
Algecirass^ **'■------ •T o k y o
•Shanghai
•Kaohsiung
Mumbai
sue
M uqdisho nn j ¿ I* Singapore
^ M a p u to ,-^ '
J
Buem
Buenos Aires
Ngqura
Fig. 2. Base ports and example of distance comparison between Suez and Cape route.
ica East Coast and W est Africa). Algeciras is the 8th largest con favorable sailing distance pro file on the trade lanes W est A fric a -
ta in e r p o rt in Europe w ith a to ta l container th ro u g h p u t o f 2.8 m il East Africa, W est Africa-O ceania, East A frica-S o uth Am erica East
lio n TEU in 2010, compared to 1.5 m illio n TEU in 1998. It is an Coast, India/Pakistan-South Am erica East Coast, Southeast A sia-
alm ost pure transh ip m ent hub w ith a transh ip m ent incidence South Am erica East Coast and South Am erica East Coast-Oceania.
(hub-and-spoke and re la y /in te rlin in g ) o f 85%. Algeciras p a rticu On the oth er trade lanes the results are fa irly m ixed depending
la rly is a m ajor in te rlin in g hub for W est Africa w ith a volum e o f on the po rt o f o rig in o r destination. Routes 5, 9 and 11 give a poor
about 631,200 TEU in 2007 o f w h ic h 442,800 TEU southbound result for the Cape route. These three O/D routes w ill therefore not
and 151,200 TEU no rthbound (Dynam ar, 2008). The d is trib u tio n be considered in the tra n s it tim e and cost analyses fu rth e r in this
o f the container volum es o f Algeciras to /fro m W est Africa are esti paper.
m ated to consist o f 58% European volum es (N o rth W est Europe
42% and M editerranean 16%), 32% Asian cargo and 10% Am erican
4. Transit time analysis
cargo.
The p o rt o f Ngqura is located near Port Elisabeth on the East
In the tra n sit tim e analysis w e compare the tw o ro u tin g alterna
Coast o f South Africa. Notteboom (2010) dem onstrates th a t the
tives fo r the rem aining 11 o rig in -d e s tin a tio n relations. The transit
South A frican container p o rt system is a m u ltip le gateway system
tim e in hours on route k between a po rt o f o rig in and a p o rt o f des
w ith Durban as the d o m in ant gateway and Cape Tow n and Port
tin a tio n w ith n interm ediate ports o f call and an in te rlin in g opera
Elisabeth as tw o oth er gateway ports. The gateway ports are each
tio n at interm ediate hub u is defined as follow s:
serving a part o f the South A frican hinterland. None o f the ports in
the South A frican container p o rt system to date serves as a tra n d "
shipm ent te rm in a l in an extensive hub-and-spoke n e tw o rk o r as c ~ ~ ' ¿s y tp i • Z p i+ tp u + t sc
¡=1
in te rlin in g /re la y term in al. The tra n sh ip m e n t/in te rlin in g /re la y in c i
dence in South A frican ports is s till lo w b u t rising: fro m a modest w ith ds is the sailing distance on lin e r service route k (in nautical
18.2% o f to ta l container th ro u g h p u t in South A frican ports in 2007 m iles); vth e average sailing velocity o r speed (in knots); tpithe ‘no r
to 21.9% in 2011. Transhipm ent volum es are m a in ly concentrated m al’ po rt tim e (in h) at interm ediate po rt o f call i along lin e r service
in Durban (transh ip m ent incidence o f 20.2% in 2007 and 20.6% in route k\ tpu average d w e ll tim e o f the container (in h) at the in te r
2011) and new com er Ngqura (transh ip m ent incidence o f 52.2% lin in g hub po rt u; tsc the average tim e (in h) for Suez Canal transit;
in 2011). The curre nt transh ip m ent a c tiv ity is m a in ly in relation zs contingency factor representing the degree o f risk fo r an exten
to Tanzania, Namibia, Kenya and Angola (figures Transnet). The sion o f sailing tim e caused by chance such as heavy weather condi
p u b lic com pany Transnet operates a ll container term inals in the tions or mechanical failure (value > 1 ) . For example, a value o f 1.1
co u n try (via Transnet Port Term inals o r TPT) and also acts as p o rt indicates a 10% increase o f the ‘no rm al’ sailing tim e due to the fac
a u th o rity (via NPA) and controls a ll ra il fre ig h t business in the to r chance; zpi is the contingency factor representing the risk for
country. In the sum m er o f 2009, Transnet made several announce having abnorm al delays in po rt i caused by e.g. no berth available
ments th a t the new p o rt Ngqura w o u ld be positioned as a hub p o rt o r abnorm al w a itin g tim es fo r pilots o r tug boats (value > 1 ).
fo r South Africa. The firs t tw o container berths were opened in The above equation indicates the tra n s it tim e excludes the han
October 2009 as Phase 1. W o rk on the second tw o in Phase 2 is u n d lin g tim e at the po rt o f o rig in and the p o rt o f destination. As such
der w ay (Kernohan, 2009). Ind ustry experts endorsed Transnet’s we consider the to ta l tra n s it tim e between the departure fro m the
decision to select the p o rt o f Ngqura as a new shipping hub o f po rt o f loading and the arrival at the p o rt o f discharge. The transit
the country. Ngqura’s success depends on it becom ing an efficient, o f the Suez Canal tsc ty p ic a lly takes 14 h tra n sit tim e plus 4 h w a it
cost effective and w e ll serviced hub. ing tim e. Variables zs and zpi are included to incorporate risks
linked to the tim e factor (see also Notteboom , 2006 fo r a more
3. Distance analysis com prehensive analysis on the tim e factor in lin e r shipping ser
vices). The standard value fo r these variables is 1. Heavily con
Tables 5 and 6 give the com petitiveness o f the Cape route vs. the gested interm ediate ports o f call have a high value fo r zpi (in
Suez route based on a distance analysis in nautical miles. For each extrem e cases up to a value o f 4) w h ile routes characterized by fre
trade region tw o base ports were selected at bo th extremes o f the quent rough seas and heavy w eather w ill ty p ic a lly have a value for
region considered (Fig. 2). The Cape route has a favorable o r very zs o f between 1.05 and 1.2.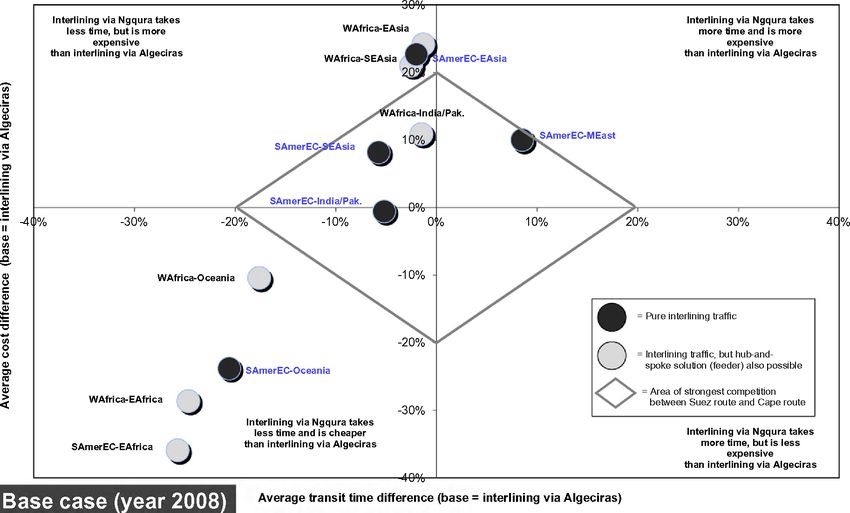
T.E. Notteboom /Journal o f Transport Geography 22 (20Í2) 164-178 169
In term s o f tra n s it tim es, in te rlin in g via the Cape route does of port o f W est Africa) to oth er parts o f the w o rld are m ostly better
fer advantages compared to in te rlin in g via Algeciras on m ost o f the o ff via the Suez route, w h ile shipm ents out o f m ore southern ports
routes considered (Fig. 3). The SAEC-Middle East route is the least in W est Africa (here Douala in Angola) are be tte r o ff if in te rlin in g
interesting w ith in some cases a tim e disadvantage for the Cape takes place in South Africa. This is in line w ith the conclusions o f
route o f up to 33%. Shipments out o f Dakar (m ost no rth ern m ajor the distance analysis.
R e g io n 1 R e g io n 2
Tokyo-Buenos Aires
Tokyo-Georgetown
East Asia
Shanghai-Buenos Aires
Shanghai-Georgetown
Buenos Ai res-Auckland
Buenos Ai res-Perth
Oceania
Georgetown -Auckland
Georgetown -Perth
Kaohsiung-Buenos Aires
Kaohsiung -Georgetown
Southeast
Asia Singapore-Buenos Aires
South
Singapore -Georgetown
America East
Coast Dubai-Buenos Aires
Du bai-Georgetown
Middle East
Jeddah-Buenos Aires
Jeddah -Georgetown
Calcutta-Buenos Aires
India/Pakista Calcutta-Georgetown
n
Mumbai-Buenos Aires
Mum bai-Georgetown
Muqdisho -Buenos Aires
Muqdisho -Georgetown
East Africa
Maputo-Buenos Aires
jyiaputo -Georgetown (Guy.)
Douala-Auckland
Douala-Perth
Oceania
Dakar-Auckland
Dakar-Perth
Doua la-Tokyo
Douala-Shanghai
East Asia Dakar-Tokyo
Dakar-Shanghai
Douala-Kaohsiung
Douala-Singapore
West Africa Southeast
Asia Dakar-Kaohsiung
Dakar-Singapore
Douai a-Calcutta
Douala-Mumbai
india/Pakista
Dakar-Calcutta
Dakar-Mum bai
Douala-Maputo
Douala-Muqdisho
East Africa
Dakar-Maputo
Dakar-Muqdisho
■ via Ngqura 0 5 10 15 20 25 30 35 40 45 50
□ via Algeciras T r a n s it tim e in d a y s
Fig. 3. Transit tim e analysis - Cape route vs. Suez route in days (port-to-port basis) w ith call interlining in respectively Ngqura and Algeciras.
170 T.E. Notteboom /Journal o f Transport Geography 22 (20Í2) 164-178
44 and m arine charges per TEU carried (in USD) for vessels x and y at
42 the in te rlin in g hub po rt u; ctu the to ta l tw o -w a y transhipm ent cost
per TEU (discharge plus loading) at in te rlin in g hub port u; cSC(X:y) is
40
> the one-w ay Suez Canal transit fee per TEU carried (in USD) fo r ves
sel size x o r y transiting the Suez Canal ( if applicable).
The to ta l bunker costs per trip depend on speed and vessel size.
In the analysis we used a bunker price o f USD 300 per to n for the
base scenario representing the situa tion in the firs t h a lf o f 2008
(N otteboom and V ernim m en, 2009). In scenario A the bunker price
am ounts to USD 500 per ton. For scenario BÍ we assumed USD
1000 per to n and slig h tly lo w e r average vessel speeds due to slow
steaming strategies o f container lines. The higher bunker prices are
n ot on ly the result o f expected higher fuel prices, b u t also a result
24
o f the new lo w su lfu r fuel requirem ents o f the International
M a ritim e O rganization (IM O) for global shipping. These regula
tions impose a reduction o f the m a xim u m su lfu r content in ship
16 17 18 19 20 21 22 23 24 25 fuel fro m 4.5% today (1.5% for the Emission Control Areas in n o rth
Vessel speed in knots Europe) to 3.5% by 2012 and even 0.1% fo r the ECAs by 2015 (see
also Notteboom , 2011). Scenario B2 represents the case o f super
• Singapore - Buenos Aires via - Singapore - Buenos Aires via slow -steam ing large vessels in cu rrin g high bunker costs o f USD
Algeciras Ngqura
1500 per ton.
Dakar-Shanghai via Algeciras - —— Dakar-Shanghai via Ngqura The values for ctu o r the rates fo r transh ip m ent containers
(in clu d in g discounts for larger volum es) for Ngqura were obtained
Fig. 4. Sensitivity analysis on transit times - examples on the impact o f slow
steaming on transit times - Singapore-Buenos Aires and Dakar-Shanghai. fro m the rate tables o f Transnet. The rates for Algeciras were
obtained via m arket info rm atio n. W e assume th a t te rm in a l rates
in scenarios A, B Í and B2 are the same fo r both ports b u t substan
Fig. 4 presents the results o f a se n sitivity analysis on the im pact tia lly higher than in the base case. W e also collected data on the
o f vessel speed on tra n s it tim es for tw o p o rt-to -p o rt routes: Singa- applicable cargo dues and p o rt dues at the in te rlin in g hubs. T erm i
pore-Buenos Aires (Southeast Asia-SAEC) and Dakar-Shanghai nal efficiency gains are expected to decrease the average container
(W est Africa-East Asia). The change in the vessel speed v, for d w e ll tim es at the in te rlin in g term inals from 2.5 days in the base
exam ple by in tro d u cin g slow steaming, seems to have on ly a m a r case to 2 days in the oth er scenarios. The cost m odel does not
ginal im pact on the gap in tra n s it tim es between the ro u tin g via include p o rt dues and te rm in a l handling costs at interm ediate
Algeciras and Ngqura (Fig. 4). ports o f call on the route and at orig in /d e stin a tio n ports.
The typica l Suez Canal tra n s it fees per vessel type fo r the base
scenario are presented in Table 8. The tra n s it rates are established
5. Cost analysis
by the Suez Canal A u th o rity (SCA). They are com puted to keep the
canal tra n s it fees attractive to shippers.1 SCA charges ships based on
W e develop a cost m odel to compare the tw o ro u tin g alte rna
tives for 11 trade lanes and 44 o rig in -d e s tin a tio n relations. The th e ir volum etric cargo carrying capacity. To capture revenue for con
cost m odel is applied to fou r scenarios in v ie w o f dem onstrating tainers abovedeck, the Canal m aintains a surcharge on tolls based on
the num ber o f tiers o f boxes. For example, an average sized Panamax
the c om p etitive position o f in te rlin in g via the Cape route under d if
ferent operational conditions (Table 7). The base scenario repre containership w ith five tiers abovedeck w ill pay a 10% surcharge on
its net tonnage fee. The average canal transit fee per TEU (at 90% ves
sents the situ a tio n fo r 2008 w h ile A, BÍ and B2 refer to like ly
scenarios for the next 10 years. These scenarios fo r the future sel u tiliza tio n ) in the base scenario amounts to 102 USD for a vessel
assume a.o. a fu rth e r scaling up o f vessel sizes on the various o f 1000 TEU down to 56 USD for the largest container vessels. The
Suez tonnage per container vessel size was obtained by perform ing
routes com bined w ith slow steaming strategies o f shipping lines.
Scenario B2 is a va ria tio n on scenario BÍ characterized by very high a linear regression analysis on the relationship between the Suez
Canal Net Tonnage (SCNT) and the vessel capacity in TEU using the
bunker costs and super slow steaming.
The cost m odel specification is as follow s. The to ta l cost per TEU Fairplay ship database (K-square o f 0.9861). The sample dataset con
carried (in USD) on route k between a p o rt o f o rig in and a po rt o f tained around 100 vessels.
destination w ith n interm ediate ports o f call, an in te rlin in g It is expected th a t the average Suez Canal tra n s it w a itin g tim e
operation at interm ediate hub u and the deploym ent o f vessel size w ill increase in the future due to capacity constraints in term s o f
num ber o f transits per day com bined w ith peaks in vessel arrivals.
X sailing to u and vessel size y sailing from u is calculated as
follow s: W e assumed an average w a itin g tim e o f 4 h in the base scenario,
14 h in scenario A and 24 h in scenarios B Í and B2. The Suez Canal
Ck(X,y) = (Ccx + Cb x i x (( ■t X ¡I + (Cry + C¡)y ) y ,1 ■ ty II + Cpu¡Xy + CtU + C f Ix y A u th o rity is lik e ly to raise tolls. Factoring in bo th the o p p o rtu n ity
w ith fx^ uis the transit tim e (in days) using vessel size x between the
p o rt o f origin and an in te rlin in g operation at interm ediate hub u, 1 In fiscal year 2008, Egypt earned USD 5 billion in canal fees (USD 4.6 billion in the
previous year) making it Egypt’s third largest revenue generator after tourism and
includ in g interm ediate ports o f call; ty^ u the transit tim e (in days)
remittances from expatriate workers. SCA has been steadily raising Suez transit fees
using vessel size y between an in te rlin in g operation at interm ediate at a rate oi3-7% between 2005 and mid 2008. February 2005 saw an increase of 3%, a
hub u and the port o f destination, including interm ediate ports o f first general increase in fees in 9 years. Fees increased by 7.1% in 2008. In early 2009
call; ccx the daily charter rate per TEU carried by vessel size x (in SCA announced an indefinite freeze on transit fees as a result of the global downturn
USD); c¡¡x the da ily bunker cost per TEU carried by vessel size x at and the Somali piracy crisis. Suez Canal fee revenues fell to USD 1.1 billion in the first
quarter of fiscal year 2009/2010 compared to USD 1.5 billion in the same period of the
average sailing speed v\ ccy the da ily charter rate per TEU carried
previous fiscal year (minus 24%). The number of ships passing through the canal is
by vessel size y (in USD); cj¡¡, the da ily bunker cost per TEU carried expected to decline by 7% in 2009. The Suez Canal Authority decided therefore to keep
by vessel size y at average sailing speed w ; cpU(Xi3,) the to ta l port dues its transit fees unchanged (SCA press statement, 5 January 2009).
T.E. Notteboom /Journal o f Transport Geography 22 (2012) 164-178 171
Table 7
Average vessel sizes (x, y), bunker cost and transhipment cost ctu for the 4 scenarios. Source: own elaboration based on Drewry, Dynamar and ASX Alphaliner data.
Base scenario Scenario A Scenario BÍ Scenario B2
via Suez via Cape via Suez via Cape via Suez via Cape via Suez via Cape
(Algeciras) (Ngqura) (Algeciras) (Ngqura) (Algeciras) (Ngqura) (Algeciras) (Ngqura)
Vessel size x, y (capacity in TEU)
South America East coast 3900 2900 4800 3800 5500 4900 5500 4900
East Asia 6900 3100 8700 5100 10,000 6300 10,000 6300
Southeast Asia 7800 3100 10,500 5100 11,500 6300 11,500 6300
Oceania 2900 1900 3500 2700 4200 3500 4200 3500
Middle East 3500 2100 4500 3000 5000 3500 5000 3500
India/Pakistan 4000 2000 4400 2900 4900 3500 4900 3500
West Africa 1900 900 2500 1700 2800 2200 2800 2200
East Africa 1500 1300 1900 1900 2300 2500 2300 2500
Bunker cost per ton (in USD) 300 300 500 500 1000 1000 1500 1500
Transhipment cost per TEU cm (in USD) 95 110 120 120 140 140 140 140
Table S
Estimated transit fees for a single transit via the Suez Canal (fees for April 2008). Source: own elaboration based on transit fee tables of SCA
TEU- Typical Canal transit fees Net tonnage fee Fee on-deck containers Per TEU (full Per TEU 90% Per TEU 60%
capacity SCNT* (USD) (USD) (USD) vessel) utiliz. utiliz.
1000 8727 91,999 87,618 4381 92.0 102.2 153.3
1500 14,210 130,762 123,360 7402 87.2 96.9 145.3
2000 19,693 168,141 157,141 11,000 84.1 93.4 140.1
3000 30,659 221,403 205,002 16,400 73.8 82.0 123.0
4000 41,625 271,939 251,796 20,144 68.0 75.5 113.3
6000 63,557 373,589 339,627 33,963 62.3 69.2 103.8
8000 85,489 455,770 414,336 41,434 57.0 63.3 95.0
10,000 107,421 536,782 483,588 53,195 53.7 59.6 89.5
13,000 140,319 654,455 584,335 70,120 50.3 55.9 83.9
Suez Canal net tonnage = 10.966 n TEU-capacity - 2238.7 (fi-square = 0.9861).
fo r cyclical changes in the SDR/dollar rate (the fees are expressed in the Suez route economies o f scale advantages, and differences in
Special D raw ing Rights o r SDR) and the expectation o f several po rt costs given th a t the pricing o f transh ip m ent cargo in South
nom inal to ll increases, the average effective to ll per TEU is lik e ly Africa is less com p etitive compared to Algeciras. The above effects
to increase by 5% per year t ill 2015, and w ith 3% per year between make th a t the a d ditiona l costs related to the tra n sit o f the Suez
2015 and 2020 (Johns and Associates, 2005). These increases are Canal are m ore than counterbalanced by savings on vessel costs
absorbed in scenarios A, B Í and B2. and p o rt costs.
Figs. 5 -8 present the results fo r the base case and the three U nder scenario A, the cost gap between the Suez route and the
future scenarios using tw o axes: the average tra n sit tim e difference Cape route is m uch smaller. In te rlin in g via Ngqura has the poten
between the Cape route and the Suez route and the cost difference tia l o f becom ing the low est cost o p tio n for 30 o f the 44 o rig in -d e s
between the Cape route and the Suez route (p o rt-to -p o rt basis). tin a tio n relations considered. In scenario BÍ and B2 this figure
The percentage values per trade route were obtained by averaging am ounts to 34 O/D relations. In the base case, in te rlin in g via the
the O/D relations per trade route listed in Tables 5 and 6. In both Cape was the best o p tio n fo r on ly 23 o f the 44 routes. The routes
cases a negative percentage indicates an advantage fo r in te rlin in g fro m /to Southeast Asia and East Asia, w h ic h were problem atic for
via the Cape route. the Cape route in the base case, show m uch m ore po tentia l in sce
In term s o f the costs, in te rlin in g via the Cape at the p ricing lev nario A. The trade lane from South Am erica East Coast to East Asia
els and vessel sizes o f the base case w o u ld be more expensive than evolves fro m a 12% to 36% cost disadvantage fo r in te rlin in g via the
in te rlin in g via Algeciras on m ost o f the routes considered. In te rlin Cape in the base case to a -13% to +7% cost difference in scenario A,
ing via Ngqura is on ly com petitive on the routes W est A frica-East -19% to plus 1% in scenario BÍ and -18% and plus 3% in scenario
Africa, SAEC-East Africa and SAEC-Oceania. The m ost problem atic B2. The W est A frica-E ast Asia route sees the cost difference evolve
routes are linked to Southeast Asia and East Asia: from +6%/+42% in the base case to -12%/+16% in scenario A, -14% /
+9% in scenario B Í and -16%/+7% in scenario B2. The Cape route
• SAEC-East Asia: 12-36% cost disadvantage for in te rlin in g via im proves its position on the shipping lanes between the South
the Cape (depending on O/D relatio n considered). Am erican East Coast to Southeast Asia to reach a cost difference
• W est Africa-E ast Asia: 6-42%. o f -16% to +7% in scenario A, -21% to 3% in scenario BÍ and
• W est Africa-SE Asia: up to 41% cost disadvantage. -20%/+5% in scenario B2. Also from W est Africa to Southeast Asia
the Cape route becomes an interesting alternative (fro m up to
The above conclusions are problem atic given th a t the flow s to/ +41% cost disadvantage in the base case to -1 5 /+ 1 8 in scenario
fro m Asia are the thickest. W h ile the tra n sit tim e analysis was A, -1 6 /+ 1 2 in scenario B Í and -1 8 /+ 1 0 in scenario B2). The Cape
qu ite favourable for in te rlin in g via Ngqura, the cost analysis seems route no w becomes even m ore com petitive on the shipping
to reverse m any o f the tra n sit tim e results. The m ain reasons for connections between W est A frica and East A frica (i.e. a cost advan
the weaker cost position o f the Cape route relate to clear d iffe r tage o f up to 54% in scenarios B Í and B2), SAEC-East Africa (cost
ences in vessel scales (see base scenario in Table 7) w h ic h give advantage ranging from 10% to 55% in scenarios B Í and B2) and
172 T.E. Notteboom /Journal o f Transport Geography 22 (20Í2) 164-178
-30%-
Interlining via Ngqura takes Interlining via Ngqura takes
less time, but is more
than interlining via Algeciras than interlining via Algeciras
c/5
CO
Ü
05
05
<
CO
>
u
c>
c
«
-40% -30% - 20 % - 10% 10% 20% 30%
< between Suez route and Cape route
-30%
Interlining via Ngqura takes
less time and is cheaper Interlining via Ngqura takes
than interlining via Algeciras more time, but is less
than interlining via Algeciras
------------------------------ 4Q%-1---------------------------------------
A ve rag e tra n s it tim e d iffe re n c e (base = in te rlin in g v ia A lg e c ira s )
Base case (year 2008)
Fig. 5. Competition between the Suez route and the Cape route based on transit tim e and costs (port-to-port basis) - base case 2008. Note: WAfrica = West Africa,
EAfrica = East Africa, SAmerEC = South America East Coast, India/Pak. = India/Pakistan, MEast = Middle East, EAsia = East Asia, SEAsia = Southeast Asia.
Interlining via Ngqura takes less Interlining via Ngqura takes
time, b u tis more expensive more time and is more
than interlining via Algeciras expensive
than interlining via Algeciras
30% -
o
CD
05 20%
<
.2
>
05
C
c 10 % -
05 >AmerEC-MEast
C WAfrica-EAsia
tfrica-S EAsia
WAfrica-lndia/Pak.
05
■o%
_20% ^A m erE C -E A s[i
1 -40% -30% 10% 20% 30%
SAmerbfiçS EAsia
05 SAn erEC-lndia/Pak.
O
C
0) - 10% -
0)
= Pure interlining traffic
C/5 Interlining via Ngqura takes
O
o less time and is cheaper WAfrica-Oceania
= Interlining traffic, but hub-and-
05 than interlining via Algeciras -20^ spoke solution (feeder) also possible
05
2
0) SAmerEC-Oceania = Area of strongest competition
< between Suez route and Cape route
-30%
WAfrica-EAfrica Interlining via Ngqura takes
more time, but is less
SAmerEC-EAfrica expensive
than interlining via Algeciras
----------------------------------- 40%-J---------------------------------------------
Scenario A A v e ra g e tra n s it tim e d iffe re n c e (base = in te rlin in g v ia A lg e c ira s )
Fig. 6. Competition between the Suez route and the Cape route based on transit time and costs (port-to-port basis) - cost model estimation for scenario A.
SAEC-Australia (15-36% cost advantage in scenarios BÍ and B2). 6. Conditions for interlining/relay via a hub near the Cape route
The overall absolute costs do not increase very sig nifica ntly as
the increased bunker costs and o th e r cost increases in scenarios Under scenarios BÍ and B2, tw o scenarios th a t are strongly
B Í and B2 are p a rtly compensated by scale increases in vessel size based on increases in vessel scale, high bunker costs and slow
and slow steaming practices. steaming practices, in te rlin in g via the Cape clearly outperform s
T.E. Notteboom /Journal o f Transport Geography 22 (2 0 Í2 ) 164-178 173
Interlining via Ngqura takes less time, Interlining via Ngqura takes
b ut is more expensive more time and is more
than interlining via Algeciras expensive
than interlining via Algeciras
30%
t/5
E
'o
0)
U) 20%
<
.2
‘>
U)
c
'c 10 % -
05
C
WAfrica-S EAsia
a) «
1 -40% -30% -20 % 10% 20% 30%
a> SAmehSQ-EAsia wAfrica-EAsia
SAmerEC-MEast
u
c
0) SAmerEC-S EAsia - 10 %
a>
= Pure interlining traffic
WAfrica-lndia/Pak.
V)
o
o SAmerEC-India/Pak. = Interlining traffic, but hub-and-
- 20 ° /
a> WAfrica-Oceania spoke solution " aiso possible
a) SAmerEC-Oceania = Area of strongest competition
< between Suez route and Cape route
-30% -
WAfrica-EAfrica Interlining via Ngqura takes Interlining via Ngqura takes
less time and is cheaper more time, but is less
SAmerEC-EAfrica than interlining via Algeciras expensive
than interlining via Algeciras
----------------------- 404^ ------------------------------
A v e ra g e tra n s it tim e d iffe re n c e (base = in te r lin in g v ia A lg e c ira s )
Scenario B1
Fig. 7. Competition between the Suez route and the Cape route based on transit tim e and costs (port-to-port basis) - cost model estimation for scenario BÍ.
Interlining via Ngqura takes less time, Interlining via Ngqura takes
but is m ore expensive more time and is more
than interlining via Algeciras expensive
than interlining via Algeciras
30%
t/5
ra
o
_C5 20%
<
CO
■>
05
c
'c 10%
c
ÍA frica-S E A sia
1 -40% -30% -20% 10% 20% 30%
WAfrica-EAsia
SAmerEC-MEast
o SAmerEC- EAsia
c SAmerEC-S EAsia
- 10 %
WAfrica-lndia/Pak. = Pure interlining traffic
c/5 SAmerEC-India/Pak.
o
o - 20° /
= Interlining traffic, but hub-and-
spoke solution................
also possible
u¡ SAmerEC-Oceania
to
ai WAfrica-Oceania = Area of strongest competition
>
< between Suez route and Cape route
Interlining via Ngqura takes
less time and is cheaper -30%
than interlining via Algeciras Interlining via Ngqura takes
WAfrica-EAfrica
JJ SAmerEC-EAfrica
more time, but is less
expensive
than interlining via Algeciras
------------------------------------40% ----------------------------------------------
A v e ra g e tra n s it tim e d iffe re n c e (b a se = in te r lin in g v ia A lg e c ira s )
Scenario B2
Fig. 8. Competition between the Suez route and the Cape route based on transit time and costs (port-to-port basis) - cost model estimation for scenario B2.
the Suez route on the routes W est Africa-O ceania, W est A fric a - tim e differences between the tw o in te rlin in g options are sm all so
East Africa, South Am erica East Coast-Oceania and South Am erica th a t intense c o m p e titio n between the tw o routes can be expected.
East Coast-East Africa. A ll oth er routes w ill be positioned w ith in The actual po sitio nin g o f in te rlin in g via the Cape compared to the
and close to the com p etitive range, i.e. the cost differences and Suez route w ith in this com petitive range w ill be m ainly174 T.E. N otteboom /Journal o f Transport Geography 22 (2012) 164-178
determ ined by an in te rplay o f forces w h ich eith e r relate to clear the global coverage o f th e ir respective lin e r service networks.
threats to the d o m in ant po sitio n o f the Suez route (see section 7) The developm ent o f in te rlin in g /re la y business near the Cape de
o r weaknesses o f and challenges to the Cape route. mands a targeted strategy on the m ain shipping lines in the region.
These carriers w ill have to be able to generate a critica l mass so
6.1. A vailability o f ship services th a t co n n e ctivity between several deepsea services at an accept
able frequency and lo w in-betw een tim e is possible. Given the re
Shipping lines value the a va ila b ility o f a range o f ship services. sults o f the distance analysis, the desired carrier(s) should have a
W h ile nautical services often appear where new po rt a c tiv ity takes strong pro file w ith respect to lin e r services in relatio n to the east
place, the com petitiveness o f the Cape route in a ttra ctin g in te rlin coast o f South Am erica and W est Africa. The firs t m ajor tra n sh ip
ing/relay business w ill depend on the existence o f one o r more m ent hub in the region is lik e ly to benefit fro m firs t m over advan
hubs w h ich offer a fu ll range o f ship chandling services, bunker tages compared to po tentia l com peting hubs th a t m ig h t emerge
services and extensive ship repair facilities. Supply o f such services later. E arly-m over advantages are m a in ly caused by the high con
in southern A frican ports is expected to rem ain rathe r lim ite d com n e ctivity early adopters can develop in term s o f supply and fre
pared to the m ajor re la y /in te rlin in g node Singapore, b u t is com pet quency o f lin e r services callin g at the port.
itiv e compared to oth er transh ip m ent hubs such as Freeport
Bahamas, Kingston (Jamaica), Algeciras, and Jeddah. 6.4. Low cost
6.2. Cargo availability The revenue per container move in in te rlin in g and tra n sh ip
m ent - w h ic h entails bo th a discharge and a loading - is generally
Having a local cargo base is a strength. It allow s to com bine the lo w e r than achieved in the im p o rt/e x p o rt sector. Thus, i f there is a
re la y /in te rlin in g fu n ctio n w ith a gateway function. Compared to is straight choice between these tw o sectors, te rm in a l operators ty p
land locations (cf. M au ritius and Madagascar), the South African ica lly seek to m axim ize revenue by focusing on im p o rt/e xp o rt
ports give the advantage o f generating a large gateway tra ffic as flow s at the expense o f transhipm ent. Significantly, i f there is a
w e ll am o un ting to above 3 m illio n TEU in 2010. This m ig h t make shortage o f capacity then these pressures w ill intensify. However,
the re la y /in te rlin in g business th a t m ig h t develop in a South African the cost involved in developing a tra n s h ip m e n t/in te rlin in g hub is
hub less ‘footloose’. in varia bly less than p ro vid ing the same scale o f fa c ility at a port
w h ic h is largely dependent on land access. This im plies th a t any
6.3. M arket structure hub in southern Africa is challenged to keep te rm in a l operating
costs and p o rt dues low.
The po rt hierarchy is determ ined by the decisions o f in d ivid u a l
container shipping lines (operating as independent carriers o r in
6.5. High reliability
groupings). The decisions o f these lines regarding the hierarchy
o f the ports o f call is rarely identical. Hence, a po rt m ay fun ction
The sm ooth synchronization o f deepsea services requires a high
as a regional hub fo r one lin e r operator and as a feeder po rt for an
schedule in te grity. R e lay/in terlinin g business depends a lo t on high
o th e r (Table 9). In te rlin in g /re la y o n ly takes place between services
re lia b ility. This factor can even o u tw eigh tra n sit tim e as such.
o f the same carrier o r carrier com b in ation (e.g. strategic alliances
such as the G6 Alliance and the CYKH-alliance). These carriers o f
ten rely on a dedicated te rm in a l to com bine gateway, hub-and- 6.6. Vessel size and draft conditions
spoke and in te rlin in g /re la y traffic. The carrier involved in in te rlin
ing/relay business is often the d o m in ant player in the port. A good Any hub along the Cape route should be able to accommodate
exam ple is MSC in A n tw e rp w h ich handled approxim ately h a lf o f large vessels and offer a fast vessel turna rou nd (high te rm in a l
the to ta l container th ro u g h p u t in A n tw e rp on its dedicated MSC p ro d u ctivity, high crane density). M ajor tra n s h ip m e n t/in te rlin in g
Home Term inal. Maersk Line is by far the d o m in ant player in term inals around the w o rld offer a d ra ft o f at least 14 m (Table 10).
Algeciras, Tanjung Pelepas and Salalah, p a rtly because o f the In Africa, on ly few ports offer such d ra ft conditions. O pportunities
involve m en t o f sister com pany APM Term inals in te rm in a l opera should thus be created for shipping lines to fu rth e r increase the
tions. European shipping lines such as M aersk Line, MSC and vessel size deployed for relay activities in the A frican po rt system
CMA CGM have the strongest focus on re la y /in te rlin in g due to (d ra ft o f at least 14 m).
Table 9
Main transhipment hubs of the top ten container shipping lines. Source: own elaboration based on carrier information.
Northern Europe Med Middle East/ Southeast Asia Far East Central America
Indian
sub-continent
Main transhipment hubs o f the top 10 carriers
Maersk Rotterdam/Bremerhaven/ Algeciras/Port Said/Gioia Salalah/Dubai Tanjung Pelepas/ Kaohsiung/Yantian Balboa/Kingston/
Zeebrugge Tauro Singapore MIT
MSC Antwerp/Le Havre/Bremerhaven Valencia/Las Palmas Dubai/Jeddah Singapore Ningbo/Busan Freep ort/
Manzanillo
CMACGM Rotterdam/Zeebrugge/Hamburg Marsaxlokk/Damietta Khorfakkan Port Klang Ningbo/Chiwan MIT/Kingston
Hapag-Lloyd Rotterdam/Hamburg Gioia Tauro/Damietta Dubai Singapore Kaohsiung MIT
Cosco Rotterdam/Hamburg Port Said West/Naples Dubai Singapore
China Rotterdam/Hamburg Port Said East/Barcelona Port Klang Yantian MIT
Shipping
Evergreen Rotterdam/Hamburg Taranto/Port Said West Dubai Tanjung Pelepas Kaohsiung CCT
APL/NOL Rotterdam/Hamburg Dubai/Salalah Singapore Kaohsiung/Hong MIT/Balboa
Kong
Hanjin Rotterdam/Hamburg Port Said West Khorfakkan Singapore Busan/Hong Kong
NYK Rotterdam/Hamburg Gioia Tauro/Damietta Dubai Kaohsiung MITT.E. Notteboom /Journal o f Transport Geography 22 (2012) 164-178 175
Table 10
Draft in ports around the world (in m). Source: Own elaboration.
Draft at some major transhipm ent/interlining hub terminals Draft at African ports
Port Country Max berth depth (m) Main shipping line Port Max berth depth (m)
Mediterranean
Algeciras Spain 16.0 Maersk Line Durban 16.0
Marsaxlokk Malta 15.5 CMA CGM Cape Town 14.0
Gioia Tauro Italy 15.0 - Ngqura 16.5
MITH-Cagliari Italy 14.0 - Port Elizabeth 12.2
Sines Portugal 17.0 MSC
Taranto Italy 16.0 Evergreen Tema 11.5
Port Said Egypt 16.0 Maersk Line Abidjan 11.5
Mombasa 11.0
Northern Europe Dar Es Salaam 10.5
Home Terminal Antwerp Belgium 15.0 MSC Reunion 14.5
APM TZeebrugge Belgium 15.0 Maersk Line Walvis Bay 11.5
APM T Rotterdam Netherlands 16.7 Maersk Line Luanda 12.8
NST - Bremerhaven Germany 15.0 Maersk Line Douala 10.5
Alterwerder Hamburg Germany 14.5 - Djibouti 12.0
Maputo 11.5
Middle East Mauritius 14.0
Aden Yemen 16.0 -
Salalah Oman 16.0 Maersk Line
Caribbean and South America
Manzanillo Panama 13.0 -
Free port Bahamas 16.0 -
Sepetiba Brasil 18.5 -
Asia
Colombo Sri Lanka 16.0 -
Tanjung Pelepas Malaysia 16.0 Maersk Line
Kitakyushu Japan 15.0 -
Gwangyang South Korea 15.0 Hanjin/HMM
Notes: A deepening program in Durban completed in 2010 increased the harbor entrance from 110 m to 225 m, deepening the outer channel to 19 m and the inner channel
from 12.2 m to 16 m. Mauritius w ill be dredged to 14.5 m.
6.7. Logistics factors shippers and m ig h t thus benefit the fu tu re position o f the Cape
route.
R e lay/in terlinin g tra ffic is in essence linked to the decisions o f First o f all, the recent wave o f piracy acts has generated great
the shipping line w ith regard to lin e r service n e tw o rk op tim iza tion. concern am ong shipping lines and cargo owners (Mo, 2002). The
R e lay/in terlinin g does in princip le not take place because o f ship num ber o f reported attacks near Somalia and in the G u lf o f Aden
pers’ requirem ents. However, the po sitio n o f a hub fo r re la y /in te r increased fro m o n ly 10 in 2006 to 111 in 2008 and 199 in the first
lin in g tra ffic can im prove and become less vulnerable w hen the 9 m onths o f 2011 (figures o f the Intern ation al M a ritim e Board).
hub provides shippers w ith the po ssib ility o f using the hub for The security th re a t linked to piracy increased insurance fees for
added-value logistical activities, p a rticu la rly i f the hub is a lo w cost vessels tra n sitin g the region (i.e. w a r risk insurance, ad ditiona l
location before entering high d is trib u tio n cost areas. Free trade P&I fees and higher p re m ium on cargo insurance) and increased
zone status can trig g e r developm ent o f value-added services. operating costs in term s o f a d ditiona l m anning costs, costs related
Theys et al. (2008) provide a more detailed discussion on the po to a licensed security guard and deterren t equipm ent. De M onie
te n tia l o f interm ediate locations in attractin g logistics activities. (2009) estimates th a t these a d ditiona l costs ty p ic a lly am ount to
Follow ing th e ir model, the chance for southern Africa to develop USD 100,000-115,000 per transit. For container vessels operating
logistics activities on transh ip m ent cargo is p a rtly determ ined by on the Europe-Far East trade, vessel re ro utin g via the Cape Good
the status o f hinterland co rrid o r developm ent in Sub-Saharan A fri Hope is an expensive solutio n to avoid piracy. The a d ditiona l cap
ca. This region is characterized by a large num ber o f sm aller m a r ita l o r vessel charter costs (m ore vessels needed to guarantee a
kets w ith m any local ports offering a lim ite d access to the distant w e ekly call in each p o rt along the loop), a d ditiona l voyage and
hinterland. This is positive fo r the consolidation o f logistics a c tiv i b unker costs (sailin g tim e increases w ith 5 -7 days) and ad ditiona l
ties in a m aritim e-based logistics hub in the region. Poorly devel cargo in ve n to ry costs w o u ld not o u tw eigh the savings in Suez Ca
oped corridors in o th e r countries o f Sub-Saharan Africa provide nal fees and security costs (De Monie, 2009). The Cape route does
op po rtu nitie s for a logistics hub in South Africa to act as a turn ta b le not elim in ate security costs com pletely as security threats also ex
fo r the d is trib u tio n o f products to Sub-Sahara A frican markets. A ist o ff the coast o f Nigeria (40 attacks in 2008) and p o te n tia lly also
free trade zone status o f such a logistics hub can facilitate the in Tanzania, M auretania and Kenya. Somalia pirates operate up to
developm ent o f logistics activities near a transh ip m ent hub. Free 500 nautical m iles fro m the coast.
trade zones lo w e r the costs related to the inclusion o f a central dis Second, the Suez Canal has a fin ite capacity. For the foreseeable
trib u tio n p o in t in the n e tw o rk and are p a rticu la rly useful as buffers future there are no serious capacity constraints o r no d ra ft lim ita
in supply chains and as (deK on solida tion points in networks. tions fo r container vessels. However, the single-lane character o f
the Canal continues to constrain the num ber o f tra n sitin g vessels
per day due to peaks in ship arrivals. As soon as the Canal is near
7. Threats to the position of the Suez route ing its fu ll capacity, SCA m ig h t have to consider a capacity manage
m ent strategy based on a variable p ricin g system, i.e. high transit
W h ile the Suez Canal w ill undo ub te dly rem ain a very im p o rta n t fees on peak m om ents and lo w e r fees w h en dem and is lower.
oceanic canal, the Suez route is confronted w ith a num ber o f chal Moreover, the Panama Canal exam ple has dem onstrated th a t oper
lenges w h ich determ ine the Canal’s appeal to shipping lines and ating at fu ll capacity leads to higher fees per transit.176 T.E. N otteboom /Journal o f Transport Geography 22 (2012) 164-178
Third, o u r analysis showed th a t bunker price evolutions rem ain route. Shipping via the NSR could save about 40% o f the sailing dis
an im p o rta n t factor to the success o f the Suez Canal. Low bunker tance fro m Asia (Yokohama) to Europe (R otterdam ) compared to
prices make shipping lines less concerned about nautical distances. the tra d itio n a l Suez route. In cost term s the route today is s till less
H igh bunker prices give an incentive to shipping lines to slow favourable due to the need for ice-classed ships and ice breaker
steam and cut sailing distance. Our cost analysis dem onstrated th a t assistance, n o n -re g u la rity o f lin e r services, slow er sailing speeds,
a scenario o f ever higher bunker prices is lik e ly to lead to a pa rtial navigation d ifficu ltie s and Russian tra n sit fees (Drent, 1993; Liu
re ro utin g o f in te rlin in g business fro m the Suez route to the Cape and Kronbak, 2010).
route. The com petitiveness o f the NSR im proves som ewhat w h en b u n
Fourth, the m acro-econom ic geography has con tribu te d s ig n ifi ker prices are high. In 2011, the Russian governm ent announced its
can tly to the success o f the Suez Canal. Hence, the Europe-Far East co m m itm e n t to make the NSR route m ore com petitive. Schoyen
container trade, the Canal’s key trade lane, surged in the last dec and Brathen (2011) conclude th a t the u n certainty in schedule re li
ades and even accelerated in the period 2002-2008. The Europe- a b ility via the NSR (caused by seasonality) makes th a t this route
Far East route overtook the transpacific route in 2007 to become should p rim a rily be explored fo r b u lk rathe r than fo r lin e r shipping.
the largest containerized tra d in g lane. The Europe-Far East trade The com m ercial po tentia l o f the east-west ra il corridors, a set o f
totaled 16.82 m illio n TEU in 2009 compared to 4.4 m illio n TEU ra ilw a y lines connecting East Asia and the w estern part o f Russia
in 1995, 7.11 m illio n TEU in 2000 and 13.74 m illio n TEU in 2005 w ith the Eastern part o f Russia, was already id e n tifie d in the early
(UNCTAD, 2002, 2008, 2011). However, the Suez Canal is chal w orks o f Helle (1977) and H ayuth (1982). The m ain arteries are the
lenged by a changing econom ic geography in w o rld trade. Next Trans-Siberian Railway, the T rans-M anchurian Railway, the Trans-
to the rise o f Asia, oth er regions such as South Am erica and Sub- M ongolian Railway and the Baikal A m u r M ainline (BAM - opened
Saharan Africa are expected to take up a more pro m in e n t role in in 1991). The ‘Trans-Siberian in Seven Days’ program sets a target
global trade patterns. Container flow s between Asia on the one speed o f 1500 km a day by 2015. Large ports in Europe such as Rot
hand and the South Am erican East Coast and W est and South Africa terdam , A n tw e rp and Ham burg are already be ne fiting from im
on the o th e r hand are no w ty p ic a lly being in te rlin e d in tra n sh ip proved land bridge connections. For example, in the Spring o f
m ent hubs like Algeciras and Valencia in Spain and fu rth e r up 2011, the p o rt o f A n tw e rp established a ra il service to Chongqing
n o rth in A ntw erp, Le Havre and Rotterdam. As dem onstrated ear in China passing via Duisburg. Rail land bridges in princip le offer
lie r in this paper the dependency o f these container flow s on the lead tim e advantages to shippers, b u t capacities rem ain lo w com
Suez route is not guaranteed in the longer te rm w h en considering pared to container lin e r services. According to a 2011 study on
an operational en viro nm en t characterized by rising bunker costs, Interco ntine ntal Combined Traffic (ICOMOD) by the International
slow steaming practices and scale increases in vessel size. U nion o f Railways (UIC), Euro-Asian ra il transp ort volum es could
This paper focused on co m p e titio n between the Suez route and reach 1 m illio n TEU annually by 2030, m a in ly com ing from East
the Cape route for a ttra ctin g in te rlin in g business. The results show Asia/China. In addition, tra ffic from South Asia could add another
th a t the Suez route is expected to rem ain the logical and dom inant 150,000 TEU annually. H ille to fth et al. (2007) dem onstrated th a t
choice fo r connecting Asia w ith Europe. Still, this fin d in g does not ra il land bridges in princip le o ffer lead tim e advantages to shippers,
im p ly the Suez route w ill not face a certain degree o f com p etitio n b u t inefficiencies in the in te rm od al chain hin d e r these alternatives
fro m a num ber o f oth er ro u tin g alternatives th a t are being planned fro m reaching th e ir fu ll potential. Vernya and G rigentinc (2009)
o r are in operation to accom modate part o f the trade volum es adopted a m odel schedule between Shanghai and Ham burg to ana
between Europe and Asia (Fig. 9). A detailed discussion on these lyse the relative costs o f various axes in the Asia-Europe transp ort
ro u tin g options goes beyond the scope o f the paper. W e lim it the netw ork. T heir results show th a t shipping th ro u g h the Suez Canal
discussion to the N o rth Sea Route (NSR) and the Euro-Asian rail is s till by far the cheapest option. The N o rth Sea Route and the
transp ort corridors volumes. Trans-Siberian Railw ay appear to be roughly equivalent second-
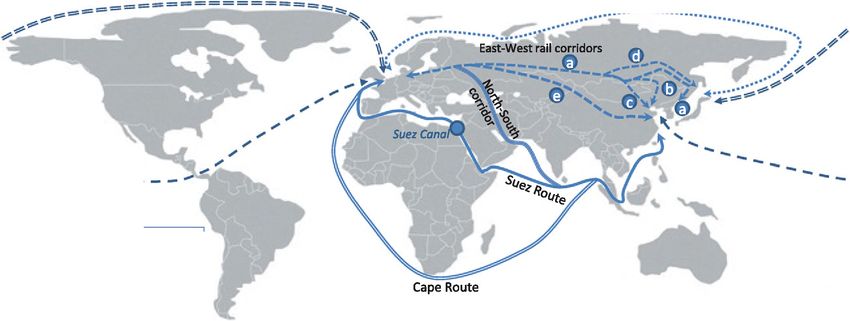
The N orthern Sea Route (NSR) is a set o f a ll-w a te r shipping tie r alternatives. The N o rth South land corridor, a landbridge from
lanes between the A tla n tic Ocean and the Pacific Ocean along the the Persian G ulf via Iran to Russia, is considerably m ore expensive
Russian coast o f Siberia and the Far East. Future ice cap reductions than the Suez route in case the de stination is in N o rthern Europe
w o u ld open new possibilities fo r com m ercial shipping on this (M ohsenpour, 2006).
N o rth w e s t Passage
N o rth e rn Sea Ro ute
East-West rail corridors
P an am a Canal ro u te
Legend
a = Trans-Siberian Railway
b = Trans-Manchurian Railway
c = Trans-Mongolian Railway
Cape Ro ute
d = Baikal Am ur Mainline (BAM)
e = New Asia-Europe Land-Bridge
Fig. 9. The main routing alternatives between East Asia and Northern Europe.You can also read


