Quarterly laboratory surveillance of acquired carbapenemase-producing Gram-negative bacteria in England: April 2021 to June 2021 update - Health ...
←
→
Page content transcription
If your browser does not render page correctly, please read the page content below
Quarterly laboratory surveillance of
acquired carbapenemase-producing
Gram-negative bacteria in England:
April 2021 to June 2021 update
Health Protection Report
Volume 15 Number 14
17 August 2021

1
Laboratory surveillance of carbapenemase-producing Gram-negative bacteria (England): April to June 2021
Health Protection Report volume 15 number 14

      Contents

      Background ................................................................................................................ 3
      First three quarters of notification data (October 2020 to June 2021) ........................ 5
         Geographic distribution ........................................................................................... 5
         Regional differences in resistance mechanism ....................................................... 9
         Distribution of species and resistance mechanism ............................................... 10
         Age and sex distribution ....................................................................................... 12
      Acknowledgements .................................................................................................. 13

                                                              2
Laboratory surveillance of carbapenemase-producing Gram-negative bacteria (England): April to June 2021
Health Protection Report volume 15 number 14
Background
From 1 October 2020, all diagnostic laboratories in England have a duty to
notify the following via PHE’s Second Generation Surveillance System
(SGSS):
• acquired carbapenemase-producing Gram-negative bacteria identified in
human samples
• the results of any antimicrobial susceptibility test and any resistance
mechanism for any of the causative agents listed in Schedule 2 of the
Health Protection (Notifications) Regulations 2010.
This requirement was launched in conjunction with the national Framework of
Actions to contain carbapenemase-producing Enterobacterales (CPE) which
sets out a range of measures that, if implemented well, will help health and
social care providers minimise the impact of CPE.
These analyses are based on data relating to notifications of confirmed
acquired carbapenemase-producing Gram-negative bacteria between
October 2020 and June 2021 in England. The data were extracted on 1 July
2021 from both Public Health England’s voluntary surveillance database,
SGSS, and Public Health England’s Antimicrobial Resistance and
Healthcare-Associated Infections (AMRHAI) Reference Unit database.
Rates of acquired carbapenemase-producing Gram-negative bacteria were
calculated using mid-year resident population estimates for the respective
year and geography. Geographical analyses were based on the patient’s
residential postcode. Where this information was unknown, the postcode of
the patient’s General Practitioner was used. Failing that, the postcode of the
reporting laboratory was used. Cases in England were further assigned to
one of nine local PHE Centres (PHECs), formed from the administrative local
authority boundaries.
As patients may have more than one positive specimen taken, specimens
taken from the same patient that yielded growth of the same pathogen and
carbapenemase within a 52-week period from the initial positive sterile site
specimen, screening site specimen or other specimen type (grouped
together), were regarded as comprising the same episode of infection and
were de-duplicated. Carbapenemase-producing Gram-negative bacteria
referred isolates and local laboratory isolates were combined for this de-
duplication process, with resistance mechanism results from the AMRHAI
Reference Unit retained preferentially where patient specimen overlap
occurred. This method differs slightly from the weekly causative agent
3Laboratory surveillance of carbapenemase-producing Gram-negative bacteria (England): April to June 2021
Health Protection Report volume 15 number 14
notification data, where data are not de-duplicated incorporating specimen
type. In addition, the data presented in the weekly notification reports are
utilising SGSS reports only.
The following report summarises trends and geographical distribution
of carbapenemase mechanisms identified from Gram-negative bacteria in
human samples. Species, mechanism, sample type, and age and sex of
patients are also described. For the purposes of this report, quarters are
calendar quarters, as such October to December is referred to as 'Q4',
January to March is referred to as 'Q1’ and April to June is referred to as ‘Q2’
alongside relevant years. When reporting on the combined nine-month
period, this is referred to as October 2020 to June 2021.
4Laboratory surveillance of carbapenemase-producing Gram-negative bacteria (England): April to June 2021
Health Protection Report volume 15 number 14
First three quarters of notification data
(October 2020 to June 2021)
Between October 2020 and June 2021, there were 1,530 acquired
carbapenemase-producing Gram negative bacteria notifications. The majority
were identified in screening samples, accounting for 68.6% of
carbapenemase notifications, with only 5.6% reported in sterile site
specimens (Table 1).
Table 1. Number and percentage of acquired carbapenemase-producing
Gram-negative reports by specimen type (England): October 2020 to
June 2021
All reports From AMRHAI ǂ
Specimen type
No. % No. %
Sterile site samples 85 5.6 46 12.6
Screening samples 1,049 68.6 178 48.6
Other samples* 396 25.9 142 38.8
All samples 1,530 100.0 366 100.0
* Samples that do not fall into either ‘invasive’ or ‘screening’ samples, for example, urine and lower
respiratory tract specimens.
ǂ The AMRHAI reference unit actively encourages submission of sterile site isolates for
carbapenemase confirmation; the distribution of specimen type will reflect this.
The remaining data summaries in this report consider all samples grouped
together.
Geographic distribution
Between October 2020 and June 2021, the overall rate of acquired
carbapenemase-producing Gram-negative bacteria reports was 0.90 per
100,000 population across England. The overall rate per quarter was slightly
higher in Q4 2020 compared with Q1 2021 and Q2 2021 (1.03 versus 0.879
and 0.88 per 100,000 population, respectively).
5Laboratory surveillance of carbapenemase-producing Gram-negative bacteria (England): April to June 2021
Health Protection Report volume 15 number 14
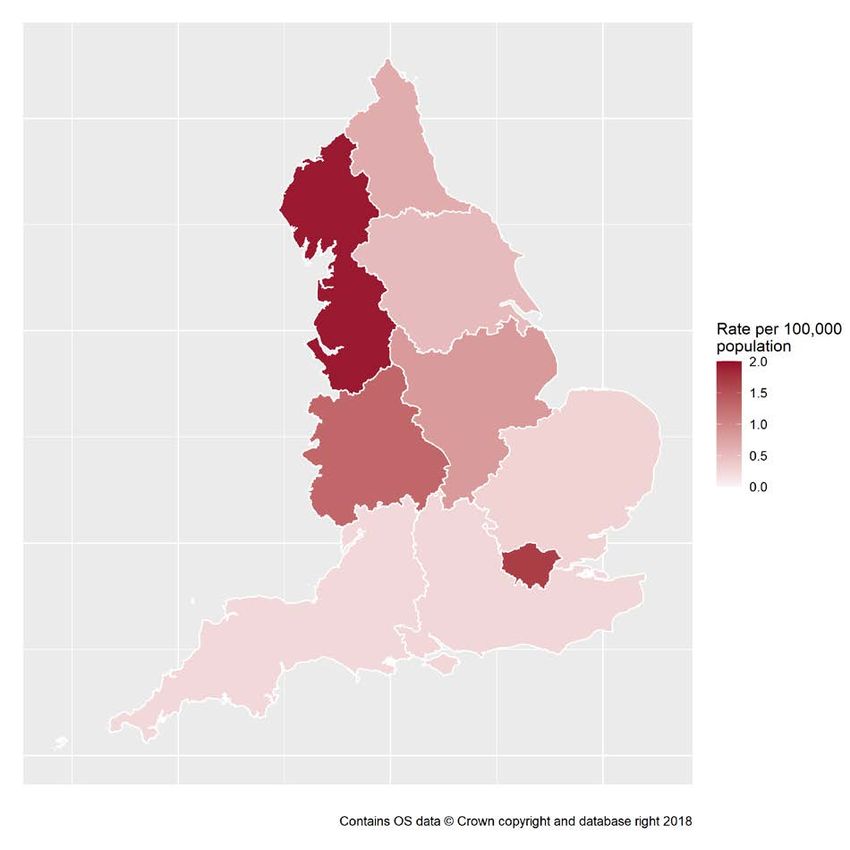
Figure 1. Geographical distribution of acquired carbapenemase-
producing Gram-negative bacteria rates per 100,000 population
(England): October 2020 to June 2021
The rate of acquired carbapenemase-producing Gram-negative reports
varied by region (Figure 1), with the highest overall rate for all quarters
combined being in the North West (1.94 per 100,000 population), followed by
the London region (1.67 per 100,000 population). The lowest incidence
across the time period were reported in the South West (0.24 per 100,000
population) and in the South East (0.26 per 100,000 population).
6Laboratory surveillance of carbapenemase-producing Gram-negative bacteria (England): April to June 2021
Health Protection Report volume 15 number 14
Comparing the regional case numbers and rates across the first three
quarters, all regions noted a decrease between Q4 2020 and Q1 2021, with
the exception of the North East and Yorkshire and Humber regions, where
the rate per 100,000 population increased from 0.34 to 0.75 (9 to 20 reports)
and from 0.42 to 0.49 (23 to 27 reports), respectively. Between Q1 and Q2
2021, all regions noted an increase, with the exception of the East of England
and West Midlands regions, where the rate per 100,000 population
decreased from 0.28 to 0.18 (19 to 12 reports) and from 1.36 to 1.07 (81 to
64 reports), respectively (Table 2).
While the London region recorded the highest number of acquired
carbapenemase-producing Gram-negative bacteria in Q4 2020 and Q1 2021
(183 and 126, respectively), the North West had the highest rate in these
quarters (2.23 and 1.60 reports per 100,000 population, respectively). In Q2
2021, the North West recorded both the highest number of acquired
carbapenemase-producing Gram-negative bacteria (146), and the highest
rate (1.98 reports per 100,000 population).
7Laboratory surveillance of carbapenemase-producing Gram-negative bacteria (England): April to June 2021
Health Protection Report volume 15 number 14
Table 2. Number and rate per 100,000 population of acquired carbapenemase-producing Gram-negative reports by
region (England): October 2020 to June 2021
Q4 2020 Q1 2021 Q2 2021
Region PHE Centre Rate per Rate per Rate per
Number of Number of Number of
100,000 100,000 100,000
reports reports reports
population population population
North East 9 0.34 20 0.75 23 0.86
North of
North West 164 2.23 118 1.60 146 1.98
England
Yorks.and Humber 23 0.42 27 0.49 34 0.62
Midlands and East Midlands 47 0.97 32 0.66 40 0.82
East of East of England 23 0.34 19 0.28 12 0.18
England West Midlands 88 1.48 81 1.36 64 1.07
London London 183 2.03 126 1.41 143 1.57
South of South East 32 0.36 18 0.20 19 0.21
England South West 16 0.29 7 0.13 17 0.31
England overall 585 1.03 448 0.79 496 0.88
While the London region recorded the highest number of acquired carbapenemase-producing Gram-negative bacteria in
each quarter (183 and 126 in Q4 2020 and Q1 2021, respectively), the North West had the highest rate in each quarter at
2.23 and 1.60 reports per 100,000 population, respectively.
8Laboratory surveillance of carbapenemase-producing Gram-negative bacteria (England): April to June 2021
Health Protection Report volume 15 number 14
Regional differences in resistance mechanism
Figure 2. Regional distribution of reports by resistance mechanism (England): October 2020 to June 2021
100%
90%
80%
Other
70% VIM
Percentage
60%
OXA48
50%
40% NDM
30%
KPC
20%
10% IMP
0%
East East of London North East North South South West Yorkshire
Midlands England (n=450) (n=52) West East West Midlands and The
(n=199) (n=54) (n=428) (n=69) (n=40) (n=233) Humber
(n=84)
Region
Similar to the incidence variation by region, the carbapenemase family identified also varied regionally (Figure 2).
Between October 2020 and June 2021, the most common carbapenemase families reported from the North West region
were KPC and OXA-48-like, accounting for 63.1% and 27.6% of cases respectively. In the London region, the most
common carbapenemase families were OXA-48-like (45.3%) and NDM (44.7%; Figure 2). In the South West and South
East, which had the lowest rates of confirmed carbapenemase-positive isolates, the most common resistance mechanisms
were NDM (52.2%) and OXA-48-like (45.0%), respectively.
9Laboratory surveillance of carbapenemase-producing Gram-negative bacteria (England): Oct 2020 to March 2021
Health Protection Rweport volume 15 number 14
Distribution of species and resistance mechanism
Across the three quarters, the most frequently isolated Gram-negative bacterial species
with a confirmed carbapenemase mechanism was Klebsiella pneumoniae, accounting
for 33.8% (517/1,530) of all specimens. This was followed by Escherichia coli and
Enterobacter spp., which accounted for 25.8% (395) and 19.7% (301) of all specimens,
respectively (Table 3).
Among K. pneumoniae isolates, the most common resistance mechanisms were OXA-
48-like (50.1%), KPC (28.2%) and NDM (19.3%). Similarly, among E. coli isolates, the
OXA-48-like mechanism was the most common (47.1%); however, over a third of
isolates (34.9%) were NDM and then KPC accounted for 15.9%, roughly a half of that
found amongst K. pneumoniae. The distribution of resistance mechanisms amongst
Enterobacter spp. isolates was different to both E. coli and K. pneumoniae; the most
common resistance mechanisms were KPC (33.6%), OXA-48-like (31.9%) and NDM
(22.6%).
Aside from the 'big 5' carbapenemase families (KPC, OXA-48-like, NDM, VIM and IMP),
the AMRHAI Reference Unit also screens for rarer carbapenemase families. In England
between October 2020 and June 2021, there were 6 reports of a GES carbapenemase,
4 in Pseudomonas aeruginosa, and 1 each in Acinetobacter spp. and E. coli. There were
6 Enterobacter spp. reports positive for an IMI carbapenemase. None of the rarely
identified carbapenemase families were from invasive specimens.
10Laboratory surveillance of carbapenemase-producing Gram-negative bacteria (England): Oct 2020 to March 2021
Health Protection Rweport volume 15 number 14
Table 3. Reports of acquired carbapenemase-producing Gram-negative bacteria by species and resistance
mechanism (England): October 2020 to June 2021
Resistance mechanism IMP KPC NDM OXA-48-like VIM Other Total
Species No. % No. % No. % No. % No. % No. % No %
Acinetobacter spp. 3 30.0 0 0.0 6 60.0 0 0.0 0 0.0 1 10.0 10 100.0
Citrobacter spp. 2 2.3 25 28.4 19 21.6 37 42.0 5 5.7 0 0.0 88 100.0
Enterobacter spp. 28 9.3 101 33.6 68 22.6 96 31.9 2 0.7 6 2.0 301 100.0
Escherichia coli 3 0.8 63 15.9 138 34.9 186 47.1 4 1.0 1 0.3 395 100.0
Klebsiella oxytoca 0 0.0 18 38.3 2 4.3 24 51.1 3 6.4 0 0.0 47 100.0
Klebsiella pneumoniae 7 1.4 146 28.2 100 19.3 259 50.1 5 1.0 0 0.0 517 100.0
Other Klebsiella spp. 2 3.5 10 17.5 23 40.4 20 35.1 2 3.5 0 0.0 57 100.0
Morganella spp. 0 0.0 0 0.0 2 25.0 6 75.0 0 0.0 0 0.0 8 100.0
Pseudomonas aeruginosa 11 15.7 4* 5.7 20 27.6 2 2.9 29 41.4 4 5.7 70 100.0
Other Pseudomonas spp. 2 18.2 3* 27.3 2 18.2 0 0.0 4 36.4 0 0.0 11 100.0
Serratia spp. 0 0.0 0 0.0 1 14.3 6 85.7 0 0.0 0 0.0 7 100.0
Other Gram-negative bacteriaǂ 1 5.3 4 21.1 3 15.8 11 57.9 0 0.0 0 0.0 19 100.0
Total 59 374 384 647 54 12 1,530
ǂ includes Aeromonas hydrophilia, coliform, other Escherichia spp., Hafnia spp., Kluyvera spp., Pantoea spp., Pluralibacter
gergoviae, Proteus mirabilis, and, Raoultella spp.
* KPC in Pseudomonas spp. are extremely rare, and results should be interpreted with caution.
11Laboratory surveillance of carbapenemase-producing Gram-negative bacteria (England): Oct 2020 to March 2021
Health Protection Rweport volume 15 number 14
Age and sex distribution
The rate of acquired carbapenemase-producing Gram-negative bacteria reports
generally increased with age. A similar pattern was noted for both sexes (Figure 3)
although overall the rate was higher in males compared to females (3.0 and 2.3 reports
per 100,000 population, respectively).
Figure 3. Rates of acquired carbapenemase-producing Gram-negative bacteria
reports per 100,000 population by age and sex* (England): October 2020 to June
2021
18
16
Rate per 100,000 population
14
12
10
8
6
4
2
0Laboratory surveillance of carbapenemase-producing Gram-negative bacteria (England): Oct 2020 to March 2021
Health Protection Rweport volume 15 number 14
Acknowledgements
These reports are only possible thanks to the weekly contributions from microbiology
colleagues in laboratories across England, without whom there would be no surveillance
data. Support from colleagues within Public Health England and the PHE AMRHAI
Reference Unit, is particularly valued in the preparation of the report. Feedback and
specific queries about this report are welcome via hcai.amrdepartment@phe.gov.uk.
13www.gov.uk/phe
Twitter: @PHE_uk
www.facebook.com/PublicHealthEngland
© Crown copyright 2021
Version 2
Queries relating to this document should be directed to:
HCAI-AMR Department,
National Infection Service, PHE Colindale,
61 Colindale Avenue, London NW9 5EQ.
hcai.amrdepartment@phe.gov.uk
Published July 2021
PHE gateway number: GOV-9355
14You can also read