RackLay: Multi-Layer Layout Estimation for Warehouse Racks
←
→
Page content transcription
If your browser does not render page correctly, please read the page content below
RackLay: Multi-Layer Layout Estimation for Warehouse Racks
                                                Meher Shashwat Nigam∗ 1,2 , Avinash Prabhu∗ 1 , Anurag Sahu∗ 1 , Puru Gupta† 1 , Tanvi Karandikar† 1 ,
                                                           N. Sai Shankar1 , Ravi Kiran Sarvadevabhatla2 , and K. Madhava Krishna1
                                                        1
                                                            Robotics Research Center, IIIT Hyderabad, 2 Center for Visual Information Technology, IIIT Hyderabad
arXiv:2103.09174v2 [cs.CV] 17 Mar 2021

                                         Fig. 1: Given a monocular RGB image of a warehouse rack, we propose RackLay, a deep neural architecture that generates the top-view
                                         and front-view semantic layout for rack shelves and items placed on each shelf. Fusing these layouts provides a volumetric reconstruction
                                         of the rack, enabling 3D reasoning. For the considered rack in the figure, our system can report "Rack has 4 shelves, 12 box stacks, and
                                         830cm3 of free space available".

                                            Abstract— Given a monocular color image of a warehouse                In this paper, we address the hitherto untackled problem of
                                         rack, we aim to predict the bird’s-eye view layout for each shelf     layout and freespace estimation for rack shelves. This prob-
                                         in the rack, which we term as ‘multi-layer’ layout prediction.        lem is equally important in the context of warehouses without
                                         To this end, we present RackLay, a deep neural network for
                                         real-time shelf layout estimation from a single image. Unlike         WMS as well as in the scenarios where automated robotic
                                         previous layout estimation methods which provide a single lay-        agents manipulate a shelf space. In this effort, monocular
                                         out for the dominant ground plane alone, RackLay estimates the        vision is the sensing modality considering the ubiquitous, low
                                         top-view and front-view layout for each shelf in the considered       cost, high portability and scalability of such single camera
                                         rack populated with objects. RackLay’s architecture and its           systems.
                                         variants are versatile and estimate accurate layouts for diverse
                                         scenes characterized by varying number of visible shelves in             We propose a simple yet effective network architecture
                                         an image, large range in shelf occupancy factor and varied            RackLay1 , which takes a single RGB image as input and
                                         background clutter. Given the extreme paucity of datasets in          outputs the top-view and front-view layouts of all the shelves
                                         this space and the difficulty involved in acquiring real data         comprising the dominant rack in the image (see Fig. 1).
                                         from warehouses, we additionally release a flexible synthetic
                                                                                                               RackLay consists of a shared context encoder which reasons
                                         dataset generation pipeline WareSynth which allows users to
                                         control the generation process and tailor the dataset according       about the shelves and objects together. In turn, such reason-
                                         to contingent application. The ablations across architectural         ing enables RackLay’s decoder to generate both the top-view
                                         variants and comparison with strong prior baselines vindicate         and front-view layout of the rack on a per-shelf basis (see
                                         the efficacy of RackLay as an apt architecture for the novel          Fig. 2).
                                         problem of multi-layered layout estimation. We also show
                                         that fusing the top-view and front-view enables 3D reasoning
                                                                                                                  It is important to note that the problem is not immediately
                                         applications such as metric free space estimation for the             reducible to any standard formulation of object recognition,
                                         considered rack.                                                      layout estimation or semantic segmentation. Objects on the
                                                                                                               rack shelves are amenable for semantic segmentation [3]
                                                              I. I NTRODUCTION
                                                                                                               or object detection [4]. However, this is not the case for
                                            The importance and the necessity of warehouse automa-              racks themselves, which appear as occluded, diffused, thin
                                         tion grows by the day and the future is painted with a sce-           structures. Indeed, these hollow structures pose a challenge
                                         nario where a fleet of robots manage the warehouse with or            for mainstream approaches. For very similar reasons, existing
                                         without human intervention [1]. Nonetheless, almost 30% of            approaches cannot be trivially adapted for localizing rack
                                         the warehouses today operate without their staple warehouse           shelves. Unlike standard layout formulations which estimate
                                         management systems (WMS)[2]. In such situations, essential            the layout with reference to a single dominant plane (e.g.
                                         tasks such as shelf occupancy estimation and management               ground plane) [5], warehouse rack shelves are disconnected
                                         become important and challenging tasks.                               and distinct planar segments present at multiple heights (lay-
                                           ∗ ,† denote equal contribution
                                           Corresponding author: mehershashwat@gmail.com                         1 Project   page: https://github.com/Avinash2468/RackLay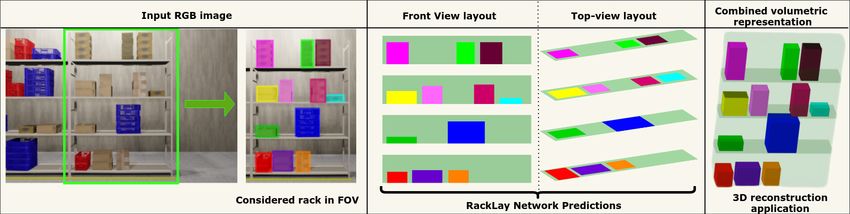
ers) relative to ground plane. Needless to say, these shelves           2) Object detection methods: We relate to deep learning
can be either empty or contain an arbitrary number of objects.       based detection models, as a large part of our problem
Hence, a cornerstone novelty of the present formulation is           deals with localizing semantic classes like shelves and
the adaptation of deep architectures to the problem of layout        boxes/cartons in an 3D scene. Several existing approaches
estimation over multiple shelf levels (layers) that constitute       aim to detect object layouts in 3D. Some of these [11], [12]
a rack and contents thereof.                                         approaches combine information from images and LiDAR,
   Specifically the paper contributes as follows:                    others [5], [13] work by converting images to bird’s eye view
  1) It solves for the first time, the problem of shelf layout       representations, followed by object detection.
     estimation for warehouse rack scenes – a problem                   3) Bird’s eye view (BEV) representation: BEV semantic
     pertinent in the context of both warehouse inventory            segmentation has been tackled mostly for outdoor scenes.
     management as well as futuristic warehouses managed             Gupta et al.[14] demonstrate the suitability of a BEV rep-
     by an autonomous robotic fleet.                                 resentation for mapping and planning. Schulter et al.[15]
  2) It proposes a novel architecture, (Sec. IV), the keynote        proposed one of the first approaches to estimate an occlusion-
     of which is a shared context encoder, and most impor-           reasoned bird’s eye view road layout from a single color
     tantly a multi-channel decoder that infers the layout for       image. They use monocular depth estimation and semantic
     each and every shelf in a given rack. We release for            segmentation to aid their network that predicts occluded
     the first time, the RackLay synthetic dataset consisting        road layout. Wang et al.[16] builds on top of [15] to infer
     of 20k RGB images along with layout annotations of              parameterized road layouts. Parametric models might not
     shelves and objects in both the top and front view.             account for all possible scene layouts, whereas our approach
  3) More importantly, we open-source the flexible data              is non-parametric and thus more flexible. MonoOccupancy
     generation pipeline WareSynth, along with relevant in-          [17], uses a variational autoencoder (VAE) to predict road
     structions that enable the researcher/user to create and        layout from a given image, but only for the pixels present
     customize their own warehouse scenes and generate               in the image. MonoLayout [18], can be trained end to end
     2D/3D ground truth annotations needed for their task            on colour images, reasons beyond occlusion boundaries and
     automatically 2 . This does not restrict or limit the user to   does not need to be bootstrapped with these additional inputs.
     our dataset alone but provides for possibilities to create      We predict the occlusion-reasoned occupancy layouts of
     new datasets with the ability to customize as desired,          multiple parallel planes(layers), with varying height, from
     as discussed in detail in Sec. III.                             a single view RGB image.
  4) We show tangible performance gain compared to other                4) Warehouse Datasets: There are very few datasets pub-
     baseline architectures [6] dovetailed and adapted to the        licly available for warehouse settings. Real-world datasets
     problem of rack layout estimation. Moreover, we tabu-           like LOCO[19] exist for scene understanding in warehouse
     late a number of ablations across architectural variants        logistics, in which they provide a limited number of RGB
     which establish the efficacy and superiority of RackLay         images, along with corresponding 2D annotations. Due to
     (Sec. V).                                                       the difficulty in acquiring the 3D ground truth information
                                                                     from real scenes there aren’t any real warehouse datasets
                       II. R ELATED WORK                             which provide information about the objects in scene and
                                                                     their relative positions and orientation. For 3D deep learning
   In recent years, learning scene layouts and obtaining
                                                                     applications, large amount of diverse data along with 3D
volumetric representations directly from an RGB image
                                                                     ground truth information is required. There are general
has garnered lot of interest. Deep learning methods have
                                                                     purpose synthetic data simulators like NVIDIA Isaac [20],
become more reliable and accurate for many computer vision
                                                                     which provide warehouse scenes. However, they provide
tasks like object detection, semantic segmentation and depth
                                                                     lesser control as to specifying properties for the warehouse,
estimation. But even a combination of these fundamental
                                                                     and can’t be modified easily to generate annotations needed
solutions does not suffice for higher-order tasks like shelf-
                                                                     for our task.
layout estimation in warehouse management systems, which
requires multi-layer top-view layout estimation. To that ex-                    III. DATASET G ENERATION P IPELINE
tent, we summarize the existing approaches and differentiate           In this section, we introduce our synthetic data generation
our method from the rest.                                            pipeline termed WareSynth, which can be used to generate
   1) Indoor scene understanding: Room layout estimation             3D warehouse scenes, automate the process of data capture
from a single image has been the most solved problem [7],            and generate corresponding annotation.
[8] in the context of indoor 3D scene understanding. There           A. Software and initial models
have also been a few approaches for amodal perception as
                                                                        For modelling the warehouse setup, we used the open
well-[9], [10]. Indoor scene understanding can rely on strong
                                                                     source 3D graphics toolset Blender[21](version 2.91) for
assumptions like a Manhattan world layout, which works
                                                                     modelling and rendering. We used freely available textures
well for single room layouts.
                                                                     and 3D mesh models for creating an initial database of ob-
  2 WareSynth (Warehouse Dataset Generation Pipeline):               jects. These objects include: boxes, crates, racks, warehouse
https://github.com/AnuragSahu/WareSynth                              structures, forklifts, fire extinguishers etc.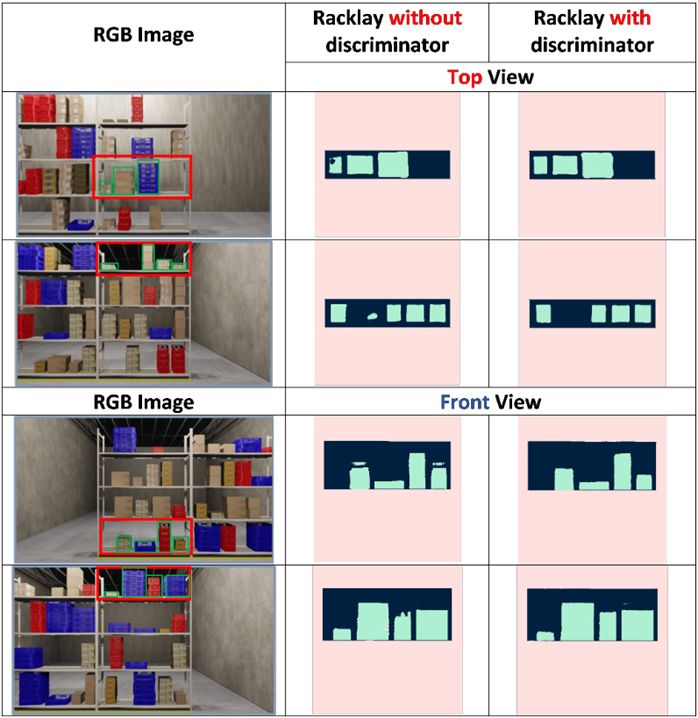
B. Generation process                                             etc. The same pipeline can also be modified to other kinds
   Our generation process entails placement of objects in         of scenes such as supermarkets, greenhouses by changing
the scene procedurally in a randomized fashion, followed by       the database of objects and placement parameters. The
adjustment of the lighting and textures. We perform texture       generation procedure and data capture methods are efficient,
editing and manipulate roughness and reflectance properties       very flexible and can be customized as per user requirement.
of objects to mimic real warehouse scenes.                        This makes the pipeline very useful for future research and
   We start with an empty warehouse. Racks are placed             generating annotated data at a large scale.
inside the warehouse according to a randomly generated 2D
                                                                                               IV. M ETHOD
occupancy map. Lighting in the warehouse is also according
to the same map, where we illuminate the corridors and also       A. Problem Formulation
introduce ambient lighting. We keep the inter-shelf height           Formally, given a monocular color image I of a warehouse
and number of shelves in racks, width of corridors and            rack in perspective view, we aim to predict the top-view
overall rack density of the warehouse as parameters which         (bird’s eye view) layout for each shelf of the rack that lies
can be tuned as per requirements. It is important to note that    within distance d from the camera (range of detection) and
WareSynth is not constrained by our specific settings. The        is visible in the image3 .
existing models can be readily substituted with custom box
                                                                     Concretely, we wish to learn a labelling function that
and rack models to configure the warehouse.
                                                                  generates a top-view layout for the set of all scene points
   We also randomize the placement of boxes on each
                                                                  within a region of interest Ω. Here, we consider Ω to be
particular rack by specifying parameters which control the
                                                                  a rectangular area around the concerned rack’s center, in
density of boxes placed and minimum distance between the
                                                                  a top-down orthographic view of each shelf plane. The
boxes. We vary the density of rack occupancy by sampling
                                                                  labeling function must produce labels for all the points in Ω,
the associated parameter from a uniform distribution between
                                                                  regardless of whether or not they are imaged in I. The points
0 (empty shelf) and 1 (fully occupied shelf). This ensures that
                                                                  in Ω are labelled as occupied, unoccupied or background. In
the data is not imbalanced. Our algorithm picks a random
                                                                  our problem context, a pixel with occupied label denotes
box from available box models, and positions the same
                                                                  the presence of an object (boxes, cartons, crates etc.) at that
at a random angle varying between ±r◦ (where r can be
                                                                  place on the shelf, and the unoccupied label denotes that
specified). The boxes can also be stacked over each other,
                                                                  the shelf is empty at that pixel. Label background denotes
on individual shelves. This probabilistic procedure ensures
                                                                  the area that is not occupied by the shelf. As an additional
that boxes are placed on the shelves randomly, but within
                                                                  task, we aim to learn a similar labelling function for the
the specified constraints, which helps us generate a large
                                                                  points in the front-view layout, which is orthogonal to the
variety of realistic data.
                                                                  top-view layout. Here, we classify the empty inter-shelf area
C. Data capture and annotation                                    as unoccupied. Using a combined representation from these
                                                                  layouts, we obtain a 3D reconstruction of the rack, which can
   We capture data via movement of a 6-DoF camera around
                                                                  be further used for 3D spatial reasoning tasks. We discuss
the warehouse corridors by specifying a path or a set of dis-
                                                                  this extension in the further sections.
crete positions. The camera parameters can be varied in order
to produce a diversity of views. The camera rotation, focal       B. RackLay Architecture
length, height above the ground etc. can all be manipulated
and constrained according to the kind of views desired.              The architecture of RackLay comprises of the following
   As per the requirement, we can capture the RGB images          subnetworks (refer Fig. 2):
at the desired resolution for each of these camera positions,       1) A context encoder which extracts relevant 3D scene
along with the camera intrinsic, and extrinsic parameters.             and semantic features from the input RGB image I
We can also extract 2D annotations such as 2D bounding                 for layout estimation. This provides a context Ie that
boxes and semantic and instance segmentation masks of the              helps us identify occupied, unoccupied and background
objects. By using this pipeline on a NVIDIA RTX 2080Ti                 scene points, for each shelf in the rack, in subsequent
we are able to generate 80 images per-minute. We can also              processing. We use a ResNet-18 encoder (pre-trained
obtain the 3D positions, orientations and 3D bounding boxes            on ImageNet[22]) and fine-tune this feature extractor to
for all objects present in the camera FOV, along with depth            learn low-level features that help reason across the three
maps and normal information. Our pipeline can also be used             scene classes.
to obtain stereo-information. The obtained data can be easily       2) A top-view decoder that can comprehend the context to
be exported to various popular annotation formats such as              generate layouts for each shelf of the rack that is visible
KITTI, COCO, Pix3D, BOP etc.                                           in the image. It decodes the context from the feature
D. Applications and extensions                                       3 Flat-earth assumption: For the scope of this paper, we assume that the

  WareSynth can be used for various tasks such as 2D/3D           concerned rack is located within a bounded area in front of the camera, and
                                                                  that all planes(layers) in consideration (rack shelves, ground etc.) are more
object detection, semantic/instance segmentation, layout esti-    or less planar, with almost no inclination. The rack shelves are considered
mation, 3D scene navigation and mapping, 3D reconstruction        to lie on horizontal planes(layers) parallel to the ground plane.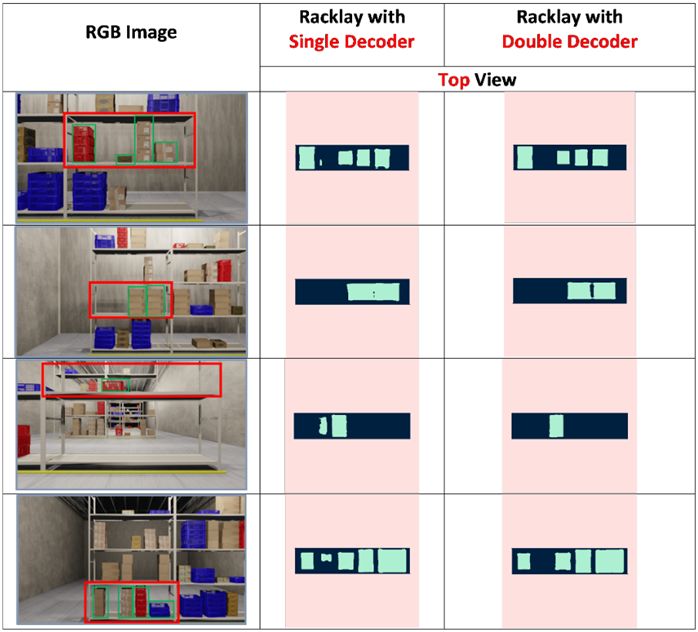
Fig. 2: The figure shows architecture diagram for RackLay-D-disc. It comprises of a context encoder, multi-channel decoders and adversarial
discriminators. (Refer to Sec. V-B).

     extractor (context encoder) via a series of deconvolu-            and Fi are shelf-centric as well as aligned with the shelf’s
     tion and upsampling layers that map the context to a              coordinate frame. Conditioned on the encoded features Ie of
     semantically rich bird’s eye view. The decoder outputs            the input image I, marginals T and F are independent of
     an R x D × D grid which represents the top-view layout            each other. Additionally, the components Ti , i = 1, 2, . . . R
     T where R is the number of output channels and D                  and Fi , i = 1, 2, . . . R are all independent of each other
     is the resolution for the output layouts. Each channel            since the occupancy of each shelf does not depend on other
     represents a shelf and is a per-pixel label map of the            shelves in the rack. Consequently, for the combined task, the
     corresponding top-view layout. It is important to note            posterior can be factorized as follows:
     the novelty of the associated design choice, i.e. using
     a multi-channel output to predict occupancy layouts
     which lie at different heights (layers) in the rack.                    P (T , F|I)
  3) A discriminator is an adversarial regularizer. It refines                        = P (T |Ie )P (F|Ie )
     the predicted layouts by regularizing their distributions                        = P (T1 , T2 . . . TR |Ie )P (F1 , F2 ...FR |Ie )
     to be similar to the true distribution of plausible layouts.                          R
                                                                                           Y                   R
                                                                                                               Y
     The layouts estimated by the top-view decoder are input                                P (Ti |Ie )     P (Fi |Ie ) )
     to this patch-based discriminator. The discriminator                             = i=1             i=1
     regularizes the distribution of the output layouts (fake                           |    {z      } |
                                                                                           top-view decoder
                                                                                                              {z     }
                                                                                                               front-view decoder
     data distribution, in GAN[23] parlance) to match a prior
     data distribution of conceivable scene layouts (true data         D. Loss function
     distribution).                                                       The network parameters φ, ψ, θ of the context encoder,
   In order to deduce both views (top, front) from a single            the top-view decoder and discriminator respectively are op-
unified model, we extend the above architecture by adding              timized using stochastic gradient descent.
an identical decoder to the existing encoder, followed by a                                                     R
                                                                                                              N X
discriminator, which predicts front-view layout for each shelf
                                                                                                              X
                                                                                    Lsup (Tb ; φ, ψ) =            f Tbij , Tij
(F), just like the top-view layout (T ).                                                                      j=1 i=1

C. Formulation                                                                   Ladv (Tb ; φ, ψ, θ) = Eθ∼pf ake [(Tb (θ) − 1)2 ]
   We formulate the multi-rack shelf layout estimation as
a multi-task probabilistic inference problem. Formally, let                        Ldiscr (Tb ; θ) = Eθ∼ptrue [(Tb (θ) − 1)2 ]
the top-view layout tensor over the domain Ω be TΩ×R                                               + Eθ∼p     [(Tb (θ) − 0)2 ]
                                                                                                                f ake
and the front-view counterpart be FΩ×R . We configure a
deep neural network to maximize the posterior distribution               where, Tb and T are the predicted and the ground truth
P (T , F|I) given an RGB image I. R is a flexible parameter            top-view layouts for each shelf, R is the maximum number
and denotes the maximum number of shelves the network                  of shelves considered and N is the mini-batch size.
can detect. Let Ti and Fi represent per-pixel occupancy                  Lsup is the standard per-pixel cross entropy loss which
label maps for the ith shelf of the rack (i ∈ 1, 2, . . . R). Ti       penalizes deviation of the predicted layout labels (Tb ) from
their corresponding ground-truth values (T ). The adversarial layouts are 512×512 2D pixel grids (hence D = 512) which
loss Ladv encourages the distribution of layout estimates map to a corresponding 8m × 8m spatial extent. Therefore,
from the top-view decoder (pf ake ) to be close to the true the spatial resolution comes out be 1.5625cm/pixel. This
data distribution (ptrue ). Ldiscr enforces the discriminator to mapping helps us estimate free space in metric 3D.
accurately classify the network generated top-view layouts
B. Evaluated Methods and Metrics
from the layouts sampled from the true data distribution.
The discriminator loss Ldiscr is the discriminator update We evaluate the performance for the following approaches:
objective[23]. Note that a similar set of loss terms exist for • PseudoLidar-PointRCNN: A PointRCNN based archi-
front-view layout estimation as well. tecture [6], for 3D object detection on PseudoLidar [13]
input, which involves converting image-based depth
V. E XPERIMENTS AND A NALYSIS maps to LiDAR format. The 3D object detections are
A. RackLay Dataset projected to the horizontal plane to obtain BEV layouts.
For the purpose of training and testing our network, using We chose PointRCNN due to the success it enjoys in
WareSynth, we generated 2 datasets, a simple dataset with 8k bird’s eye view 3D object detection tasks.
• MaskRCNN-GTdepth: Instance segmentation method
images and a complex dataset with 12k images4 . We describe
and display results for our more diverse and complex dataset [4], paired with ground-truth depth maps.
consisting of 12k images, which we split into 8k/2k/2k for We compare that with following variants of RackLay:
train/test/validation. We introduced two kinds of variations • RackLay-S: Single decoder architecture, can be either
during data generation to add diversity and complexity in the for front-view or top-view.
scenes such that the resulting scenes mimic counterparts from • RackLay-D : Double decoder architecture, for both
real warehouses (see Fig. 5). We describe these variations front-view and top-view.
below. • RackLay-S-disc : Single decoder architecture with dis-
Scene-level variation: Each object placed on the racks is criminator, can be either for front-view or top-view.
randomly chosen from a set of 6 distinct cardboard box • RackLay-D-disc : Double decoder architecture with dis-
categories and 2 different types of colored crates. These criminators, for both front-view and top-view.
items all have different dimensions, textures and reflective We evaluate the layouts on both Mean Intersection-Over-
properties (observe rows 1, 2 and 4 of Fig. 5). We also vary Union (mIoU) and Mean Average-Precision (mAP). These
the inter-shelf height and the rack width between different metrics are calculated on a per-class basis.
scenes. The height up to which objects can be stacked over
C. Results
each other is also randomized (observe rows 2, 4 and 6
of Fig. 5). The background for the racks can be a wall We started with a standard encoder-decoder RackLay-
(observe rows 1, 2 and 4 of Fig. 5) or other locations of S architecture, for predicting the top-view layouts. Having
a busy warehouse (observe rows 3, 5, 6, and 7 of Fig. 5), achieved superior results as compared to the baselines, we
possibly containing other racks. Note that this setting poses a trained an identical architecture for predicting front-view
challenge for layout estimation since the network now needs layouts, which also gave similar results as top-view (refer
to differentiate the concerned rack of interest from racks and Table I). To obtain both top and front views simultaneously
other distractions in the background. in a single forward pass, we trained a double decoder model
Variation in camera placement: The camera is placed such Racklay-D for estimating both top-view and front-view. Here,
that it is directly facing the racks, and the image plane is we observed gains in performance both quantitatively (refer
orthogonal to the ground plane. For the camera, its horizontal row 1 in Table I) and qualitatively (refer to Fig. 3). We further
distance to the rack and its vertical position above the ground improved upon Racklay-D with adverserial regularization to
plane are two parameters that are varied. Applying these get our best network, Racklay-D-disc, which gives cleaner
variations affects the number of shelves visible in the image and sharper layouts, as discussed in ablation studies (refer
from 1 to R. For our dataset, we set R=4 (observe rows 1, Sec. V-E).
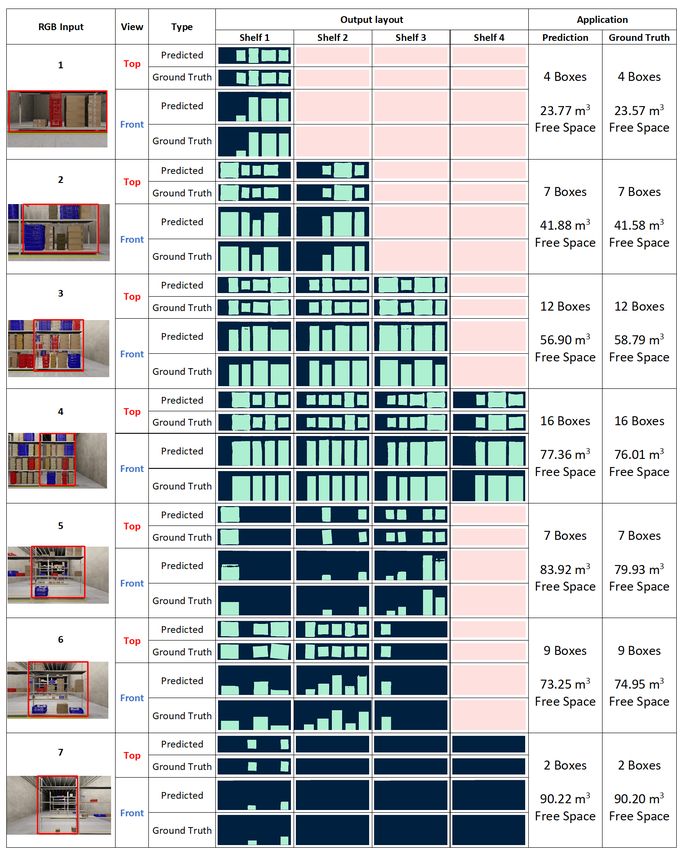
2, 3 and 4 of Fig. 5). In Fig. 5, observe how our best network RackLay-D-
Ground-truth layout generation: For every considered disc is able to estimate layouts for a variety of scenes. For
camera position, we record the corresponding ground truth varying number of shelves (rows 1-4), we are able to predict
information (location, dimensions, category) for all objects layouts that are visible in the image and an empty layout
appearing within the intersection of the camera field of view for the rest. Our dataset also contains extremely sparse and
(FOV) and considered range of detection as defined in the densely packed shelves (rows 4-5), for which our network
problem formulation (IV-A). is able to reason out the thin spaces. We are also able to
From this information, we generate ground truth top-view reason between the concerned rack and background clutter,
and front-view layouts by projecting onto the horizontal the dataset contains images with and without background.
and vertical planes in the shelf-centric reference frame as Images with background clutter are shown in rows 3, 5, 6 and
described earlier. In our setting, the top-view and front-view 7 and images with a wall behind are shown in rows 1, 2 and
4. Our network is also able to estimate layouts with for the
4 Download RackLay datasets:http://bit.ly/racklay-dataset case where no boxes are placed on a shelf as shown in row 7.Top View Front View
Rack Box Rack Box
Method mIoU mAP mIoU mAP mIoU mAP mIoU mAP
RackLay-D-disc 93.15 98.73 95.07 97.90 90.75 98.54 94.29 97.95
RackLay-D 95.03 98.37 92.94 97.63 95.21 98.48 95.17 97.94
RackLay-S-disc 92.34 98.28 93.71 97.85 91.96 98.13 92.65 97.51
RackLay-S 93.02 98.61 94.61 98.07 94.30 98.09 92.11 97.56
PseudoLidar-PointRCNN[6] 73.28 77.40 55.77 81.26 − − 63.05 89.45
MaskRCNN-GTdepth[4] 36.48 42.48 35.57 47.44 − − − −
TABLE I: Quantitative results: We benchmark the 4 different versions of our network- RackLay-S, RackLay-S-disc, RackLay-D and
RackLay-D-disc, along with two baselines- PseudoLidar-PointRCNN[13], [6] and MaskRCNN-GTdepth[4] (as described in Sec. V-B).
Note that RackLay-S and RackLay-S-disc are single decoder models and hence cannot predict top view and front view simultaneously.
The top view and front view results displayed for each of these two models were trained separately (scaled results out of 100).
D. Comparison with baselines
1) PseudoLidar-PointRCNN: We perform 3D object de-
tection using PointRCNN[6] on a PseudoLidar input[13].
The PointRCNN architecture was designed for detecting
objects on a road like scene, their approach assumes a single
dominant layer (the ground plane). This is an assumption
used by many methods designed for bird’s eye view, and
hence may not perform well for indoor scenes where multiple
objects are scattered at different heights relative to ground
plane. We observed that the success enjoyed by PointRCNN
does not translate in the presence of multi-layer data. Their
network is able to identify only the bottom shelf and objects
kept on it. Therefore, we report metrics only for the bot-
tom shelf layouts (refer Table I). This again highlights the
importance of our work because we reason about bird’s eye
view representation for multiple layers, rather than a single Fig. 3: Effect of dual-task learning on top-view layout estima-
tion: The output layouts are being displayed only for the shelf
dominant layer. bounded with a red box. The corresponding boxes for the bounded
2) MaskRCNN: We also compare with a classical shelf are bounded with green boxes. Observe how the predicted
approach wherein we use instance segmentation from boxes in column 3 are more box-like and the presence of spurious
MaskRCNN[4], and pair it with ground truth depth-maps. noise in box predictions is lesser (row 1 and 4). The double-
We project detected boxes to 3D shelf-wise, as boxes on a decoder model performs better in case where there are boxes very
close to each other (row 2) and does a better job predicting the
particular shelf will have similar vertical image coordinate. space between the boxes. It is also better at differentiating between
We then take a projection on the horizontal plane to obtain boxes in the background and foreground (row 3). The single-
the box layouts for each shelf, by computing a convex hull decoder model confuses the background box to the left of the actual
for each box. Since this approach can only reason about vis- foreground box to be in the foreground as well, however the double-
ible points, it is clear from Table I that our network performs decoder model avoids this. The double-decoder model also avoids
predicting spurious boxes as shown in (row 4).
much better as it is able to perform amodal perception and
is able to complete shapes and parts of the layout unseen in
the input image. As discussed in Sec. I, MaskRCNN fails
to predict segmentation maps for thin structures like shelves improvement (refer Table I) in performance for almost all
with good accuracy. Therefore, we present results only for cases. There is a considerable improvement qualitatively as
box layouts. show in Fig. 3, the network avoids predicting spurious boxes
and outputs cleaner layouts. Making the network learn these
E. Ablation studies two tasks together forces it to learn the relevant features
We conduct ablation studies to analyze the performance of related to the occupancy much faster and improves the
various components in the pipeline. These lead to a number performance metrics.
of interesting observations. 2) Adversarial learning: We add a discriminator at the
1) Multi-task learning: For the additional task of es- end of the decoder to improve the layouts. At first glance,
timating the front-view layouts of the shelves, instead of from Table I, using discriminators does not seem to produce
using a identical single decoder model, we added a decoder any significant improvements quantitatively. However, there
to the existing encoder, which hence becomes the shared is considerable improvement qualitatively as shown in Fig
representation. Upon training our model for the dual task of 4, we obtain much sharper and realistic images. Most no-
front-view and top-view layout estimation, we observed that tably in the case of estimating layout for boxes, use of a
the losses were converging faster, with a slight quantitative discriminator reduces stray pixels which are mis-classifieda flexible dataset generation pipeline WareSynth that will aid
future research for robotic tasks in warehouse scenarios.
R EFERENCES
[1] P. Buxbaum, “Many warehouses don’t have wms,”
Aug 2018. [Online]. Available: https://www.globaltrademag.com/
many-warehouses-dont-have-wms/
[2] “Trends in warehouse automation-2021,” Oct 2020. [Online]. Avail-
able: https://www.nitco-lift.com/blog/warehouse-automation-trends/
[3] O. Ronneberger and Fischer, “U-net: Convolutional networks for
biomedical image segmentation,” in International Conference on Med-
ical image computing and computer-assisted intervention, 2015.
[4] K. He, G. Gkioxari, P. Dollár, and R. Girshick, “Maskrcnn,” in
Proceedings of the IEEE international conference on computer vision,
2017, pp. 2961–2969.
[5] T. Roddick, A. Kendall, and R. Cipolla, “Orthographic feature trans-
form for monocular 3d object detection,” arXiv preprint, 2018.
[6] S. Shi, X. Wang, and H. Li, “Pointrcnn: 3d object proposal generation
and detection from point cloud,” in CVPR, 2019.
[7] C. Lee, V. Badrinarayanan, T. Malisiewicz, and A. Rabi-
novich, “Roomnet: End-to-end room layout estimation,” CoRR, vol.
abs/1703.06241, 2017.
Fig. 4: Effect of Discriminator on qualitative performance: The [8] H.-J. Lin, S.-W. Huang, S. Lai, and C.-K. Chiang, “Indoor scene layout
output layouts in (columns 2-3) are being displayed only for the estimation from a single image,” 2018 24th International Conference
shelf bounded with a red box in (column 1). The corresponding on Pattern Recognition (ICPR), pp. 842–847, 2018.
boxes for the bounded shelf are bounded with green boxes. Observe [9] A. Kar, S. Tulsiani, J. Carreira, and J. Malik, “Amodal completion
how using a discriminator leads to more filled out layouts for boxes. and size constancy in natural scenes,” in International Conference on
The model without the discriminator tends to predict boxes with Computer Vision (ICCV), 2015.
holes in them (rows 1, 3 and 4), whereas the discriminator ensures [10] S. Tulsiani, S. Gupta, et al., “Factoring shape, pose, and layout
that this does not happen. The model with the discriminator also from the 2d image of a 3d scene,” in Computer Vision and Pattern
Regognition (CVPR), 2018.
avoids false predictions for boxes as seen in row 2. [11] J. Ku, M. Mozifian, et al., “Joint 3d proposal generation and object
detection from view aggregation,” in IROS, 2018.
[12] M. Liang, B. Yang, S. Wang, and R. Urtasun, “Deep continuous fusion
for multi-sensor 3d object detection,” in ECCV, 2018.
as boxes and outputs more clean box-like structures. Adding [13] Y. Wang, W.-L. Chao, et al., “Pseudo-lidar from visual depth estima-
this component enhances the capability of the network to tion: Bridging the gap in 3d object detection for autonomous driving,”
capture the distribution of plausible layouts. in CVPR, 2019.
[14] S. Gupta, J. Davidson, et al., “Cognitive mapping and planning for
visual navigation,” 2017 IEEE Conference on Computer Vision and
F. Applications Pattern Recognition (CVPR), pp. 7272–7281, 2017.
1) 3D Free Space Estimation: We first obtain the 2D [15] S. Schulter, M. Zhai, N. Jacobs, and M. Chandraker, “Learning to
look around objects for top-view representations of outdoor scenes,”
bounding boxes of all shelves and each box kept on it, in ECCV, 2018.
from the top-view and front-view layouts. Considering a [16] Z. Wang, B. Liu, S. Schulter, and M. Chandraker, “A parametric top-
particular shelf, we then combine the corresponding 2D view representation of complex road scenes,” in CVPR, 2019.
[17] C. Lu and vande Molengraft, “Monocular semantic occupancy grid
bounding boxes from Tbi Fbi to get respective 3D bounding mapping with convolutional variational encoder-decoder networks,”
boxes for each box stack on the shelf. Combining these IEEE Robotics and Automation Letters, 2019.
representations for each shelf of a rack, we get a 3D [18] K. Mani, S. Daga, et al., “Monolayout: Amodal layout estimation from
a single image,” IEEE Winter Conference on Applications of Computer
volumetric reconstruction of the rack (refer Fig. 1). We then Vision (WACV), 2020.
calculate the total capacity of a shelf from the inter-shelf [19] C. Mayershofer, D. M. Holm, B. Molter, and J. Fottner, “Loco: Logis-
height obtained in the front-view layout and subtract the tics objects in context,” in 2020 19th IEEE International Conference
on Machine Learning and Applications (ICMLA), 2020, pp. 612–617.
volumes of the reconstructed object stacks to obtain the free [20] “NVIDIA Isaac SDK,” 2019. [Online]. Available: https://developer.
volume available on the particular shelf (refer Fig. 5). nvidia.com/isaac-sdk
2) Counting Number of Boxes: After applying some [21] Blender Online Community, Blender - a 3D modelling and
rendering package, Blender Foundation, Blender Institute, Amsterdam,
morphological operations (either on top-view or front view), Available: http://www.blender.org
we get disjoint box layouts for each shelf. By counting the [22] J. Deng, W. Dong, et al., “Imagenet: A large-scale hierarchical image
number of connected components, we compute the number database,” in CVPR, 2009.
[23] I. Goodfellow, J. Pouget-Abadie, et al., “Generative adversarial nets,”
of boxes kept on the particular shelf (refer Fig. 5). in Advances in Neural Information Processing Systems 27, 2014.
VI. C ONCLUSION
We propose RackLay, which to the best of our knowledge
is the first approach that provides multi-layered layout es-
timation, unlike previous approaches that assumed a single
dominant plane. RackLay’s versatility is showcased across a
large diversity of warehouse scenes and is vastly superior to
prior art baselines adapted for the same task. We also releaseFig. 5: Diversity in dataset: The output layouts are being displayed only for the rack bounded with a red box in column 1. Here, the boxes in both top-view and front-view are in green color, the free space is in dark blue color. The background is represented with pink. For the sake of visualisation, we have omitted the background class for visible shelves. Observe how our dataset contains images of varying number of shelves and boxes(rows 1-4), extremely sparse and densely packed shelves (rows 4-5) and scenes with background (rows 3, 5, 6, and 7) and without (rows 1, ]2 and 4) background clutter.
You can also read