Radiative Impacts of Aerosols During COVID-19 Lockdown Period Over the Indian Region
←
→
Page content transcription
If your browser does not render page correctly, please read the page content below
ORIGINAL RESEARCH
                                                                                                                                        published: 20 September 2021
                                                                                                                                       doi: 10.3389/fenvs.2021.746090

                                           Radiative Impacts of Aerosols During
                                           COVID-19 Lockdown Period Over the
                                           Indian Region
                                           Rohini L. Bhawar 1*, Suvarna Fadnavis 2, Vinay Kumar 3, P. R. C. Rahul 2, Tushar Sinha 3 and
                                           Simone Lolli 4
                                           1
                                            Department of Atmospheric and Space Sciences, Savitribai Phule Pune University, Pune, India, 2Indian Institute of Tropical
                                           Meteorology, Pune, India, 3Department of Environmental Engineering, Texas A&M University, Kingsville, TX, United States, 4CNR-
                                           IMAA, Potenza, Italy

                                           The COVID-19 lockdown restrictions influenced global atmospheric aerosols. We report
                                           aerosol variations over India using multiple remote sensing datasets [Moderate Resolution
                                           Imaging Spectroradiometer (MODIS), Ozone Monitoring Instrument (OMI), Cloud-Aerosol
                                           Lidar, and Infrared Pathfinder (CALIPSO)], and model reanalysis [Copernicus Atmosphere
                                           Monitoring Service (CAMS)] during the lockdown implemented during the COVID-19
                         Edited by:
                           Bin Zhao,
                                           pandemic outbreak period from March 25 to April 14, 2020. Our analysis shows that,
           Tsinghua University, China      during this period, MODIS and CALIPSO showed a 30–40% reduction in aerosol optical
                         Reviewed by:      depth (AOD) over the Indo-Gangetic Plain (IGP) with respect to decadal climatology
                       Qianqian Zhang,
                                           (2010–2019). The absorbing aerosol index and dust optical depth measurements also
      National Satellite Meteorological
                Center (NSMC), China       showed a notable reduction over the Indian region, highlighting less emission of
                         Hongrong Shi,     anthropogenic dust and also a reduced dust transport from West Asia during the
     Institute of Atmospheric Physics
                          (CAS), China
                                           lockdown period. On the contrary, central India showed an ∼12% AOD enhancement.
                            Dan Chen,      CALIPSO measurements revealed that this increase was due to transported biomass
 China Meteorological Administration,
                                           burning aerosols. Analysis of MODIS fire data product and CAMS fire fluxes (black carbon,
                                 China
                                           SO2, organic carbon, and nitrates) showed intense fire activity all over India but densely
                  *Correspondence:
                                           clustered over central India. Thus, we show that the lockdown restrictions implemented at
                     Rohini L. Bhawar
             rohinibhawar@gmail.com        the government level have significantly improved the air quality over northern India but fires
                                           offset its effects over central India. The biomass-burning aerosols formed a layer near
                    Specialty section:     2–4 km (AOD 0.08–0.1) that produced heating at 3–4 K/day and a consequent negative
         This article was submitted to
            Atmosphere and Climate,
                                           radiative forcing at the surface of ∼−65 W/m2 (±40 W/m2) over the central Indian region.
                a section of the journal
                                           Keywords: COVID-19 lockdown, aerosol pollution over India, radiative forcing and heating, aerosol layer in the lower
   Frontiers in Environmental Science
                                           troposphere, fires over central India
            Received: 23 July 2021
     Accepted: 06 September 2021
     Published: 20 September 2021
                                           1 INTRODUCTION
                              Citation:
   Bhawar RL, Fadnavis S, Kumar V,         There are growing concerns about aerosol pollution over the Indian region due to the negative effects
Rahul PRC, Sinha T and Lolli S (2021)
                                           they produce on health and the hydrological cycle (Meehl et al., 2013; Vinoj et al., 2014; D’Errico
 Radiative Impacts of Aerosols During
COVID-19 Lockdown Period Over the
                                           et al., 2015; Fadnavis et al., 2017a; Fadnavis et al., 2019a). During the past decade, India recorded the
                        Indian Region.     highest levels of air pollution (World Bank and International report 2020). In India, ∼51% of the 1.4
        Front. Environ. Sci. 9:746090.     billion people population are persistently exposed to air pollution. Aerosol pollution over India has
    doi: 10.3389/fenvs.2021.746090         increased hazy days at a rate of 2.6 days per year (Thomas et al., 2019). This aerosol pollution has

Frontiers in Environmental Science | www.frontiersin.org                           1                                       September 2021 | Volume 9 | Article 746090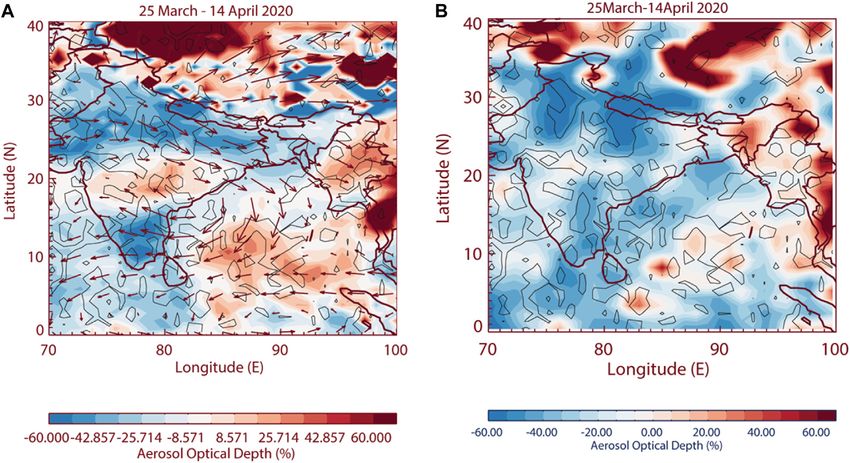
Bhawar et al.                                                                                             Aerosol Radiative Impacts During COVID-19

caused 8.8% of the total deaths (Report by Indian Council of               that the smoke aerosols formed a layer of nearly 3–4 km that
Medical Research, 2017; IHME Report, 2019). Other than                     caused atmospheric heating and affected the radiative forcing
anthropogenic sources, smog events have proven fatal during                over India. The results are derived from satellite observations
the last decade (Spears et al., 2019; Pandey and Vinoj, 2021).             (MODIS, OMI, CALIPSO) and CAMS reanalysis during
    Aerosol pollution over the Indian region is attributed to              March–April 2020. The paper is organized as follows: data
economic development, traffic emissions, and land-use changes               and methodology are described in Section 2, results and
(Fadnavis et al., 2013; Guttikunda et al., 2014; Hama et al., 2020).       discussions are given in Section 3, and conclusion are made in
Aerosol Radiative Forcing over India (ARFI) net observations               Section 4.
show the rate of increase at 2.3% per year in aerosol loading over
India (Krishna Moorthy et al., 2013). Pollution levels over urban
and rural regions are equally high (Dey et al., 2012; Hammer et al.,       2 DATA AND METHODOLOGY
2020). According to the Intergovernmental Panel on Climate
Change (IPCC, 2014), India contributes ∼38–78% to the                      2.1 Satellite Retrievals
anthropogenic aerosol global mean and 3–9% to biomass-                     High-resolution vertical profiles of clouds and aerosols were
burning aerosol (David et al., 2019; IPCC, 2014). Agricultural             obtained from the Cloud-Aerosol Lidar and Infrared
fires and crop residue activity during winter/spring cause a                Pathfinder Satellite (CALIPSO) (Winker et al.,2010; Winker
substantial increase (43%) in aerosol loading over North India             et al., 2007). The CALIPSO payload, polarization-sensitive
(Jethva et al., 2019; Fadnavis et al., 2021).                              backscatter lidar, known as the Cloud-Aerosol Lidar with
    The novel coronavirus (COVID-19) made its first appearance              Orthogonal Polarization (CALIOP), operates at 532 and
in December 2019 and quickly spread all over the world                     1,064 nm wavelengths. The CALIPSO satellite has been
(Fadnavis et al., 2021). Transmission during the COVID-19                  observing the vertical distribution of aerosols since June 2006.
pandemic outbreak was facilitated by certain atmospheric                   The primary instrument on CALIPSO is CALIOP, a nadir-
conditions and pollutants (Lolli et al., 2020; Lolli and Vivone,           viewing dual-wavelength (532 and 1,064 nm) dual polarization
2020; Jiang et al., 2021). To restrict the spread of COVID-19,             at 532 nm, elastic back-scatter lidar (Hunt et al., 2009). Level 2
lockdown measures were imposed in January in China, and later              algorithms detect features, assign type classification for aerosols,
in other countries all over the world (Chauhan and Singh, 2020;            and retrieve extinction coefficients from the attenuated
Paital, 2020; Yunus et al., 2020). India confirmed its first case on         backscattered signals. The extinction algorithm retrieves
January 30, 2020, and later COVID-19 spread started rising                 vertical profiles of extinction, reported separately for aerosols
exponentially. To strengthen the health infrastructure and                 and clouds. Aerosol extinction is not reported within clouds
restrict the spread of COVID-19, the Indian government                     because the lidar signals are dominated by cloud scattering and so
imposed a Janata curfew on March 22, 2020 and, after that, a               atmospheric features are classified as either aerosols or clouds and
complete lockdown between March 25–April 14, 2020 (Chauhan                 the retrieved extinction is reported for only one or the other. The
and Singh, 2020).                                                          aerosol profile product combines the profiles retrieved within
    The lockdown measures implemented at government level,                 aerosol layers to report vertical profiles of extinction coefficients
e.g., restrictions on public transport, freights flights, shutting          at 5 km horizontal resolution. The vertical resolution is 60 m
down industries, etc. reduced the aerosol optical depth (AOD)              from 0.5 to 20.2 km and 180 m above 20.2 km. For the 5 km along
in different parts of the globe (Le Quéré et al., 2020; Kaskaoutis         CALIPSO track horizontal averaging, 15 consecutive level 1 B
et al., 2021). The MODIS observations showed an ∼40%                       profiles are used (Tackett et al., 2018). The lidar ratios and their
reduction in aerosols over North India (Gautam, 2020; Jain                 uncertainties for several of the aerosol subtypes have been revised
and Sharma, 2020; Fadnavis et al., 2021). The in-situ                      in version 4 (Kim et al., 2018). It is said that the reductions in the
observations over Kanpur, a station in North India, showed a               relative uncertainties associated with the improved lidar ratios
reduction of 20–30% of AOD compared to 2017–2019 (Shukla                   will reduce the relative uncertainties in the retrieved extinction
et al., 2020). A drop in AOD by 0.16 over the entire Indian                coefficients and optical depths. These improved lidar ratios in V4
landmass was reported by Mishra and Rathore (2021). There was              are a better representative of actual conditions than in previous
a substantial decrease of ∼35% in the PM2.5 concentrations                 data releases (Young et al., 2018). Here, in the present study, we
across the cities in the Indo-Gangetic belt (Das et al., 2021).            used the level 2 version 4.10/4.20 CALIPSO aerosol profile (APro)
However, there was an increase in AOD over south India (Le                 data for the period 2010–2020 (https://asdc.larc.nasa.gov/project/
Quéré et al., 2020; Pandey and Vinoj 2021). The aerosol                    CALIPSO). The details of the lidar ratio selection algorithm are
enhancement over South India is linked to local biomass                    well documented by Kim et al. (2018). We used the extinction
burning activity (Singh et al., 2020; Sanap, 2021).                        profiles of aerosol and the optical depth for dust and elevated
    In this paper, we report how the aerosol vertical distribution         smoke aerosols at 532 nm. These extinction profiles were used to
impacted the heating rates and radiative forcing over India during         calculate the aerosol optical depth profiles at pre-defined altitudes
the lockdown period of March 25–April 14, 2020. Our analysis               including higher numbers in the altitude-range 1–10 km. We
shows a decrease in AOD over North India and enhancement                   gridded these profiles at a 1× 1 degree resolution.
over Central India (78°E–85°E, 18°N–25°N). The aerosol                        The aerosol optical depth data obtained from the Moderate
enhancement over central India is due to large amounts of                  Resolution Imaging Spectroradiometer (MODIS) were also
fires associated with agricultural activities. Further, we show             analyzed to understand aerosol variations over India. The

Frontiers in Environmental Science | www.frontiersin.org               2                                  September 2021 | Volume 9 | Article 746090
Bhawar et al.                                                                                              Aerosol Radiative Impacts During COVID-19

MODIS sensor measures radiances at 36 bands, ranging from                   and Lacis, 1996; Hess et al., 1998). Catalog-based physical and
visible to infrared and varying spatial resolutions. Here, we used          optical models are embedded in the code (Gu et al., 2011). The
daily AOD at 550 nm from the MODIS (MOD08_D3) collection                    number of levels of the RT model is adjusted to match CALIOP
6.1 level 3, combined dark target and deep blue, from 2010 to               lidar resolution, i.e., the RT model and the vertically resolved lidar
2020 (Hsu et al., 2013; Levy et al., 2013; Wei et al., 2019a; Wei           optical depth observation will have the same spatial resolution.
et al., 2019b) (https://giovanni.gsfc.nasa.gov/giovanni). The past          The total aerosol radiative forcing is computed adding all
studies show that CALIPSO AOD is biased towards lower values                contributions (in terms of optical depth) from the different
as compared to MODIS (Kim et al., 2013). Kittaka et al. (2011)              aerosol species identified by the CALIPSO classification
found that the biases between them vary with season and are                 algorithm in the considered region and matched with the
higher over land than ocean. The observed biases may due to                 corresponding FLG aerosol species (Tosca et al., 2017).
various reasons, e.g., MODIS has a higher frequency than                        From CALIOP data, among the 18 aerosol types parameterized
CALIPSO (Ma et al., 2013).                                                  within the FLG RT model from the OPAC catalog, we considered
   We also analyzed Absorbing Aerosol Index (AAI) from the                  only the main two types of interest that match the CALIPSO
Ozone Monitoring Instrument (OMI) launched in 2004 (Torres                  classification: transported dust (CALIPSO: “dust”) and black
et al., 2007). The level 3 data for the period 2010–2020 were               carbon (CALIPSO: “smoke”). To compute the radiative forcing
obtained from http://giovanni.gsfc.nasa.gov/giovanni/. MODIS                at the top of the atmosphere and at the surface, the FLG RT model,
fire data (https://firms.modaps.eosdis.nasa.gov/active_fire/)                  which also accounts for aerosol hygroscopicity, solves the radiative
were used to plot the location of fires during March–April                   fluxes at each level for 18 spectral bands (12 short-wave, 6 long-
2020. The fire data with a confidence level above 80 were used                wave, Fu and Liou, 1992; Fu and Liou, 1993). Nevertheless, an
to locate the fires.                                                         important source of error (potential) is represented by Version 4
                                                                            CALIOP aerosol types parameterization into FLG RT. The
2.2 Reanalysis Data Sets                                                    CALIPSO classification algorithm is not able to distinguish
We also used the Copernicus Atmosphere Monitoring Service                   between local urban pollution and an advected smoke aerosol
(CAMS) near-real-time observations of the location and intensity            layer from distant sources that descend below 2.5 km. However, it
of active fires to estimate the emissions of pollutants. The                 is reasonable to suppose that those episodes are infrequent, but
Copernicus Atmosphere Monitoring Services (CAMS) uses                       they can still occasionally introduce a bias in the analysis. For each
wildfire as a general term to describe active vegetation fires                annually averaged lidar extinction profile used as input in the FLG
detectable by the satellite. This also includes forest, grassland           code, the aerosol direct radiative forcing (DRF) at the bottom of the
and peat fires, and open burning of agricultural waste (https://             atmosphere (surface) and top of the atmosphere (TOA) and the
atmosphere.copernicus.eu/fire-monitoring). We referred to it as              vertically resolved heating rate (HR) are computed. These estimates
fires since during the lockdown period fires were mostly from                 are obtained by subtracting the net radiative flux when the aerosols
agricultural burning. CAMS estimates are based on the Global                are present in the atmosphere from the net radiative flux obtained
Fire Assimilation System (GFAS). We also used the CAMS-                     during pristine conditions, as shown in the following equation:
derived fluxes of black carbon, organic carbon, total carbon,
sulphate, ammonia, and particulate matter that have a                                       DRF, HR  FLGTotalSky − FLGPristine
diameter of less than 2.5 μm (PM2.5) for the period                             The other data that are needed as input to the FLG model
2010–2020 (https://apps.ecmwf.int/datasets/data/cams-gfas/).                (i.e., the temperature, the atmospheric thermodynamic variable
   It should be noted that the horizontal resolution of all data sets       profiles, the ozone concentration, and the mixing ratio) are
used in this study (CALIPSO, MODIS, OMI, CAMS) is 1× 1                      obtained from the tropical standard atmosphere (USS976).
degree and for the period 2010–2020. We show changes in AOD,                The FLG radiative transfer model also needs the Solar Zenith
dust optical depth, and elevated smoke optical depth during the             Angle (SZA) for the computation. We use SZA for each box at
lockdown period in comparison to climatology (2010–2019). To                noon local time of the 15th day of that month. Following the
check whether these changes are significantly different than                 approach used in Landi et al. (2021), we applied a constant
climatology, we apply two-sided Student’s t-test (Zimmerman,                (wavelength-independent) albedo value of 0.12 for urban
1987; Walpole and Raymond, 2006). If the p-value is less than               environments, 0.15 for vegetated areas, and 0.37 for desertic
0.05 (95% significance level), then we reject the null hypothesis            regions (obtained integrating the hemispherical directional
and conclude that the differences are significant.                           reflectance, Strahler et al., 1999) while the infrared surface
                                                                            emissivity is set to a constant value of 0.98.
2.3 Radiative Transfer Model
The direct aerosol radiative forcing and heating rate are assessed
through the one-dimensional parallel plane Fu-Liou-Gu (FLG)                 3 RESULTS AND DISCUSSIONS
Radiative Transfer (RT) model (Fu and Liou, 1992; Fu and Liou,
1993; Gu et al., 2003; Gu et al., 2011; Lolli et al., 2019). The FLG        3.1 Impact on Aerosol Optical Depth
RT code is initialized with the lidar vertically resolved CALIPSO           A significant reduction in AOD (∼40%) over Western and
optical depth profiles corresponding to the different aerosol                Northern India during the lockdown period is evident from
species, which were matched to the Optical Properties of                    MODIS observations (Figure 1A). A similar reduction (a drop
Aerosol and Clouds (OPAC) (D’Almeida et al., 1991; Tegen                    of ∼45% in AOD with respect to climatology 2010–2019) is also

Frontiers in Environmental Science | www.frontiersin.org                3                                  September 2021 | Volume 9 | Article 746090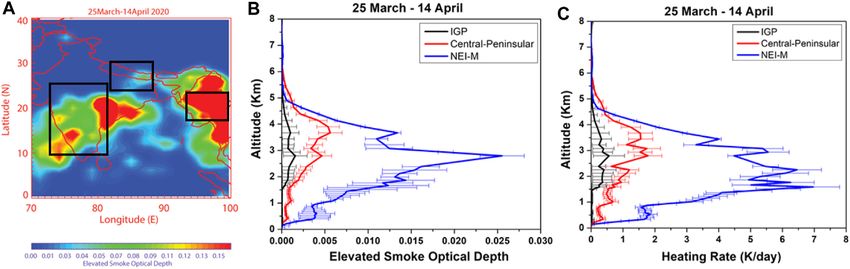
Bhawar et al. Aerosol Radiative Impacts During COVID-19
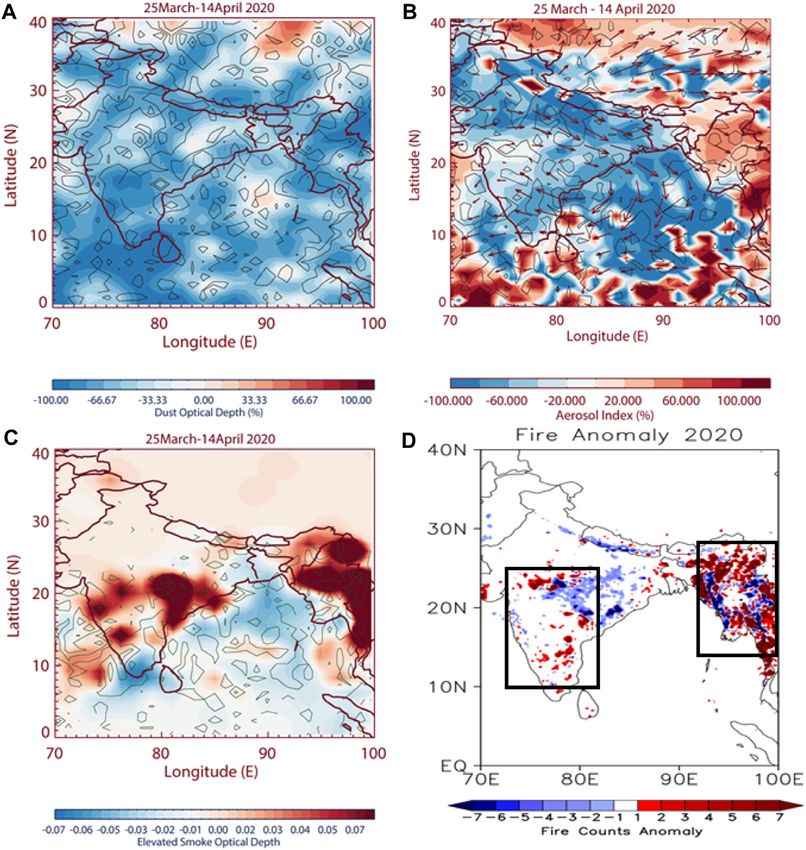
FIGURE 1 | (A) Spatial distribution of changes in AOD (2020-climatology) from MODIS at 550 nm (%) and wind vectors at 850 hPa averaged for the lockdown
period (March 25–April 14, 2020) are also shown in (A), (B) same as (A) but changes in AOD (2020-climatology) from CALIPSO at 532 nm. Contours in Panels (A,B)
indicate 90% significance level.
showed by CALIPSO measurements over this region during the associated with transport from the Indian region (Nair et al.,
same period (Figure 1B). Recently, other studies also reported 2016). The aerosol enhancement over the Arabian Sea is due to
aerosol reduction over the parts of the Indian region during the transport from West Asia (Lau and Kim 2006). During spring,
lockdown period, e.g., Pathakoti et al. (2021) showed a decrease in westerly winds transport dust from West Asia to the Arabian Sea
AOD over the Indo-Gangetic plain by ∼24% (climatology (Vinoj et al., 2014; Fadnavis et al., 2017b). However, in spring
2015–2019) using MODIS data. While a study by Sanap 2020 dust transport from West Asia was suppressed (Fadnavis
(2021) showed a reduction of aerosols (∼16–27%) over north et al., 2021). A small enhancement (5%) in AOD over the Arabian
India (climatology 2000–2020). Mishra and Rathore (2021) also Sea may be due to the transport of small amounts of dust and
reported an overall decrease in AOD by 60% (in comparison to biomass-burning aerosols from Saudi Arabia (Figure 1A)
2019) over the Indian landmass. (Discussed in Section 3.2). The enhancement in AOD over
MODIS AOD (Figure 1A) shows enhancement (5–30%) over the Bay of Bengal (85°E–95°E, 0°N–10°N) is smaller in
central India but it is faintly seen in CALIPSO (Figure 1B). It may CALIPSO measurements than MODIS (Figure 1B) and no
be due to limited CALIPSO data (every 16 days overpass at the enhancement is seen over the Arabian Sea. It may be due to
same location) during the lockdown period (Winker et al., 2007). limited CALIPSO data as mentioned above.
The AOD enhancement over central India may be associated with
aerosols emitted from fires (see discussions in Section 3.2).
Interestingly, enhancement in AOD is also seen over the Bay 3.2 Distribution of Dust and Smoke Aerosols
of Bengal (12%) and parts of the North Arabian Sea (∼22°N) (5%) During Lockdown Period
in MODIS data (Figure 1A). The atmospheric circulation (wind We understand the influence of dust transport from West Asia on
at 850 hPa) indicates that aerosol loading over the Bay of Bengal is the Indian region which occurs in spring (Lau and Kim 2006),
associated with transport from India and Myanmar regions. here we show the changes in dust during the lockdown period
During spring, anthropogenic and dust aerosols are using CALIPSO measurements of dust optical depth and the OMI
transported from the Indo-Gangetic Plain and Myanmar aerosol index (OMI-AAI). The OMI-AAI over the deep inland
region to the Bay of Bengal (Nair et al., 2016). In agreement area indicates dust aerosols (Brooks et al., 2019). The CALIPSO
with our results, past studies show evidence of anthropogenic dust optical depth and OMI-AAI shows a reduction of ∼30% over
(Satheesh et al., 2001; Kumar et al., 2014; Nair et al., 2016) and the Indian region (Figures 2A,B). The Arabian Sea and Bay of
dust (Lakshmi et al., 2017) aerosol loading over the Bay of Bengal Bengal regions show a widespread decrease (∼20%) with pockets
during the spring season. Trajectory analysis-based studies also of a small enhancement in dust optical depth (∼14%) and OMI-
show that anthropogenic aerosols over the Bay of Bengal are AAI (∼20%) (Figures 2A,B). It shows that during the lockdown
Frontiers in Environmental Science | www.frontiersin.org 4 September 2021 | Volume 9 | Article 746090Bhawar et al. Aerosol Radiative Impacts During COVID-19 FIGURE 2 | (A) Spatial distribution of changes in dust optical depth (%) from CALIPSO at 532 nm, (B) spatial distribution of changes in OMI aerosol index (%), (C) same as (A) but for CALIPSO elevated smoke optical depth at 532 nm, (D) changes in fire counts distribution (2020-climatology) from MODIS. All the datasets are from the lockdown period March 25 to April 14. Contours in Panels (A–C) indicate a 95% significance level. Boxes (10°N–25°N; 72°E–81°E) in Panel (D) indicate the location of large numbers of fire anomalies. period, in spring 2020, transport of dust from West Asia was may be due to the presence of local fires as well as the long- lower than the climatology. The model simulations for COVID- range transport of biomass-burning aerosols. A striking feature 19 anthropogenic emission changes also showed a reduction of seen in Figure 2C is a large enhancement (an increase of 0.08–0.1 dust aerosols over the Arabian Sea in the spring of 2020. These with respect to climatology) in elevated smoke optical depth over simulations showed that the anthropogenic emission reductions 1) the central peninsular (72°E–81°E, 10°N–25°N), 2) North-East- had induced changes in atmospheric circulation that inhibited the India-Myanmar region (93°E–100°E, 15°N–25°N), and a part of transport of dust from West Asia to the Tibetan Plateau during IGP (81°E–88°E, 26°N–31°N. Also, a high amount of smoke AOD spring 2020 (Fadnavis et al., 2021). is seen over eastern parts of central India (15°N–24°N; 77°E–82°E). Further, we show anomalies in the vertical distribution of Other parts of India also show a small enhancement in smoke elevated smoke aerosols from the CALIPSO measurements optical depth that is substantially less than over the central during the lockdown period in Figure 2C. The elevated smoke peninsula, eastern-central India, and the North-East-India- is a name of a CALIPSO product for smoke layers with tops Myanmar region (positive anomalies 0.02–0.03) above two higher than the 2.5 km above the planetary boundary layer regions. Smoke aerosols may be associated with the fire events (McGrath-Spangler and Denning 2013; Kim et al., 2018). It hence we show anomalies of MODIS fire during the lockdown shows positive anomalies over different parts of India that period (Figure 2D). Figure 2D shows negative anomalies over Frontiers in Environmental Science | www.frontiersin.org 5 September 2021 | Volume 9 | Article 746090
Bhawar et al.                                                                                                             Aerosol Radiative Impacts During COVID-19

 FIGURE 3 | (A–F): Fire flux (kg m−2 s−1) data for black carbon, organic carbon, total carbon, ammonia, sulfur dioxide, and particulate matter (PM2.5) for the
 lockdown period.

North India (blue color) and positive anomalies over southern                         dense fires during the lockdown (central peninsular and the
India, the Northeast-India-Myanmar region, and over central                           North-East-India-Myanmar region). The positive anomalies of
India (indicated by boxes in Figure 2D). The regions of dense fire                     fire fluxes over southern India (Figure 3) are collocated with
are collocated with higher amounts of smoke optical depth                             MODIS fire location (Figure 2D). This confirms that the increase
(Figure 2C). The contribution to elevated smoke aerosol                               in anomalous aerosol loading over 1) the central peninsular and
optical depth over central India is due to these local fires as                        2) North-East-India-Myanmar region is due to fire emissions.
well as the transport of smoke aerosols emitted from the                              Figures 1–3 show that, although the contribution of
surrounding regions. High amounts of smoke anomalies over                             anthropogenic aerosols had reduced, the smoke aerosols over
the eastern parts of central India are due to transport (see                          the central peninsular and North-East-India-Myanmar region
circulation in Figure 2B) and not directly emitted by the fires,                       caused an enhancement in AOD over these regions (Figures
since the fire anomalies are negative over eastern parts of central                    1A,B, 2C,D).
India. Higher amounts of smoke aerosols (positive anomalies
0.04–0.06) are seen over the Arabian Sea. The wind vectors                            3.4 Heating Rate and Radiative Forcing
indicate this enhancement is due to transport from central                            Carbonaceous aerosols are key components of smoke that absorb
India (Figure 2C).                                                                    solar radiation producing local atmospheric heating (Galanter
                                                                                      et al., 2000; Zhang et al., 2020), while they produce a cooling effect
                                                                                      on the climate via inhibiting solar radiation from reaching the
3.3 Distribution of Fire Fluxes During                                                surface (Shawki et al., 2018; Fadnavis et al., 2019b). During the
Lockdown Period                                                                       lockdown period, enhanced smoke aerosols may have affected
In this section, we show anomalies in the fire fluxes of black                          atmospheric heating. Here, we deliberate on heating rates and
carbon, organic carbon, ammonia, sulfur dioxide, particulate                          radiative forcing estimated from elevated smoke optical depth/
matter (PM2.5), and total carbon aerosols during the                                  profiles averaged for the lockdown period.
lockdown period (Figures 3A–F). Regions of positive                                       Figure 4A shows the spatial distribution of elevated smoke
anomalies (>1.5) are referred to as emission hotspots. The                            optical depth from CALIPSO at 532 nm during the lockdown
emission hotspots for organic carbon, black carbon, ammonia,                          period. It shows a high amount of elevated smoke optical depth
sulphur dioxide fluxes (leads to the formation of sulfate aerosols),                   (Figure 2C), over 1) the central-peninsular region and 2)
and particulate matter (PM 2.5) are collocated with the regions of                    Northeast-India-Myanmar region, and low smoke optical

Frontiers in Environmental Science | www.frontiersin.org                          6                                      September 2021 | Volume 9 | Article 746090
Bhawar et al. Aerosol Radiative Impacts During COVID-19 FIGURE 4 | (A) Spatial distribution of elevated smoke optical depth from CALIPSO, (B) profiles of elevated smoke optical depth averaged over the central peninsular, Northeast-India-Myanmar region, and IGP, (C) same as (B) but for heating rate (K/day). The horizontal lines in Panels (B,C) indicate standard deviation. depth in 3) the IGP (depicted in Figure 4A by boxes). The high aerosols. Strong warming is seen locally in the altitudes values of elevated smoke optical depth are also seen over eastern corresponding to higher amounts of elevated smoke optical parts of central India due to transport (discussed in Section 3.2). depth. Also, a large increase in the heating rates is noticed Further we show vertical distribution of elevated smoke optical below the peak in the smoke aerosol profile. For example, a depth at the above three regions. There is a significant peak in heating rates over the central peninsular is seen at 3 km enhancement in elevated smoke aerosol optical depth (0.002 ± while smoke aerosols show a peak at 3.8 km. Similarly, over the 0.001 to 0.0065 ± 0.002) in the lower troposphere (2–5 km) Northeast-India-Myanmar region, heating rates are maximum at over the central-peninsular region and (0.008 ± 0.001 to 2.2 km while the aerosol profile has a peak at 2.8 km. This indicates 0.025 ± 0.003) over the Northeast-India-Myanmar region. The that the peak in smoke aerosols and heating rates occurs at different enhancement over the IGP is significantly less than the above- altitudes. This may be due to aerosol heating occurring within a mentioned two regions due to comparatively fewer fires over the layer of atmosphere that retains and changes pressure values IGP. Interestingly, all three regions show an elevated layer of (Tripathi et al., 2007). Past studies showed enhancement in smoke aerosols between altitudes 2–5 km. The elevated layers of carbonaceous aerosols and increases in the heating rates by smoke aerosols corroborate well with the regions of high aerosol 0.08 K/day in the lower troposphere over India (Fadnavis et al., optical depths observed over the central-peninsular and 2017a). The annual mean atmospheric heating rate due to the BC Northeast-India-Myanmar regions (Figure 3). Our analysis aerosols was 0.86 K/day over the Guwahati region during 2014. shows that the mean contribution due to elevated smoke Pani et al. (2018) estimated atmospheric heating of ∼1.4–3.6 K/day aerosols to altitudes ranging from 2 to 5 km is ∼57% of the due to biomass-burning aerosols in the dry season over a station in total columnar optical depth over the central peninsular and southeast Asia. ∼68% over the Northeast-India-Myanmar region. While elevated Aerosol radiative forcing is defined as the net radiative change smoke aerosols over the IGP contributed ∼18% to columnar by aerosols present in the Earth system. Aerosols significantly optical depth the during lockdown period. Sarangi et al. (2016) impact the regional climate and this phenomenon has been reported the mean contribution of the aerosol layer from a largely studied (IPCC, 2014; Vinoj et al., 2014; Fadnavis et al., 1.5–5.5 km altitude as ∼51–60% to the total columnar aerosol 2019a). Decoupling the elevated smoke aerosol optical depth optical depth for the years 2009–2011 during May–June over from the atmospheric column, we estimate the biomass burning Kanpur. radiative forcing at the surface and top of the atmosphere (TOA) Figure 4C shows profiles of heating rate estimated from over 1) the central peninsular, 2) Northeast-India-Myanmar CALIPSO observations of elevated smoke aerosols over 1) the region, and 3) Indo-Gangetic Plain averaged for the lockdown central peninsular, 2) Northeast-India-Myanmar region, and 3) period (Figure 5). The estimated radiative forcing at the TOA IGP. Heating rate profiles over the Northeast-India-Myanmar shows warming of ∼4.8 W/m2 over the central-peninsular region, region show a higher amount of heating than over the central- ∼15 W/m2 over the Northeast-India-Myanmar region, and peninsular region of India. It is quite evident that high amounts of ∼1 W/m2 over the IGP. The lower-tropospheric warming elevated smoke aerosols during lockdown at altitudes between 2 caused by elevated smoke aerosols has an implication on and 5 km over the central peninsular have produced significant atmospheric circulation and cloud cover (Fadnavis et al., heating at 1.6 K/day ±0.5 K/day at those altitudes and ∼6.5 K/day 2017b; Fadnavis et al., 2019b). ±0.5 K/day heating over the Northeast-India-Myanmar region. The estimated surface radiative forcing due to smoke aerosols The IGP region shows comparatively less heating at ∼0.5 K/day over the central-peninsular region is ∼−38 W/m2 (±15 W/m2), ±0.3 K/day at those altitudes due to smaller amounts of smoke ∼−152 W/m2 (±50 W/m2) over the North-India-Myanmar Frontiers in Environmental Science | www.frontiersin.org 7 September 2021 | Volume 9 | Article 746090
Bhawar et al.                                                                                                    Aerosol Radiative Impacts During COVID-19

                                                                                   Infrared Pathfinder (CALIPSO), and Copernicus Atmosphere
                                                                                   Monitoring Service (CAMS) during the lockdown period,
                                                                                   March 25–April 14, 2020, showed that aerosols, in general,
                                                                                   had reduced over north India, but there was an aerosol
                                                                                   enhancement over central India and the Northeast-India-
                                                                                   Myanmar region. This aerosol enhancement was due to fires.
                                                                                   The fire-emitted smoke aerosols formed a layer at altitudes
                                                                                   ranging from 2 to 5 km with subsequent enhancement in the
                                                                                   aerosol optical depth of 0.002–0.005 over the central peninsular
                                                                                   and 0.008–0.025 over the Northeast-India-Myanmar region. The
                                                                                   fires and smoke aerosols, both, were comparatively less over
                                                                                   the IGP.
                                                                                       Elevated smoke aerosols have produced heating locally in the
                                                                                   altitudes corresponding to the higher amount of elevated smoke
                                                                                   optical depth. Also, a large increase in the heating rates is
                                                                                   noticed below the peak in the smoke aerosol profile. For
                                                                                   example, a peak in heating rates over central India is seen at
                                                                                   3 km while smoke aerosols show a peak at 3.5 km. Similarly,
                                                                                   over the Northeast-India-Myanmar region, heating rates were
 FIGURE 5 | Radiative forcing at the top of the atmosphere (TOA) and at            maximum at 2.2 km while aerosol profiles peaked at 2.8 km. In
 the surface over central India, the Northeast-India-Myanmar region (NEI-M),       general, heating of ∼1.6 K/day is seen over the central peninsula,
 and IGP. Vertical bars indicate standard deviation.                               ∼6 K/day over the Northeast-India-Myanmar region, and
                                                                                   ∼0.3 K/day over the IGP. The smoke aerosols produced
                                                                                   significant radiative impacts, warming effects at the top of
region, and ∼−8 W/m2 (±9 W/m2) over the IGP. The amount of                         the atmosphere, radiative forcing of ∼4.8 W/m2 in the central
radiative forcing at the TOA (positive) and surface (negative) over                peninsula and ∼15 W/m2 in the Northeast-India-Myanmar
the three regions is proportional to the amount of smoke aerosol,                  region. The radiative forcing over the IGP was comparatively
e.g., a large amount of smoke aerosols in the North-India-                         less (1 W/m2) than the other two regions. A layer of smoke
Myanmar region has imposed higher radiative impacts there                          aerosol had produced a cooling effect at the surface over the
than in the central peninsula and IGP (higher amount of                            Indian region (surface radiative forcing of ∼−38 W/m2 over the
surface cooling and warming at the TOA). All the three regions                     central peninsula, ∼ −152 W/m2 over the Northeast-India-
show warming in the atmosphere (in-atmospheric radiative                           Myanmar region, and −8 W/m2 over the IGP) and warming
forcing, TOA-surface), central India: ∼73 W/m2 (±40 W/m2),                         in the atmosphere (central peninsula: ∼42.8 W/m2 (±15W/m2),
North-India-Myanmar region: ∼167 W/m2 (±50 W/m2), and                              North-India-Myanmar region: ∼167 W/m2 (±50 W/m2), and
IGP: ∼9 W/m2 (±9 W/m2).                                                            IGP: ∼9 W/m2 (±9 W/m2). Thus, our study shows that
    A previous study also showed positive radiative forcing due to                 significant atmospheric warming was produced by the smoke
black carbon aerosols at the top of the atmosphere (∼5 W/m2 over                   produced from fires, although anthropogenic aerosols were
Bangalore, ∼9.5 W/m2 over Guwahati), negative radiative forcing                    reduced during the lockdown period. Atmospheric warming
at the surface (∼−23 W/m2 over Bangalore and ∼−21.1 W/m2                           has implications on circulation and precipitation (Fadnavis
over Guwahati), and in-atmospheric warming (∼27 W/m2 ± 9 W/                        et al., 2021) and heats the lower atmosphere which causes in-
m2 over the Indian region) (Babu et al., 2002; Tiwari et al., 2016;                cloud heating and changes in cloud albedos.
Nair et al., 2017).
    Importantly, these studies show that smoke/carbonaceous
aerosols produce positive radiative forcing at the top of the                      DATA AVAILABILITY STATEMENT
atmosphere, negative radiative forcing at the surface, and in-
atmospheric warming is agreement with our results. The                             The original contributions presented in the study are included in
atmospheric heating generated by smoke aerosols has                                the article/Supplementary Material, further inquiries can be
implications on atmospheric circulation and cloud cover while                      directed to the corresponding author.
the surface cooling might have effects on the precipitation
changes (Lohmann and Feichter, 2005; Ward et al., 2012).
                                                                                   AUTHOR CONTRIBUTIONS
4 CONCLUSION                                                                       This article is the combined effort of all the authors. RB and SF
                                                                                   formulated and wrote the article, with contributions from all co-
Diagnostic analysis of multiple data sets from Moderate                            authors. VK, PR, TS, and SL contributed to the analysis. SL
Resolution Imaging Spectroradiometer (MODIS), Ozone                                carried computation of heating rates and radiative forcing using a
Monitoring Instrument (OMI), Cloud-Aerosol Lidar, and                              radiative transfer model.

Frontiers in Environmental Science | www.frontiersin.org                       8                                September 2021 | Volume 9 | Article 746090
Bhawar et al. Aerosol Radiative Impacts During COVID-19
ACKNOWLEDGMENTS providing a WISTEMM Fellowship when the work was initiated.
She also acknowledges the Ministry of Earth Sciences (MoES) as
The authors thank all the reviewers for useful comments which the data used and analyzed to prepare the paper were funded from
helped improve the paper drastically. The author RB acknowledges this project. The UGC-FRP. CALIPSO, MODIS, OMI, and CAMS
with gratitude the Department of Science and Technology (DST), database teams and NASA websites from where data were
GoI, and Indo-US Science and Technology Forum (IUSSTF) for downloaded are also acknowledged.
Fu, Q., and Liou, K. N. (1993). Parameterization of the Radiative Properties of
REFERENCES Cirrus Clouds. J. Atmos. Sci. 50, 2008–2025. doi:10.1175/1520-0469(1993)
0502.0.co;2
Babu, S. S., Satheesh, S. K., and Moorthy, K. K. (2002). Aerosol Radiative Forcing Galanter, M., Levy, H., and Carmichael, G. R. (2000). Impacts of Biomass Burning
Due to Enhanced Black Carbon at an Urban Site in India. Geophys. Res. Lett. on Tropospheric CO, NOx, and O3. J. Geophys. Res. 105, 6633–6653.
29), 1880. doi:10.1029/2002GL015826 doi:10.1029/1999jd901113
Brooks, J., Allan, J. D., Williams, P. I., Liu, D., Fox, C., Haywood, J., et al. (2019). Gautam, S. (2020). COVID-19: Air Pollution Remains Low as People Stay at home.
Vertical and Horizontal Distribution of Submicron Aerosol Chemical Air Qual. Atmos. Health 13, 853–857. doi:10.1007/s11869-020-00842-6
Composition and Physical Characteristics across Northern India during Pre- Gu, Y., Farrara, J., Liou, K. N., and Mechoso, C. R. (2003). Parameterization of
monsoon and Monsoon Seasons. Atmos. Chem. Phys. 19, 5615–5634. Cloud-Radiation Processes in the UCLA General Circulation Model. J. Clim. 16,
doi:10.5194/acp-19-5615-2019 3357–3370. doi:10.1175/1520-0442(2003)0162.0.co;2
Chauhan, A., and Singh, R. P. (2020). Decline in PM2.5 Concentrations Over Gu, Y., Liou, K. N., Ou, S. C., and Fovell, R. (2011). Cirrus Cloud Simulations Using
Major Cities Around the World Associated with COVID-19. Environ. Res. 187, WRF with Improved Radiation Parameterization and Increased Vertical
109634. doi:10.1016/j.envres.2020.109634 Resolution. J. Geophys. Res. 116, D06119. doi:10.1029/2010JD014574
D’Errico, M., Cagnazzo, C., Fogli, P. G., Lau, W. K. M., Hardenberg, J., Fierli, F., Guttikunda, S. K., Goel, R., and Pant, P. (2014). Nature of Air Pollution, Emission
et al. (2015). Indian Monsoon and the Elevated-heat-pump Mechanism in a Sources, and Management in the Indian Cities. Atmos. Environ. 95, 501–510.
Coupled Aerosol-Climate Model. J. Geophys. Res. Atmos. 120, 8712–8723. doi:10.1016/j.atmosenv.2014.07.006
doi:10.1002/2015JD023346 Hama, S. M. L., Kumar, P., Harrison, R. M., Bloss, W. J., Khare, M., Mishra, S., et al.
D’Almeida, G. A., Koepke, P., and Shettle, E. P. (1991). Atmospheric Aerosol: Global (2020). Four-year Assessment of Ambient Particulate Matter and Trace Gases
Climatology and Radiative Characteristics. Hampton, Va: A. Deepak. in theDelhi-NCR Region of India. Sustain. Cities Soc. 54, 102003. doi:10.1016/
Das, M., Das, A., Sarkar, R., Saha, S., and Mandal, A. (2021). Examining the Impact j.scs.2019.102003
of Lockdown (Due to COVID-19) on Ambient Aerosols (PM2.5): A Study on Hammer, M. S., van Donkelaar, A., Li, C., Lyapustin, A., Sayer, A. M., Hsu, N. C.,
Indo-Gangetic Plain (IGP) Cities, India. Stoch Environ. Res. Risk Assess. 35, et al. (2020). Global Estimates and Long-Term Trends of Fine Particulate
1301–1317. doi:10.1007/s00477-020-01905-x Matter Concentrations (1998-2018). Environ. Sci. Technol. 54 (13), 7879–7890.
David, L. M., Ravishankara, A. R., Kodros, J. K., Pierce, J. R., Venkataraman, C., and doi:10.1021/acs.est.0c01764
Sadavarte, P. (2019). Premature Mortality Due to PM2.5Over India: Effect of Hess, M., Koepke, P., and Schult, I. (1998). Optical Properties of Aerosols and
Atmospheric Transport and Anthropogenic Emissions. GeoHealth 3, 2–10. Clouds: The Software Package OPAC. Bull. Amer. Meteorol. Soc. 79, 831–844.
doi:10.1029/2018gh000169 doi:10.1175/1520-0477(1998)0792.0.co;2
Dey, S., Di Girolamo, L., van Donkelaar, A., Tripathi, S. N., Gupta, T., and Mohan, Hsu, N. C., Jeong, M.-J., Bettenhausen, C., Sayer, A. M., Hansell, R., Seftor, C. S., et al.
M. (2012). Variability of Outdoor fine Particulate (PM2.5) Concentration in the (2013). Enhanced Deep Blue Aerosol Retrieval Algorithm: the Second Generation.
Indian Subcontinent: A Remote Sensing Approach. Remote sensing Environ. J. Geophys. Res. Atmos. 118 (16), 9296–9315. doi:10.1002/jgrd.50712
127, 153–161. doi:10.1016/j.rse.2012.08.021 Hunt, W. H., Winker, D. M., Vaughan, M. A., Powell, K. A., Lucker, P. L., and
Fadnavis, S., Sabin, T. P., Rap, A., Müller, R., Kubin, A., and Heinold, B. (2021). The Weimer, C. (2009). CALIPSO Lidar Description and Performance Assessment.
Impact of COVID-19 Lockdown Measures on the Indian Summer Monsoon. J. Atmos. Oceanic Technol. 26, 1214–1228. doi:10.1175/2009JTECHA1223.1
Environ. Res. Lett. 16, 074054. doi:10.1088/1748-9326/ac109c IHME Report (2019). Health and Economic Impact of Air Pollution in the States of
Fadnavis, S., Kalita, G., Kumar, K. R., Gasparini, B., and Li, J.-L. F. (2017b). India: The Global Burden of Disease Study 2019. Lancet Planet. Health 5,
Potential Impact of Carbonaceous Aerosol on the Upper Troposphere and e25–38. doi:10.1016/S2542-5196(20)30298-9
Lower Stratosphere (UTLS) and Precipitation during Asian Summer Monsoon IPCC (2014). Climate Change 2014: Synthesis Report. Contribution of Working
in a Global Model Simulation. Atmos. Chem. Phys. 17, 11637–11654. Groups I, II and III to the Fifth Assessment Report of the Intergovernmental
doi:10.5194/acp-17-11637-2017 Panel on Climate Change. Lancet Planet. Health. Editors R. K. Pachauri and
Fadnavis, S., Müller, R., Kalita, G., Rowlinson, M., Rap, A., Li, J.-L. F., et al. (2019a). L. A. Meyer (Geneva, Switzerland: IPCC), 151.
The Impact of Recent Changes in Asian Anthropogenic Emissions of SO2 on Jain, S., and Sharma, T. (2020). Social and Travel Lockdown Impact Considering
Sulfate Loading in the Upper Troposphere and Lower Stratosphere and the Coronavirus Disease (COVID-19) on Air Quality in Megacities of India:
Associated Radiative Changes. Atmos. Chem. Phys. 19, 9989–10008. Present Benefits, Future Challenges and Way Forward. Aerosol Air Qual.
doi:10.5194/acp-19-9989-2019 Res. 20, 1222–1236. doi:10.4209/aaqr.2020.04.0171
Fadnavis, S., Roy, C., Sabin, T. P., Ayantika, D. C., and Ashok, K. (2017a). Potential Jethva, H., Torres, O., Field, R. D., Lyapustin, A., Gautam, R., and Kayetha, V.
Modulations of Pre-Monsoon Aerosols during El Niño: Impact on Indian (2019). Connecting Crop Productivity, Residue Fires, and Air Quality over
Summer Monsoon. Clim. Dyn. 49, 2279–2290. doi:10.1007/s00382-016-3451-6 Northern India. Sci. Rep. 9 (1), 16594. doi:10.1038/s41598-019-52799-x
Fadnavis, S., Sabin, T. P., Roy, C., Rowlinson, M., Rap, A., Vernier, J.-P., et al. Jiang, Z., Shi, H., Zhao, B., Gu, Y., Zhu, Y., Miyazaki, K., et al. (2021). Modeling the
(2019b). Elevated Aerosol Layer over South Asia Worsens the Indian Droughts. Impact of COVID-19 on Air Quality in Southern California: Implications for
Sci. Rep. 9, 10268. doi:10.1038/s41598-019-46704-9 Future Control Policies. Atmos. Chem. Phys. 21, 8693–8708. doi:10.5194/acp-
Fadnavis, S., Semeniuk, K., Pozzoli, L., Schultz, M. G., Ghude, S. D., Das, S., et al. 21-8693-2021
(2013). Transport of Aerosols into the UTLS and Their Impact on the Asian Kaskaoutis, D. G., Grivas, G., Liakakou, E., Kalivitis, N., Kouvarakis, G., Stavroulas,
Monsoon Region as Seen in a Global Model Simulation. Atmos. Chem. Phys. 13, I., et al. (2021). Assessment of the COVID-19 Lockdown Effects on Spectral
8771–8786. doi:10.5194/acp-13-8771-2013 Aerosol Scattering and Absorption Properties in Athens, Greece. Atmosphere
Fu, Q., and Liou, K. N. (1992). On the Correlatedk-Distribution Method for 12, 231. doi:10.3390/atmos12020231
Radiative Transfer in Nonhomogeneous Atmospheres. J. Atmos. Sci. 49, Kim, M.-H., Kim, S.-W., Yoon, S.-C., and Omar, A. H. (2013). Comparison of
2139–2156. doi:10.1175/1520-0469(1992)0492.0.co;2 Aerosol Optical Depth between CALIOP and MODIS-AQUA for CALIOP
Frontiers in Environmental Science | www.frontiersin.org 9 September 2021 | Volume 9 | Article 746090Bhawar et al. Aerosol Radiative Impacts During COVID-19 Aerosol Subtypes over the Ocean. J. Geophys. Res. Atmos. 118, 13241–13252. Pandey, S. K., and Vinoj, V. (2021). Surprising Changes in Aerosol Loading over doi:10.1002/2013JD019527 India amid COVID-19 Lockdown. Aerosol Air Qual. Res. 21, 200466. Kim, M.-H., Omar, A. H., Tackett, J. L., Vaughan, M. A., Winker, D. M., Trepte, C. doi:10.4209/aaqr.2020.07.0466 R., et al. (2018). The CALIPSO Version 4 Automated Aerosol Classification and Pani, S. K., Lin, N.-H., Chantara, S., Wang, S.-H., Khamkaew, C., Prapamontol, T., Lidar Ratio Selection Algorithm. Atmos. Meas. Tech. 11, 6107–6135. et al. (2018). Radiative Response of Biomass-Burning Aerosols over an Urban doi:10.5194/amt-11-6107-2018 Atmosphere in Northern Peninsular Southeast Asia. Sci. Total Environ. 633, Kittaka, C., Winker, D. M., Vaughan, M. A., Omar, A., and Remer, L. A. (2011). 892–911. doi:10.1016/j.scitotenv.2018.03.204 Intercomparison of Column Aerosol Optical Depths from CALIPSO and Pathakoti, M., Muppalla, A., Hazra, S., Mahalakshmi, D. V., Sagar, K. K. V., MODIS-Aqua. Atmos. Meas. Tech. 4, 131–141. doi:10.5194/amt-4-131-2011 Shekhar, R., et al. (2021). Measurement Report: An Assessment of the Krishna Moorthy, K., Suresh Babu, S., Manoj, M. R., and Satheesh, S. K. (2013). Impact of a Nationwide Lockdown on Air Pollution – a Remote Sensing Buildup of Aerosols over the Indian Region. Geophys. Res. Lett. 40, 1011–1014. Perspective over India. Atmos. chem. Phys. doi:10.5194/acp-21-9047- doi:10.1002/grl.50165 2021 Kumar, R., Barth, M. C., Madronich, S., Naja, M., Carmichael, G. R., Pfister, G. G., Report by Indian Council of Medical Research (2017). ISBN: 978-81-910091-94. et al. (2014). Effects of Dust Aerosols on Tropospheric Chemistry during a Sanap, S. D. (2021). Global and Regional Variations in Aerosol Loading during Typical Pre-monsoon Season Dust Storm in Northern India. Atmos. Chem. COVID-19 Imposed Lockdown. Atmos. Environ. 246, 118132. doi:10.1016/ Phys. 14 (13), 6813–6834. doi:10.5194/acp-14-6813-2014 j.atmosenv.2020.118132 Lakshmi, N. B., Nair, V. S., and Suresh Babu, S. (2017). Vertical Structure of Aerosols Sarangi, C., Tripathi, S. N., Mishra, A. K., Goel, A., and Welton, E. J. (2016). and mineral Dust over the Bay of Bengal from Multisatellite Observations. Elevated Aerosol Layers and Their Radiative Impact over Kanpur during J. Geophys. Res. Atmos. 122, 12,845–12,861. doi:10.1002/2017JD027643 Monsoon Onset Period. J. Geophys. Res. Atmos. 121, 7936–7957. Landi, T., Bonasoni, P., Brunetti, M., Campbell, J., Marquis, J., Di Girolamo, P., doi:10.1002/2015JD024711 et al. (2021). Aerosol Direct Radiative Effects under Cloud-Free Conditions Satheesh, S. K., Moorthy, K. K., and Das, I. (2001). Aerosol Optical Depths Over over Highly-Polluted Areas in Europe and Mediterranean: A Ten-Years Bay of Bengal, Indian Ocean and Arabian Sea. Curr. Sci. 81, 1617–1625. Analysis (2007-2016). Remote Sensing 13 (15), 2933. doi:10.3390/rs13152933 Shawki, D., Voulgarakis, A., Chakraborty, A., Kasoar, M., and Srinivasan, J. Lau, K.-M., and Kim, K.-M. (2006). Observational Relationships between Aerosol (2018). The South Asian Monsoon Response to Remote Aerosols: Global and and Asian Monsoon Rainfall, and Circulation. Geophys. Res. Lett. 33, L21810. Regional Mechanisms. J. Geophys. Res. Atmos. 123, 11585–11601. doi:10.1029/2006GL027546 doi:10.1029/2018JD028623 Le Quéré, C., Jackson, R. B., Jones, M. W., Smith, A. J. P., Abernethy, S., Andrew, R. Shukla, N., Sharma, G. K., Baruah, P., Shukla, V. K., and Gargava, P. (2020). Impact M., et al. (2020). Temporary Reduction in Daily Global CO2 Emissions during of Shutdown Due to COVID-19 Pandemic on Aerosol Characteristics in the COVID-19 Forced Confinement. Nat. Clim. Chang. 10 (7), 647–653. Kanpur, India. J. Health Pollut. 10 (28), 201201. doi:10.5696/2156-9614- doi:10.1038/s41558-020-0797-x 10.28.201201 Levy, R. C., Mattoo, S., Munchak, L. A., Remer, L. A., Sayer, A. M., Patadia, F., et al. Singh, T., Ravindra, K., Sreekanth, V., Gupta, P., Sembhi, H., Tripathi, S. N., et al. (2013). The Collection 6 MODIS Aerosol Products over Land and Ocean. (2020). Climatological Trends in Satellite-Derived Aerosol Optical Depth Atmos. Meas. Tech. 6, 2989–3034. doi:10.5194/amt-6-2989-2013 over North India and its Relationship with Crop Residue Burning: Rural- Lohmann, U., and Feichter, J. (2005). Global Indirect Aerosol Effects: A Review. Urban Contrast. Sci. Total Environ. 748, 140963. doi:10.1016/ Atmos. Chem. Phys. 5, 715–737. doi:10.5194/acp-5-715-2005 j.scitotenv.2020.140963 Lolli, S., Chen, Y.-C., Wang, S.-H., and Vivone, G. (2020). Impact of Meteorological Spears, D., Dey, S., Chowdhury, S., Scovronick, N., Vyas, S., and Apte, J. (2019). Conditions and Air Pollution on COVID-19 Pandemic Transmission in Italy. The Association of Early-Life Exposure to Ambient PM2.5 and Later- Sci. Rep. 10, 16213. doi:10.1038/s41598-020-73197-8 Childhood Height-For-Age in India: an Observational Study. Environ. Lolli, S., Khor, W. Y., Matjafri, M. Z., and Lim, H. S. (2019). Monsoon Season Health 18, 62. doi:10.1186/s12940-019-0501-7 Quantitative Assessment of Biomass Burning Clear-Sky Aerosol Radiative Strahler, A. H., Muller, J., Lucht, W., Schaaf, C., Tsang, T., Gao, F., et al. (1999). Effect at Surface by Ground-Based Lidar Observations in Pulau Pinang, MODIS BRDF/albedo Product: Algorithm Theoretical Basis Document Malaysia in 2014. Remote Sensing 11, 2660. doi:10.3390/rs11222660 Version 5.0. MODIS documentation 23 (4), 42–47. Lolli, S., and Vivone, G. (2020). The Role of Tropospheric Ozone in Flagging Tackett, J. L., Winker, D. M., Getzewich, B. J., Vaughan, M. A., Young, S. A., and COVID-19 Pandemic Transmission. Bull. Atmos. Sci. Technol. 1, 551–555. Kar, J. (2018). CALIPSO Lidar Level 3 Aerosol Profile Product: Version 3 doi:10.1007/s42865-020-00026-1 Algorithm Design. Atmos. Meas. Tech. 11, 4129–4152. doi:10.5194/amt-11- Ma, X., Bartlett, K., Harmon, K., and Yu, F. (2013). Comparison of AOD between 4129-2018 CALIPSO and MODIS: Significant Differences Over Major Dust and Biomass Tegen, I., and Lacis, A. A. (1996). Modeling of Particle Size Distribution and its Burning Regions. Atmos. Meas. Tech. 6, 2391–2401. doi:10.5194/amt-6-2391- Influence on the Radiative Properties of mineral Dust Aerosol. J. Geophys. Res. 2013 101, 19237–19244. doi:10.1029/95jd03610 McGrath-Spangler, E. L., and Denning, A. S. (2013). Global Seasonal Variations of Thomas, A., Sarangi, C., and Kanawade, V. P. (2019). Recent Increase in Winter Midday Planetary Boundary Layer Depth from CALIPSO Space-Borne LIDAR. Hazy Days over Central India and the Arabian Sea. Sci. Rep. 9, 17406. J. Geophys. Res. Atmos. 118, 1226–1233. doi:10.1002/jgrd.50198 doi:10.1038/s41598-019-53630-3 Meehl, G. A., Washington, W. M., Arblaster, J. M., Hu, A., Teng, H., Kay, J. E., et al. Tiwari, S., Hopke, P. K., Attri, S. D., Soni, V. K., and Singh, A. K. (2016). Variability (2013). Climate Change Projections in CESM1(CAM5) Compared to CCSM4. in Optical Properties of Atmospheric Aerosols and Their Frequency J. Clim. 26, 6287–6308. doi:10.1175/JCLI-D-12-00572.1 Distribution over a Mega City "New Delhi," India. Environ. Sci. Pollut. Res. Mishra, M. K., and Rathore, P. S. (2021). Impact of Nationwide COVID-19 23 (9), 8781–8793. doi:10.1007/s11356-016-6060-3 Lockdown on Indian Air Quality in Terms of Aerosols as Observed from Torres, O., Tanskanen, A., Veihelmann, B., Ahn, C., Braak, R., Bhartia, P. K., et al. the Space. Aerosol Air Qual. Res. 21, 200461. doi:10.4209/aaqr.2020.07.0461 (2007). Aerosols and Surface UV Products from Ozone Monitoring Instrument Nair, V. S., Babu, S. S., Gogoi, M. M., and Moorthy, K. K. (2016). Large-scale Observations: An Overview. J. Geophys. Res. 112, D24S47. doi:10.1029/ Enhancement in Aerosol Absorption in the Lower Free Troposphere over 2007JD008809 continental India during spring. Geophys. Res. Lett. 43, 11453–11461. Tosca, M., Campbell, J., Garay, M., Lolli, S., Seidel, F., Marquis, J., et al. (2017). doi:10.1002/2016GL070669 Attributing Accelerated Summertime Warming in the Southeast United States Nair, V. S., Babu, S. S., Manoj, M. R., Moorthy, K. K., and Chin, M. (2017). Direct to Recent Reductions in Aerosol Burden: Indications from Vertically-Resolved Radiative Effects of Aerosols over South Asia from Observations and Modeling. Observations. Remote Sensing 9, 674. doi:10.3390/rs9070674 Clim. Dyn. 49, 1411–1428. doi:10.1007/s00382-016-3384-0 Tripathi, S. N., Srivastava, A. K., Dey, S., Satheesh, S. K., and Krishnamoorthy, K. Paital, B. (2020). Nurture to Nature via COVID-19, a Self-Regenerating (2007). The Vertical Profile of Atmospheric Heating Rate of Black Carbon Environmental Strategy of Environment in Global Context. Sci. Total Aerosols at Kanpur in Northern India. Atmos. Environ. 41, 6909–6915. Environ. 729, 139088. doi:10.1016/j.scitotenv.2020.139088 doi:10.1016/j.atmosenv.2007.06.032 Frontiers in Environmental Science | www.frontiersin.org 10 September 2021 | Volume 9 | Article 746090
Bhawar et al.                                                                                                                           Aerosol Radiative Impacts During COVID-19

Vinoj, V., Rasch, P. J., Yoon, H. J.-H., Landu, P.-L. K., and Singh, B. (2014). Short-              Lockdown. Sci. Total Environ. 731, 139012. doi:10.1016/
   term Modulation of Indian Summer Monsoon Rainfall by West Asian Dust.                            j.scitotenv.2020.139012
   Nat. Geosci. 7, 308–313. doi:10.1038/ngeo2107                                                 Zhang, Y., Li, Z., Chen, Y., de Leeuw, G., Zhang, C., Xie, Y., et al. (2020). Improved
Walpole, R. E., and Raymond, M. H. (2006). Probability & Statistics for Engineers                   Inversion of Aerosol Components in the Atmospheric Column from Remote
   & Scientists. 7th ed. New Delhi: Pearson. ISBN 81-7758-404-9. OCLC                               Sensing Data. Atmos. Chem. Phys. 20, 12795–12811. doi:10.5194/acp-20-12795-
   818811849.                                                                                       2020
Ward, D. S., Kloster, S., Mahowald, N. M., Rogers, B. M., Randerson, J. T., and                  Zimmerman, D. W. (1987). Comparative Power of StudentTTest and Mann-
   Hess, P. G. (2012). The Changing Radiative Forcing of Fires: Global Model                        WhitneyUTest for Unequal Sample Sizes and Variances. J. Exp. Educ. 55 (3),
   Estimates for Past, Present and Future. Atmos. Chem. Phys. 12, 10857–10886.                      171–174. doi:10.1080/00220973.1987.10806451
   doi:10.5194/acp-12-10857-2012
Wei, J., Li, Z., Peng, Y., and Sun, L. (2019a). MODIS Collection 6.1 Aerosol Optical             Conflict of Interest: The authors declare that the research was conducted in the
   Depth Products over Land and Ocean: Validation and Comparison. Atmos.                         absence of any commercial or financial relationships that could be construed as a
   Environ. 201, 428–440. doi:10.1016/j.atmosenv.2018.12.004                                     potential conflict of interest.
Wei, J., Li, Z., Sun, L., Peng, Y., and Wang, L. (2019b). Improved Merge Schemes
   for MODIS Collection 6.1 Dark Target and Deep Blue Combined Aerosol                           Publisher’s Note: All claims expressed in this article are solely those of the authors
   Products. Atmos. Environ. 202, 315–327. doi:10.1016/j.atmosenv.2019.01.016                    and do not necessarily represent those of their affiliated organizations, or those of
Winker, D. M., Hunt, W. H., and McGill, M. J. (2007). Initial Performance                        the publisher, the editors and the reviewers. Any product that may be evaluated in
   Assessment of CALIOP. Geophys. Res. Lett. 34, L19803. doi:10.1029/                            this article, or claim that may be made by its manufacturer, is not guaranteed or
   2007GL030135                                                                                  endorsed by the publisher.
Winker, D. M., Pelon, J., Coakley, J. A., Jr., Ackerman, S. A., Charlson, R. J.,
   Colarco, P. R., et al. (2010). The CALIPSO Mission. Bull. Amer. Meteorol. Soc.                Copyright © 2021 Bhawar, Fadnavis, Kumar, Rahul, Sinha and Lolli. This is an
   91, 1211–1230. doi:10.1175/2010BAMS3009.1                                                     open-access article distributed under the terms of the Creative Commons Attribution
Young, S. A., Vaughan, M. A., Garnier, A., Tackett, J. L., Lambeth, J. D., and Powell, K.        License (CC BY). The use, distribution or reproduction in other forums is permitted,
   A. (2018). Extinction and Optical Depth Retrievals for CALIPSO’s Version 4 Data               provided the original author(s) and the copyright owner(s) are credited and that the
   Release. Atmos. Meas. Tech. 11, 5701–5727. doi:10.5194/amt-11-5701-2018                       original publication in this journal is cited, in accordance with accepted academic
Yunus, A. P., Masago, Y., and Hijioka, Y. (2020). COVID-19 and                                   practice. No use, distribution or reproduction is permitted which does not comply
   Surface Water Quality: Improved lake Water Quality during the                                 with these terms.

Frontiers in Environmental Science | www.frontiersin.org                                    11                                         September 2021 | Volume 9 | Article 746090
You can also read