Rain Erosion Maps for Wind Turbines Based on Geographical Locations: A Case Study in Ireland and Britain - Strathprints
←
→
Page content transcription
If your browser does not render page correctly, please read the page content below
Journal of Bio- and Tribo-Corrosion   (2021) 7:34
https://doi.org/10.1007/s40735-021-00472-0

Rain Erosion Maps for Wind Turbines Based on Geographical Locations:
A Case Study in Ireland and Britain
K. Pugh1     · M. M. Stack1

Received: 8 September 2020 / Revised: 15 December 2020 / Accepted: 1 January 2021
© The Author(s) 2021

Abstract
Erosion rates of wind turbine blades are not constant, and they depend on many external factors including meteorological
differences relating to global weather patterns. In order to track the degradation of the turbine blades, it is important to analyse
the distribution and change in weather conditions across the country. This case study addresses rainfall in Western Europe
using the UK and Ireland data to create a relationship between the erosion rate of wind turbine blades and rainfall for both
countries. In order to match the appropriate erosion data to the meteorological data, 2 months of the annual rainfall were
chosen, and the differences were analysed. The month of highest rain, January and month of least rain, May were selected
for the study. The two variables were then combined with other data including hailstorm events and locations of wind turbine
farms to create a general overview of erosion with relation to wind turbine blades.

Keywords Wind · Turbine · Maps · UK · Ireland · Erosion · Rainfall · Composites · Testing

1 Introduction                                                            from local beauty spots; however, this results in turbines
                                                                          being subjected to harsh conditions and in some locations
Wind energy has become an increasingly popular choice                     heavy rainfall. Within this case study, data from the Met
of renewable energy with many countries across the world                  Office [5, 6], Irish weather data [7] and experimental data
attempting to become carbon neutral [1]. This has resulted                will be combined to map the UK and Ireland in terms of
in a major research focus within the wind energy sector,                  erosion on wind turbine blades. This is being carried out
addressing all aspects of energy conversion. This boom has                to display the relationship between the locations of wind
had a very significant impact on the design, manufactur-                  turbine farms and their environment. This will, in turn, also
ing and efficiency of the turbines and their blades [2]. One              aid in visualizing the wind farms that are at higher risk from
common advance is to install much larger blades, however,                 erosion degradation and will require more maintenance. This
this is coupled with substantially greater tip velocities of              is to mitigate failures and increase power output by keep-
the blades. These increased velocities create a higher risk               ing the blades smooth and promoting greater aerodynamic
of degradation of the leading edge due to impacts from rain               efficiency.
erosion [3]. With tip speeds from turbines reaching 300mph,
the repeated impact of raindrops is sufficiently energetic to
erode the material. The erosion rates of wind turbines have a             2 Methodology and Results
direct relationship to the environment they are erected. More
rainfall will result in more erosion of turbine blades [4].               The procedure began by collating data from the Met office
   Typically wind turbine farms are constructed in barren                 and Irish weather data. With this data an average rainfall map
locations due to land availability, wind speeds and away                  over the last 20 years was created. It should be noted that
                                                                          the turbine blades will inevitably experience varying rainfall
                                                                          rates throughout the year, which will, in turn, result in vary-
* K. Pugh
  kieran.pugh@strath.ac.uk                                                ing erosion rates. To map this phenomenon, the months of
                                                                          highest and lowest rainfall were chosen which were January
1
    Department of Mechanical Engineering, University                      and May, respectively. Showing the two extremes of rainfall
    of Strathclyde Glasgow, 16 Richmond St, Glasgow G1 1XQ,               months will provide more insight than a yearly average and
    UK

                                                                                                                              13
                                                                                                                         Vol.:(0123456789)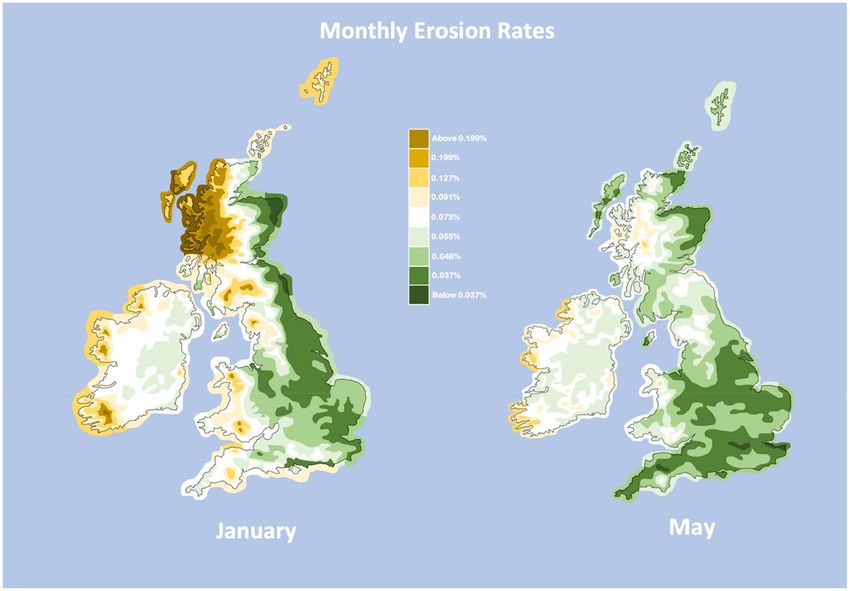
34      Page 2 of 7                                                     Journal of Bio- and Tribo-Corrosion   (2021) 7:34

                                                                 impact velocity was set to 60 ms−1 as this will simulate the
                                                                 leading edge of 2 MW turbines with a diameter of 100 m.
                                                                 One of the assumptions that was made to relate the experi-
                                                                 mental data to the weather data was that the wind turbines
                                                                 were always turning when it was raining. Although this
                                                                 might result in an overestimation in erosion, it is deemed
                                                                 a worst-case scenario that has a possibility of occurring.
                                                                    All the variables which were kept constant includ-
                                                                 ing impact velocity, temperature and rainfall were all
                                                                 calibrated before the experimental campaign began. The
                                                                 impact velocity was calibrated using light transducer
                                                                 which was held close to the rotating shaft where a thin
                                                                 reflective strip was placed. A light source was focused
                                                                 onto the shaft and the transducer would give an electri-
Fig. 1  Whirling arm rain erosion rig                            cal output when the light was reflected from the reflec-
                                                                 tive strip each time it would rotate. The rain fall was cali-
                                                                 brated by running the rain system for five hours and the
                                                                 water tank which feeds the rig was weighed periodically
                                                                 every 30 min to calculate the water consumed and hence
                                                                 the rainfall rate. The pump used was a peristaltic pump
                                                                 which proved to be extremely reliable and hence outputted
                                                                 50 mm/h every 30 min. The temperature inside the rig was
                                                                 also measured and kept at 29° C, a temperature calibration
                                                                 test was carried out during the calibration of the rainfall
                                                                 where the temperature was measured using a probe inside
                                                                 the chamber and a reading was taken every 30 min for the
                                                                 five hours and the temperature only fluctuated ± 1° C.
                                                                    The same procedure was carried out for all samples
                                                                 which included a 48-h drying period before measuring
                                                                 the mass and kept in the same container to ensure the con-
                                                                 ditions when the sample was drying were kept constant.
                                                                 After the 48 drying period the samples were weighed on a
Fig. 2  Whirling arm schematic                                   balance accurate to 0.00001 g and the mass of the sample
                                                                 was measured five times equally spaced out over one hour.
                                                                 From this a measurement error of ± 0.001% and standard
allow for contrast to be observed between the 2 months. The      deviation of 1.09E−05 was calculated for the neutral water
result of this can be seen in Fig. 3.                            and a measurement error of ± 0.019% and standard devia-
   Upon the completion of this map an experimental pro-          tion of 1.16E−04 for the saltwater experiment.
cess in the Tribology laboratory at the University of Strath-       The construction of the rainfall map (Fig. 3) allows the
clyde was carried out to relate rainfall across the country      setup for the experiment to be finalised. The key to the
to the degradation of wind turbine blades. There are many        map displays: Below 50 mm, 50 mm, 75 mm, 100 mm,
different ways to test for rain erosion [8]; however, the test   150 mm, 200 mm, 300 mm, 500 mm and above 500 mm.
method used for this case study is the whirling arm setup        The rainfall rate of the whirling arm rig is 50 mm/h there-
[9]. This consists of a large chamber with induced rainfall      for the time each sample exposed to rain erosion can be
from hypodermic needles; in the centre of the chamber is         determined, this is.
a rotating arm which holds the material sample at the end.          shown in Table 1.
Adjusting the rotational speed of the spinning arm will             The chosen measurement for erosion is mass loss as a
adjust the impact velocity the sample encounters with the        percentage of the original sample. The mass of the test
water droplet. The experimental setup can be seen in Fig. 1      material was measured before the experiment and after
and a schematic is shown in Fig. 2.                              each exposure time. This would result in a direct numeri-
   The material used in this experiment was G10 epoxy            cal relation between the average monthly rainfall and the
glass which is a similar glass fibre epoxy composite used        erosion as a mass loss.
within the wind turbine manufacturing industry [10]. The

13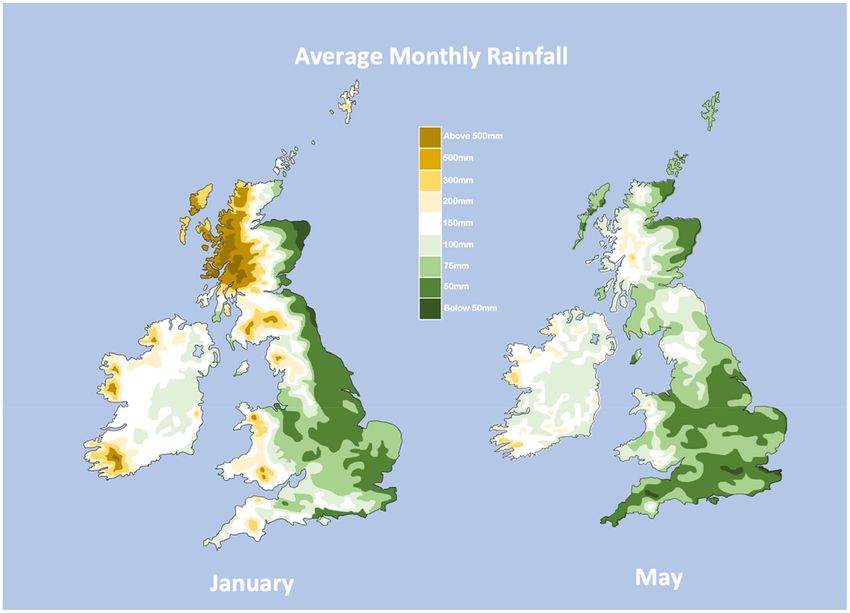
Journal of Bio- and Tribo-Corrosion    (2021) 7:34                                                                     Page 3 of 7      34

Fig. 3  The average rainfall in the months of January and May

Table 1  Exposure time in                                                   This methodology was repeated with saltwater instead of
                                      Rainfall (mm)       Exposure
erosion rig to achieve required                           Time           rainwater to simulate offshore conditions. The saltwater used
rainfall                                                  (min)          was a 3.5% saline solution which most accurately describes
                                                                         the seawater in the UK and Ireland [11]. The results and
                                      50                  60
                                                                         errors can be seen in Table 2
                                      75                  90
                                      100                 120
                                      150                 180
                                      200                 240
                                      300                 360
                                      500                 600

Table 2  Mass loss results from       Exposure time       Cumulative rainfall   Neutral water mass loss (%)   Saltwater (3.5% saline
erosion testing                       (min)               (mm)                  (± 0.001%)                    solution) mass loss (%)
                                                                                                              (± 0.019%)

                                      60                  50                    0.037                         0.001
                                      90                  75                    0.046                         0.014
                                      120                 100                   0.055                         0.071
                                      180                 150                   0.073                         0.075
                                      240                 200                   0.091                         0.120
                                      360                 300                   0.127                         0.205
                                      600                 500                   0.199                         0.276

                                                                                                                                13
34     Page 4 of 7                                                    Journal of Bio- and Tribo-Corrosion   (2021) 7:34

3 Rainfall Map                                                the key displaying erosion as a percentage mass loss of a
                                                               theoretical turbine blade.
The rainfall mostly averages between 50 and 500 mm of             The results showed a maximum mass loss of 0.199%
rain with some few areas showing more extreme rain. It         which relates to 500 mm of rainfall and a minimum
is clear that the month of May experiences considerably        mass loss of 0.037% which relates to 50 mm of rainfall.
less rain as it shows highs of 300 mm whereas this rate is     Although mass loss is not the most precise measurement
fairly common in January. The areas of intensity are very      for erosion when compared to imaging samples and iden-
similar in both months with the west coast of Scotland         tifying gauges, cracks and loss of material [18, 19]; it does
showing a high rainfall and also the west coast of Ireland,    allow for a broader comparison between samples.
predominantly the south west coast of Ireland displaying          The measurement of mass loss can be loosely linked
very heavy rainfall. These are historically harsher climates   to the efficiency of the turbine, which is also why this
due to the prominent westerly wind from the Atlantic [12].     measurement was used to map erosion across the UK and
This leads to further erosion as the largest windfarms are     Ireland. With all material lost from the wind turbine blades
located in these areas due to the increased power output       it will affect the aerodynamic profile of the blades, with
from the consistent wind [13]. This is a very common           more mass lost the greater the effect it will have. The dis-
trade-off when building a windfarm as the conditions that      turbed airflow over the blade will impede the performance
yield the most power generation are also the conditions        of the turbine. A damaged blade will require a higher air-
which deteriorate the turbine blades most rapidly, there-      flow or blade angle to produce the same output [20]. This
fore the life of the turbine blade will be reduced [14].       has been proved experimentally within the literature which
   Part of the experimental process was also to under-         considered the drag coefficients of compromised blades
stand sea water effects which help describe the erosion        [21] and also the microscopy of material subject to rain
behaviour of offshore wind turbines. This was completed        droplets at high velocities [22].
by running a saltwater solution (3.5% saline solution)            The degradation of the sample should erode in three
through the experimental rig to simulate offshore condi-       distinct stages. The first is the initiation period; where the
tions. Previous work on this topic by the current research     sample is at its smoothest and difficult to penetrate, this
group showed similar results to the saltwater exposure in      is when the turbine blades are brand new and operating at
this investigation. This had concluded that the saltwater      optimal efficiency. Secondly is steady state erosion; where
proved more erosive when subject to high velocity impacts      the sample has been impacted by a critical number of drop-
from the leading edge of the turbine blade and would cre-      lets to affect the surface roughness of the sample enough
ate larger, more destructive cracks and loss of material       to instigate more considerable erosion which continues at
from the sample [15]. The added effect of the more con-        a constant rate. It is during this stage that the turbine starts
sistent wind from offshore conditions with the sea water       to decline in efficiency. Lastly the third stage is the final
climate is conducive to an erosive atmosphere and hence        erosion region where the erosion rate decreases, however,
a short life span of turbine blades. Offshore wind farms       this is when the turbine blade is at its most vulnerable and
have many other problematic characteristics including the      the erosion on the blades can begin to become structural
corrosive nature of sea water which will attack any metal-     weak points [23]. It is important to locate areas of signifi-
lic parts and the anchoring of the structure to the seabed.    cant erosion across the country as the timing of mainte-
However, the remote locations and the large blade size         nance to repair or replace blades is crucial in the optimisa-
allows very significant energy capture [16]. Even though       tion of power production from wind turbine blades.
offshore wind turbines encounter major drawbacks such as          The rainfall data is only available on land, therefore
increased levels erosion and corrosion, the advantage of       there was no offshore rain data to compare to the offshore
having the open space to build larger, more efficient wind     erosion data. From the experiments using saltwater (3.5%
turbines with more consistent wind makes them economi-         saline solution) there was a higher mass loss at the higher
cally viable [17].                                             exposure times compared to the neutral water tests. To
                                                               compensate for this a border of approximately 10 miles
                                                               was created offshore around the islands and assumed to
                                                               be one grade above the adjacent onshore erosion rate. For
4 Erosion Maps                                                example, the mainland of Shetland displayed an erosion
                                                               of 0.046% mass loss therefor a 10-mile boundary off the
Once the rainfall maps were created the link between           coast of Shetland was created displaying the next grade up
rainfall rate and erosion rate could be made as mentioned      in the key which is an erosion of 0.055% mass loss. This
previously. This allowed the same maps to be created with      is displayed in Fig. 4.

13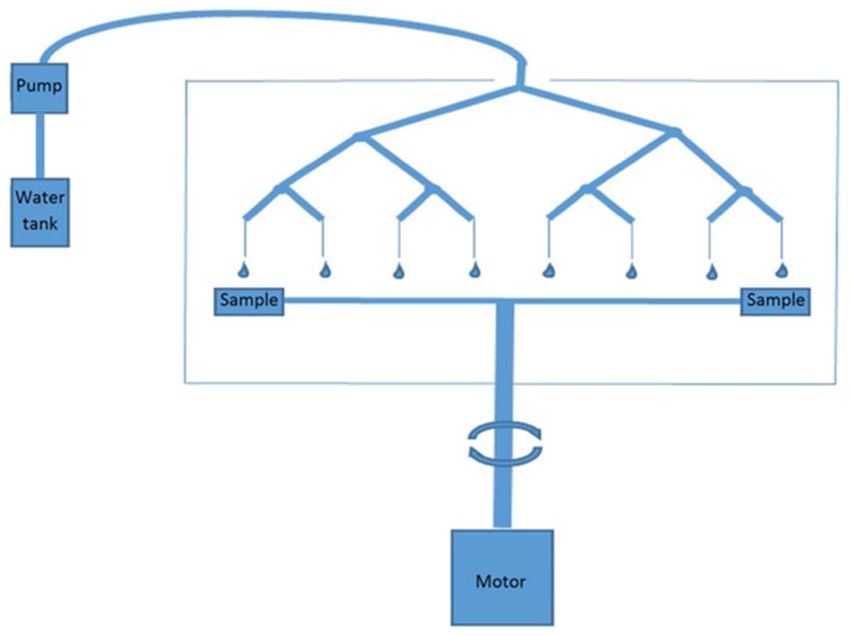
Journal of Bio- and Tribo-Corrosion (2021) 7:34 Page 5 of 7 34
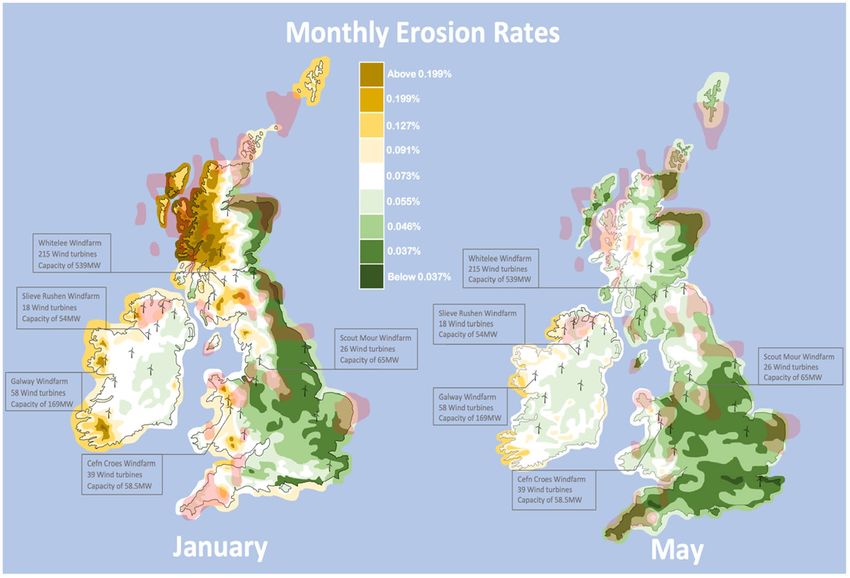
Fig. 4 The monthly erosion rates in January and May
5 Points of Interest on Erosion maps Also superimposed onto the map in Fig. 5 is the loca-
tions of some large wind farms and the largest in Scotland,
Construction of these maps now allows for further com- England, Ireland, Wales, Northern Ireland and The Republic
parison to be made including locations of major wind of Ireland have been labelled [25]. This not only allows for
farms and also areas of high hail rates which is displayed a comparison between the size of the various windfarms in
in Fig. 5. Even though the rainfall rate maps cover all each region but also how adversely affected each one is by
precipitation, it is important to locate areas of high hail the climate and the subsequent erosion. Most of the wind-
impact as these tribological actions can be detrimental to farms are in compromising locations but, as discussed previ-
its structural integrity. Although the probability of hail ously, this is a trade-off between greater access to consistent
striking wind turbine blades is very low and the dam- wind to the lifetime of the blades.
age would be difficult to ascertain, and it could possibly
be masked as the outcome of heavy rainfall erosion, the
implications of hail impacts have been proven experimen- 6 Areas Which May be Addressed in Future
tally to cause substantial damage. In a study looking into Work
ballistic ice impacts, it was shown that the impact would
delaminate and crack the composite material [24]. This There are some additional modifications which will help
would not only create a weak point in the blade structure optimise these maps when they are recreated with future
itself but also create an initiation site for rain erosion to results. The main extension would be the use of additional
occur and for crack propagation into the structure of the data to help aid the validity of the results and as mentioned
blade. The areas of frequent hail are shown in Fig. 5 as previously if enough data points are available then a dynamic
the red overlay, and from the maps it is clear that the west map could be potentially created.
coast is more adversely affected by hail. Unfortunately, There are many additions which could be made to the ero-
there was limited data on hail in The Republic of Ireland; sion data and the weather data which could provide further
therefore, assumptions on this issue for this area of the insight into geographical differences including the droplet
map need to be treated with caution. size, pH value and intensity which would aid the erosion
1334 Page 6 of 7 Journal of Bio- and Tribo-Corrosion (2021) 7:34
Fig. 5 The monthly erosion rates in January and May with overlays of major wind turbine farms and areas of frequent hail
data. These data sets however are difficult to pinpoint as they rain droplet impacts. This was coupled by a saltwater erosion
are mostly stochastic. experiment that used 3.5% saline solution as the droplets to
The most important evolution for these maps would simulate offshore wind turbines which are subject to being
be the inclusion of offshore rain data to include the large eroded by sea water (salt spray corrosion enhanced erosion)
offshore wind farms that could not be included within this in the atmosphere. These two maps were then superimposed
study. With almost half of the UK wind energy coming from to display areas of frequent hail and the locations of each
offshore wind farms [26] the inclusion of this data would country’s largest wind turbine farm. This was carried out
provide a more thorough overview of the erosion of the in an attempt to visualise the erosion patterns across both
UK and Ireland’s wind turbine blades and hence the loss in Ireland and the UK.
power due to aerodynamic inefficiencies. It is clear that the general trend consists of greater ero-
sion in the west coast of both the UK and The Republic of
Ireland with the highest erosion areas being the north west of
7 Conclusions Scotland where the land tends to be at a higher elevation and
also the south west of Ireland where there is no protection
In conclusion, the data from the rainfall within the UK and from the prevailing wind over the Atlantic.
Republic of Ireland were formatted together to produce an The locations of frequent hailstorms across the UK and
Ireland/Britain map showing the average rainfall across the the republic of Ireland could be considered stochastic, how-
two countries in both January and May averaged over the ever, the locations of some major wind farms overlap with
last 20 years. These maps were then used as the basis for an frequent hail; this can be seen predominantly in Northern
erosion experiment converting the rainfall to exposure time Ireland. This overlap could potentially reduce the lifetime of
within the erosion rig. These results were then arranged on the turbine blades at an increased rate due to more powerful
the map to display the degradation of the turbine blades from impacts from hailstones.
13Journal of Bio- and Tribo-Corrosion (2021) 7:34 Page 7 of 7 34
These mapping methods have potential to be used in life- Conference on Energy, Power and Transportation Electrification
time modelling of wind turbine blades and have the possi- (ACEPT), (pp. 1–6). IEEE
10. Ravi-Chandar K, Satapathy S (2007) Mechanical properties
bility to be developed into a dynamic map that can display of G-10 glass-epoxy composite. Texas Univ at Austin Inst for
changes in new wind farms and changing climates. This is Advanced Technology
particularly important due to weather changes over long 11. A Measure of Salt [Internet] (2020) Earthobservatory.nasa.gov.
periods of time on the annual cycle. [cited 2 November 2020]. Available from: https://earthobservator
y.nasa.gov/images/78250/a-measure-of-salt
12. Jones P, Harpham C, Kilsby C, Glenis V, Burton A. UK Climate
Acknowledgements The authors would like to acknowledge the sup- Projections science report: projections of future daily climate for
port of the Interreg (Northern Ireland—Ireland—Scotland) Special EU the UK from the Weather Generator
Programmes Grant No SPIRE2_INT-VA-049 ‘‘Storage Platform for the 13. Bâra A, Velicanu A, Lungu I, Botha (2020) Natural factors that
Integration of Renewable Energy (SPIRE 2)’’. can affect wind parks and possible implementation solutions in
a Geographic Information System. InInternational Conference
Compliance with Ethical Standards on Development, Energy, Environment, Economics, Puerto de la
Cruz, Tenerife (pp. 50–54)
Conflict of interest On behalf of all authors, the corresponding author 14. Shokrieh MM, Rafiee R (2006) Simulation of fatigue failure in a
states that there is no conflict of interest. full composite wind turbine blade. Compos Struct 74(3):332–342
15. Pugh K, Rasool G, Stack MM (2018) Some thoughts on mapping
tribological issues of wind turbine blades due to effects of onshore
Open Access This article is licensed under a Creative Commons Attri- and offshore raindrop erosion. J Bio- Tribo-Corros 4(3):50
bution 4.0 International License, which permits use, sharing, adapta- 16. Li Z, Zhao M, Chen Z (2006) Efficiency evaluation for offshore
tion, distribution and reproduction in any medium or format, as long wind farms. In 2006 international conference on power system
as you give appropriate credit to the original author(s) and the source, technology, (pp. 1–6). IEEE
provide a link to the Creative Commons licence, and indicate if changes 17. Tavner P (2012) Offshore wind turbines: reliability, availability
were made. The images or other third party material in this article are and maintenance. IET
included in the article’s Creative Commons licence, unless indicated 18. Pugh K, Nash JW, Raeburn G, Stack MM (2019) Review of ana-
otherwise in a credit line to the material. If material is not included in lytical techniques for assessing rain drop erosion resistance of
the article’s Creative Commons licence and your intended use is not materials. In14th Conference on Sustainable Development of
permitted by statutory regulation or exceeds the permitted use, you will Energy, Water and Environment Systems
need to obtain permission directly from the copyright holder. To view a 19. Pugh K, Nash JW, Reaburn G, Stack MM (2020) On analytical
copy of this licence, visit http://creativecommons.org/licenses/by/4.0/. tools for assessing the raindrop erosion of wind turbine blades.
Renew Sustain Energy Rev 137:110611
20. R. S. Ehrmann (2014) Effect of Surface Roughness on Wind Tur-
References bine Performance. PhD thesis
21. Sareen A, Sapre CA, Selig MS (2014) Effects of leading edge
erosion on wind turbine blade performance. Wind Energy
1. Jonas AE, Gibbs D, While A (2011) The new urban politics as a 17(10):1531–1542
politics of carbon control. Urban Stud 48(12):2537–2554 22. Pugh K, Rasool G, Stack MM (2019) Raindrop erosion of com-
2. Quarton DC (1998) The evolution of wind turbine design analysis: posite materials: some views on the effect of bending stress on
a twenty-year progress review. Wind Energy 1(S1):5–24 erosion mechanisms. J Bio Tribo-Corros 5(2):45
3. Keegan MH, Nash DH, Stack MM (2013) On erosion issues asso- 23. Springer GS (1976) Erosion by liquid impact. Scripta Publishing
ciated with the leading edge of wind turbine blades. J Phys D Co., Washington, DC
46(38):383001 24. Keegan MH, Nash D, Stack M. Wind Turbine Blade Leading Edge
4. Siddons C, Macleod C, Yang L, Stack M (2015) An experimental Erosion: An investigation of rain droplet and hailstone impact
approach to analysing rain droplet impingement on wind turbine induced damage mechanisms (Doctoral dissertation, University
blade materials. EWEA 2015 Annual Event of Strathclyde)
5. UK actual and anomaly maps [Internet] (2020) Met Office. [cited 25. Macdonald H, Infield D, Nash DH, Stack MM (2016) Mapping
1 June 2020]. Available from: https: //www.metoffi ce.gov.uk/resea hail meteorological observations for prediction of erosion in wind
rch/climate/maps-and-data/uk-actual-and-anomaly-maps turbines. Wind Energy 19(4):777–784
6. UK: Monthly rainfall 2020 | Statista [Internet] (2020) Statista. 26. UK Wind Energy Database (UKWED) [Internet] (2020). Renew-
[cited 1 June 2020]. Available from: https: //www.statis ta.com/stati able UK. [cited 3 November 2020]. Available from: https://www.
stics/584914/monthly-rainfall-in-uk/ renewableuk.com/page/UKWEDhome/Wind-Energy-Statistics
7. Walsh S. 01-NEW LONG-TERM RAINFALL AVERAGES FOR .htm
IRELAND, National Hydrology Seminar 2012, Off. of Public
Works, Tullamore
Publisher’s Note Springer Nature remains neutral with regard to
8. Tobin EF, Young TM, Raps D, Rohr O (2011) Comparison of
jurisdictional claims in published maps and institutional affiliations.
liquid impingement results from whirling arm and water-jet rain
erosion test facilities. Wear 271(9–10):2625–2631
9. Mackie C, Nash D, Boyce D, Wright M, Dyer K (2018) Char-
acterisation of a whirling arm erosion test rig. In2018 Asian
13You can also read