Rare earth elements and high-tech products - CEC4Europe
←
→
Page content transcription
If your browser does not render page correctly, please read the page content below
Rare earth elements and high-tech products
                     Dominique Guyonnet, Gaétan Lefebvre & Nourredine Menad

BRGM (French Geological Survey, Orléans, France)
Prepared for CEC4EUROPE (Circular Economy Coalition for Europe), August 2018

Abstract
Rare earth elements are increasingly important for high technology products. The high-tech sector
with the strongest demand for rare earths is the permanent magnet sector. Permanent NdFeB magnets
are currently the strongest magnets on the market. The primary rare earths used for these magnets
are Neodymium, Praseodymium (two “light” rare earths) and Dysprosium (a “heavy” rare earth). This
paper discusses the main factors affecting the economics of rare earths in terms of supply and prices,
as well as the high-tech applications that rely on rare earth magnets. The issue of rare earth recycling
is discussed and also the inevitable reliance on primary (extracted) raw materials, given the strong
increase of demand for rare earths and the duration of products in the economy, which significantly
limits the relative contribution of end-of-life flows to supply through recycling. The latter emphasizes
the importance of sustainable supply, in particular from primary sources, which is one of the main
pillars of the circular economy.

Introduction
Within the list of mineral raw materials identified by the European Commission as “critical” for the EU
(EC, 2017), rare earth elements (REE) are among those considered to present the highest levels of
supply disruption risks, associated with high economic importance for the EU. Rare earth elements
include the 15 Lanthanides (one of which is not stable; i.e., Promethium) and Yttrium. Rare earth
elements are generally subdivided into light (LREE) and heavy elements (HREE) as follows
(nomenclature adopted by EC, 2017):
-    LREE: Cerium (Ce), Lanthanum (La), Neodymium (Nd), Praseodymium (Pr), Samarium (Sm) ;
-    HREE: Dysprosium (Dy), Erbium (Er), Europium (Eu), Gadolinium (Gd), Holmium (Ho), Lutetium
     (Lu), Terbium (Tb), Thulium (Tm), Ytterbium (Yb), Yttrium (Y).
Due to their exceptional magnetic, luminescent, electrochemical and catalytic properties, REEs are
essential to modern technologies. In its analysis of “raw materials for emerging technologies”, DERA
(2016) identify magnets (Neodymium-Iron-Boron; NdFeB permanent magnets), electric vehicles and
wind power as the primary emerging technologies that will dominate future demand for rare earths.
While there has been emphasis on demand for energy storage (Nd and Pr for Nickel-Metal Hydride;
NiMH batteries) and lighting (Y, Eu, Tb demand for fluorescent lamps), in recent years NiMH batteries
have been largely replaced by lithium-ion batteries in electric and hybrid vehicles, laptop and desktop
computers, etc. Between 2005 and 2015, the Li-ion battery market grew at a 14% compound average
growth rate (CAGR; Avicenne Energy), at the expense of NiMH and NiCd batteries. In the lighting sector,
fluorescent lights are progressively replaced by light-emitting diodes (LEDs) which use very small
amounts of rare earths. LED lamps have significant advantages compared with fluorescent lamps:
around twenty times more lumens are generated per gram of rare earth with a LED lamp than with a
fluorescent lamp. The average lifetime of a fluorescent lamp is between 10 000 and 25 000 hours,
compared with 40 000 to 50 000 hours for a LED lamp (Rollat et al., 2016).

                                                   1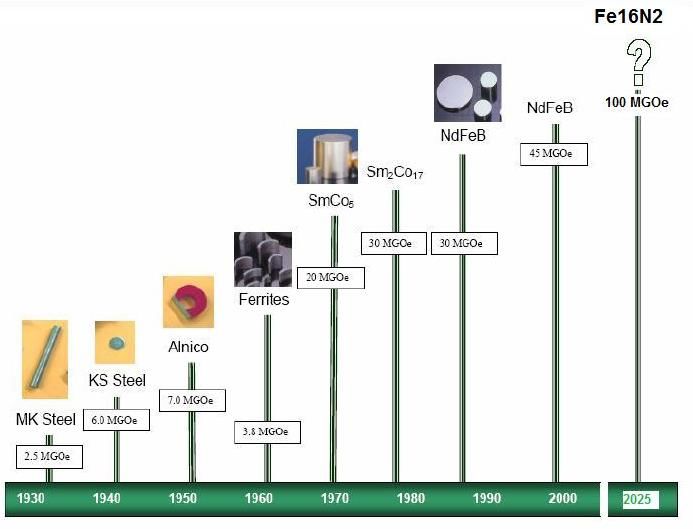
Therefore, consistent with DERA (2016), the primary rare earth-consuming high-tech applications
considered herein are in relation to permanent magnets. Other industrial sectors that use REEs but do
not necessarily qualify as “high-tech” include catalysis, polishing powders, glass and ceramics, etc. This
paper presents an overview of rare earth economics, discusses permanent magnet applications,
potential recycling of rare earth elements from magnets and proposes some conclusions relevant to
the application of circular economy concepts to rare earths.
An overview of rare earth economics
The geopolitical factor
The evolution of rare earth prices (Figure 1a and b) reflects major events in rare earth markets. The
peak prices in 2011 seen in Figure 1 were the result of speculation linked to geopolitical tensions
between China and Japan over ownership of the Senkaku Islands in the East China Sea. In reaction to
this territorial dispute, China, which at that time was already responsible for 90% of the world REEs
primary production, decided to reduce its export quotas of rare earth oxides (REO) and to stop exports
to Japan. This triggered highly speculative reactions on trade markets. One result of the price hype was
a realization by western governments of their vulnerability with respect to Chinese monopoly
regarding mineral resource supply. In addition to rare earths, China is the main global producer of
around 40 mineral raw materials, either at the mining stage or at the processing stage. Efforts at the
European Union level regarding mineral criticality assessments can be linked pro parte to this particular
event.
US$/kg
500 Indicative prices of Yttrium, Light Rare Earths and Gadolinium 100 Indicative prices of Yttrium, Cerium,
99% metal, FOB China, in US$/kg averaged over 7 to 15 days Neodymium and Erbium Oxides CAF Europe
Y2O3 99.99% US$/kg
in US$/kg converted to €/kg
450 90 CeO2 99.5% US$/kg
Nd2O3 99.5% US$/kg
400 Yttrium 80 Er2O3 99.5% US$/kg
Y2O3 99.99 €/kg
Lanthanum
350 70 CeO2 99.5% €/kg
Cerium Nd2O3 99.5% €/kg
300 Neodymium 60 Er2O3 99.5% €/kg
Praseodymium
250 50
Samarium
200 Gadolinium 40
150 30
100 20
50 10
0 0
1/01/05
1/01/06
1/01/07
1/01/08
1/01/09
1/01/10
1/01/11
1/01/12
1/01/13
1/01/14
1/01/15
1/01/16
1/01/17
1/01/12
1/01/13
1/01/14
1/01/15
1/01/16
1/01/17
a) b)
Figure 1 Evolution of rare earth prices from 2005 to 2018 (a) and since 2012 (b).
The technological factor
Following the 2011 price hype, prices subsided back to levels that are more in line with production
costs, but prices have recently shown signs of revival (Figure 1b) in the case of certain rare earths that
are used in NdFeB permanent magnets (Nd and Pr; +87% and +81% increase resp. between January
and September 2017). These two rare earths have very similar properties and are closely associated in
REO natural ores. According to D. Kingsnorth (IMCOA), rare earth oxide (REO) consumption in the
permanent magnet sector increased from 24 000 tons in 2012 to 50 000 tons in 2016, thus
representing 31% of global demand compared to 20% in 2012 (Figure 2).
2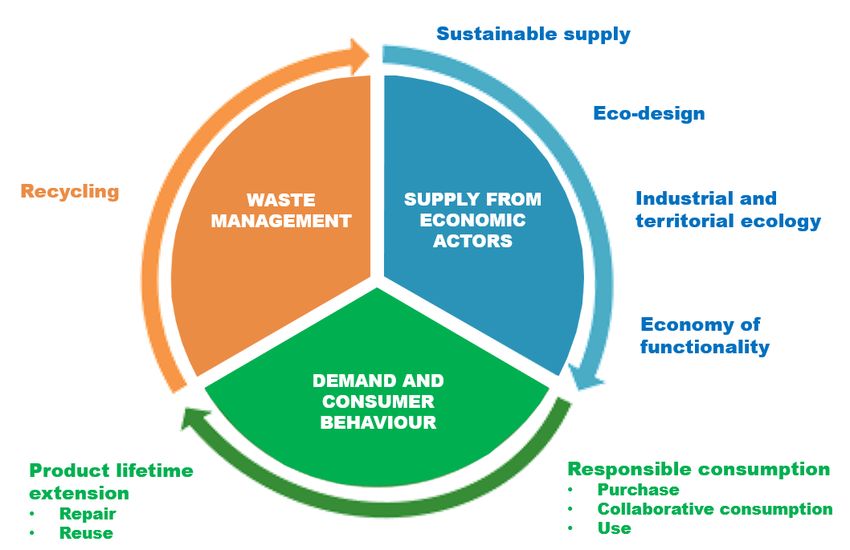
7%                                                                                                        5%
                                                                                                                                4%
                   7%                             20%                                                                                                Permanent m
                                                                           Permanent magnets                                                   31%
                                                                                                                      13%                            Catalysis
                                                                           Catalysis
          15%                                                              Metallurgical alloys                                                      Metallurgical
                                                                           Glass and ceramics                     11%                                Glass and cera
                                                           20%             Polishing powders                                                         Polishing
              12%                                                          Light phosphors
                                                                                                                                                     Light phospho
                                                                           Other                                              18%            18%
                                   19%                                                                                                               Other

         2012 (total = 121 000 tons REO)                                                                           2016 (total = 159 000 tons REO)

Figure 2 Evolution of REO consumption between 2012 and 2016 by industrial sector (Source: Roskill, 2015;
IMCOA, 2017)

The substantial increase of rare earth consumption for permanent magnets is a consequence of the
increasing number of technologies that use these magnets; from electric and hybrid vehicles to
computer laptops and desktops, hard disk drives and renewable energy (especially wind power). As
mentioned in the introduction, several other sectors have seen their consumption decrease (lighting
and energy storage). In the near to intermediate future, the demand for REO (Figure 3) will be
dominated by the development of permanent magnets. While this has affected the prices of the “light”
rare earths; Nd and Pr, the heavy rare earth Dy has not been influenced because its use for increasing
the Curie temperature in permanent magnets has been limited by its high price.

                     Evolution of Rare Earth consumption and production,
240 kt
                           in thousand tonnes (kt) rare earth oxide.
          2006-2016 data. Estimates / forecasts 2017 - 2025 from IMCOA reported by SWM, June 2017
220 kt
                      Global Rare Earth Consumption
                      Direct Rare Earth Consumption by ROW outside China
200 kt
                      Direct Chinese Rare Earth Consumption
                      Chinese Rare Earth Mine Production
180 kt
                      Quota of Chinese legal mining production
                      Total Rare Earth Mine Production
160 kt

140 kt

120 kt

100 kt

 80 kt

 60 kt

 40 kt

 20 kt

  0 kt
         2000 2001 2002 2003 2004 2005 2006 2007 2008 2009 2010 2011 2012 2013 2014 2015 2016 2017 2018 2019 2020 2021 2022 2023 2024 2025

Figure 3 Historical and projected consumption of REO (Source: IMCOA, 2017).

                                                                                             3
The geological factor
As mentioned above, Nd and Pr are “light” rare earths. Even though most deposits contain all rare
earth elements, the concentration of REEs varies with each type of mineralization but also between
each individual ore body. Deposits that are relatively rich in light rare earths are much more common
than deposits that are rich in heavy rare earths (currently limited to ion-exchange clays in southern
China). Hence the higher prices of heavy rare earths. A typical distribution of rare earths in an average
LREE ore is: 50% Ce, 20-25% La, 12-20% Nd and 4-5% Pr. Following extraction, separation processes
are used to produce individual REO. This distribution of rare earths in ores generates an imbalance
between rare earth supply and demand (see, e.g., Binnemans et al., 2013): in order to obtain one ton
of Nd, approximately two tons of Ce and at least as much La must be produced, which leads to an over-
supply of Ce and La and directly affects prices. As emphasized by Binnemans et al. (2013), one solution
to the imbalance problem is to recycle rare earths for which there is a strong demand, from end-of-life
products (see below).
The fact that China provides more than 90% of global rare earth production is not entirely
attributable to its geology. According to various estimates, the share of China in terms of rare earth
geological resources is between 50 and 60% (Bru et al., 2015). There are currently many rare earth
mining projects located outside China (Table 1).
Table 1 Main rare earth mining projects (not yet in operation) located outside China in 2017 (source: SNL)
Country Project Company Production REO grade Deposit type Projected Capex (M Web site
objective start date $US)
(kt REO/yr)
Australia Browns Range Northern Minerals 3,25 0,63% Hydrothermal > 2018 314 http://northernminerals.com.au
Australia Dubbo Alkane Resources 4,9 0,89% Alkaline igneous 2019 840 www.alkane.com.au
Australia Nolans Bore Arafura Resources 14 2,78% Hydrothermal > 2019 680 www.arultd.com
Hastings Technology
Australia Yangibana Metals 5,5 1,27% Carbonatite 2019 405 www.hastingstechmetals.com
Burundi Gakara Rainbow Rare Earths 5 54,30% Seams 2017 10 http://rainbowrareearths.com
Malawi Songwe Hill Mkango Resources 2,8 1,60% Carbonatite 2021 217 www.mkango.ca
Tanzania Ngualla Peak Resources 10,1 4,55% Carbonatite 2019 400 www.peakresources.com.au
Greenland Minerals
and Energy + Shenghe
Greenland Kvanefjeld Resources 22,9 1,08% Alkaline igneous > 2018 1361 www.ggg.gl
Commerce Resources
Canada Ashram Corp 16,9 1,88% Carbonatite N.A. 759 www.commerceresources.com
Steenkampskraal
South Africa Steenkampskraal Thorium 5 14,90% Hydrothermal N.A. 119 www.thorium100.com
Tantalus Rare Earth
Madagascar Tantalus AG ? 0,08% Alkaline igneous Suspended ? www.tre-ag.com
Leading Edge
Sweden Norra Kärr Materials 5,1 0,59% Alkaline igneous Suspended 378 http://leadingedgematerials.com
In Europe, the Swedish Norra Kärr project reports potential geological resources of around 33 000
tons Neodymium (metal), 12 000 tons Dysprosium and 90 000 tons Yttrium. But this project was
suspended in 2016 by a decision of the Swedish Supreme Administrative Court, on the basis that
potential environmental impacts of the projected mining facilities had not been sufficiently taken into
account.
Also, the economic viability of rare earth mining projects outside China is jeopardized by fierce
competition on prices, in particular due to Chinese exports from illegal mining activities (following the
sources, Chinese rare earth output in 2016 from illegal mining was somewhere between 45 000 and
95 000 tons). Low prices explain why the Mountain Pass mine (Molycorp, US) had to file for bankruptcy
in June 2015. The only other rare earth mine currently in activity outside China is the Mount Weld mine
in Australia. This mine maintains its activity despite Chinese competition thanks to “off-take” contracts
4between the owner (LYNAS) and Japanese industrial companies, whereby these companies guarantee
a certain price for the mine’s production.
The environmental factor
China’s high share of rare earth production compared to its share of geological resources is explained
in part by the lower environmental standards of Chinese extraction activities as opposed to mines in,
e.g., western countries. But it is also the result of the poor “Social License to Operate” of the extractive
industry in many western countries. This is particularly true for Europe, where surveys (see EC, 2016)
show a low level of trust by the general public for mining and oil & gas industry companies, as
compared to countries like China, Brazil, India, etc. However, with the development of a middle class,
expectations with respect to environmental standards are also increasing in China. In 2017, an
increased awareness of environmental issues brought Chinese authorities to enforce anti-pollution
measures that led to the closure of several mines and a periodic shutdown of several metallurgical
plants. Chinese authorities have expressed their aim to clamp down on illegal rare earth mining, which
has had an influence on prices. According to the Chinese ministry of industry and technology (MIIT),
China intends to limit its rare earth production to 140 kt in 2020 and its rare earth separation capacity
to 200 kt.
The poor perception of the extractive industry by the general public in western countries
jeopardizes the ability to offset the effects of Chinese monopoly. But the attitude of the general public
in many European countries (e.g., France), is somewhat paradoxical. The public wants to benefit from
the multiple high-tech applications that use rare earths (in particular magnets in, e.g., hard disk drives,
portable phones, laptops and desktops, electric and non-electric vehicles, headphones and earphones,
printers, scanners, etc.) but does not want the associated extractive activity. Recycling is often cited as
the alternative to extraction but, as will be shown in section 4, recycling can only provide part of the
solution.
High-tech applications of rare earths
As mentioned above, the primary rare earth application used in high-tech products is permanent NFeB
magnets. These magnets are the most powerful on the market today. A measure of the strength of a
magnet is its energy density (in Megagauss-Oersted; MGOe). Current NdFeB magnets have energy
densities on the order of 60 MGOe, compared with, e.g., 7 MGOe in the case of AlNiCo magnets. Such
high energy density has allowed the miniaturization of, e.g., electronic equipment. As indicated in
Figure 4, current research on new magnet technologies such as iron nitride magnets might supplant
rare earth magnets in years to come. The theoretical magnetic energy density for an iron nitride
(Fe16N2) magnet is 130 MGOe, i.e., more than twice the maximum reported magnet energy density
for a NdFeB magnet.
Rare earths used for the production of NdFeB magnets are primarily Nd and Pr, with some Dy and
Tb. The global proportions of Pr, Nd, Tb and Dy in NdFeB magnets are on average 5%, 20%, 1%, 5%
(gram REE per gram magnet) respectively. Dysprosium (or Tb) is added to NdFeB magnets to increase
the Curie temperature, i.e., the temperature at which they lose their magnetic properties. Following
the service temperature for which an application is designed, the magnets will require more or less Dy.
For example in hard disk drives (HDDs), CD players and headphones, the proportion of Dy in magnets
is between zero and 2% (gram Dy per gram magnet), while in hybrid electric motors it is closer to 10%.
Due to the relatively high price of Dy, considerable research has been devoted to optimizing the
quantities of Dy in magnets, while some manufacturers prefer to modify their technology in order to
completely eliminate the need for Dy. For example Siemens, who aims world leadership in off-shore
5wind power, announced in 2014 that it had developed new wind power generators without any Dy, by
integrating a cooling system. According to certain authors approximately 14% of wind turbines are
direct drive turbines that use NdFeB magnets. According to Castilloux (2014), the average Dy weight
content in magnets should decrease from 2.3% in 2014 to around 1.9% in 2020.
Figure 4 Different magnet technologies compared in terms of energy densities (in MGOe). (Source:
leblogenergie)
Rare earth permanent magnets are gaining momentum in the electric vehicle market. For example
in August 2017, the company Tesla Motors announced its intention to equip its Long Range Model 3
electric vehicle with NdFeB permanent magnets. Tesla’s decision to move away from alternative
current (AC) induction motors was motivated by the fact that AC induction motors are larger, heavier,
and less efficient, resulting in more draw on the lithium-ion battery pack compared to a permanent
rare earth magnet motor. Tesla Motors initially chose the induction motor instead of the permanent
magnet motor due to the high REE prices when its first electric vehicle was developed (the Model S).
But as REE prices have fallen considerably since 2011, Tesla considers that the benefits of rare earth
permanent magnet motors far exceed the elevated cost compared to the AC induction motor. The
amount of Nd required per vehicle is on the order of 0.75 - 1.7 Kg. As Tesla plans to produce around
9.4 million vehicles of this type by 2020, the Nd requirement would be between 7 000 and 16 000 tons
Nd metal for the requirements of this specific vehicle alone.
With respect to wind power, the generator of a 1 MW nominal power wind turbine can contain on
the order of 600 Kg of NdFeB magnets (Zepf, 2013) with around 165 Kg Nd and 30 Kg Dy. The Indian
government has recently announced its objective of reaching 175 GW energy production from
renewable energy sources by 2022 (compared with 57 GW produced in 2017), with 60 GW energy
production from wind power energy installed by the Danish company Vestas, which relies partly on
NdFeB permanent magnets.
In a longer-range outlook, rare earths could be at the center of energy production from nuclear
fusion. Scientists from MIT have recently announced that a collaboration between scientists at MIT
and a private company will be able to transform fusion from an expensive science experiment into a
viable commercial energy source and will put fusion power on the grid within 15 years. The technology
relies on a newly available superconducting material: a steel tape coated with yttrium-barium-copper
6oxide (YBCO) which has allowed scientists to produce smaller, more powerful magnets used to confine
the plasma needed for the fusion reaction.
Recovery of rare earths: opportunities and limits
Rare earth recycling
Recycling of rare earths from end-of-life products presents several significant advantages as it:
- avoids many of the environmental emissions associated with primary ore extraction and processing;
in particular emissions associated with radioactive elements (Thorium, Uranium) that are typically
associated with rare earth deposits;
- helps address the balance problem presented above;
- provides a certain level of self-sufficiency to countries that do not have primary ore deposits.
While recycling operations for rare earth recovery from phosphors in fluorescent lamps are in
operation or have existed in the past, the focus here is on rare earth magnets. It is worth noting
however that the phosphor recycling operation initiated by Solvay in 2012 at its plant of Saint-Fons
(France) was stopped in 2015 because it wasn’t economically viable. This was due, on the one hand,
to the low rare earth prices, but also to an insufficient fluorescent lamp collection rate.
A simplified recycling flow sheet for REE magnets is presented in Binnemans et al. (2013) which
considers three different material flows: (i) swarf originating from magnet manufacturing, (ii) small
magnets in end-of-life consumer products and (iii) large magnets in hybrid and electric vehicles or wind
turbines. The authors underline that the re-use of magnets in their current form/shape is only possible
for large, easily accessible magnets used in wind turbines or large electric motors in hybrid and electric
vehicles. They provide an overview of different recycling methods for REE magnets, including
hydrometallurgical and pyrometallurgical methods, each with their pros and cons, but underline that
most efforts for REE recycling from magnets are still at an R&D lab scale stage, due essentially to
technological difficulties.
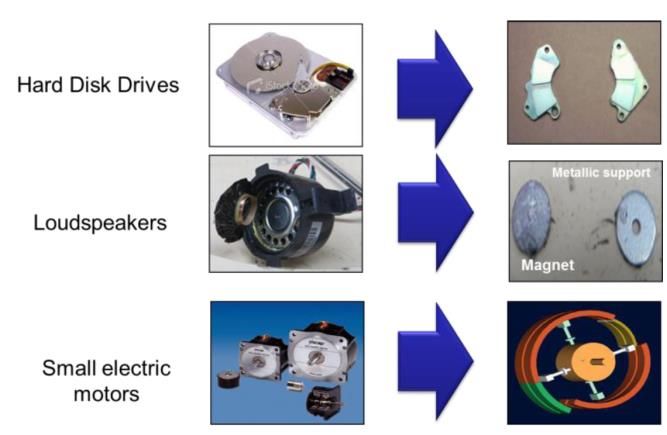
BRGM is among the research groups currently working on ways to recycle rare earth magnets in
WEEE (waste electrical and electronic equipment). Results of the Extrade project (Menad et al., 2016),
supported by the French Science Agency (ANR), suggest that the best way to reduce the time of manual
disassembly of the electronic devices containing NdFeB-type magnets is to recover the magnets still
stuck on the stainless steel carrier at the stage of downstream valorization. Thermal treatment
experiments show that the majority of the magnets present in the three investigated electronic devices
(Figure 5) lose their magnetic properties when reaching the Curie temperature of 300-400°C in 15 to
20 minutes.
Pilot-scale trials on mechanical dismantling of hard-disk drives to recover the magnets yielded
encouraging results: more than 87% of magnets were released without pulverizing them. For materials
completely encased in metal, liberation of the magnets was difficult. While the initial energy required
to “break in” to the casing and loosen it may be high, once liberation is initiated, it tends to propagate
rapidly. Any exposed components are then quickly broken down, especially liberating plastic from
metal. Physical and chemical techniques were developed to extract the magnet coating. Dissolution
test results with weak acids showed that magnet-alloys were dissolved in 7 hours while the Ni or Zn
coatings were not attacked. Oxalic acid was used to precipitate rare earths as oxalates, with an
oxidation at 500 to 600oC (Seron et al., 2017).
7Figure 5 Electronic devices containing rare earth magnets studied as part of the Extrade project (Menad et
al., 2016)
Limits to the contribution of rare earth recycling to supply
As illustrated by previous authors, there are thermodynamic limitations to multiple recycling cycles, as
elements may be increasingly diluted and lose their functional properties. Other limitations include
the efficiency and costs of end-of-life product collection schemes, the costs associated with the
disassembly of products and constraints associated with recycling processes. But there is an additional
constraint that is sometimes misunderstood by decision-makers and the general public which is related
to the dynamic nature of the flows and stocks which constitute the “Urban Mine”. A fundamental
difference between primary (extracted) and secondary (reused, recycled, …) resources is that in the
first case we address stocks (geological stocks in the subsurface) while in the second case we primarily
address flows (end-of-life product flows). Flows are dynamic by nature and the dynamics must be taken
into account for a realistic assessment of the potential of secondary resources to contribute to supply.
The dynamics of demand for rare earths are one factor, while another one is the lifetime of products
(which contain these metals) in the economy (in-use). It is worth reminding that before a product can
become a recycled resource, it first has to be discarded.
This effect of value chain dynamics is particularly acute in the case of mineral raw materials for
which demand is strongly increasing, as is the case for REEs. Historical mine production data from USGS
suggest an annual growth rate of global REO mine production since the nineteen-sixties between 6%
and 7% (with a lull over the period 2007-2012 in relation with the financial crisis). Let us assume that
supply grows at a constant rate (noted α). If we know supply (noted s0) at a given time (noted t0),
supply at any time “t” is given by:
S(t) = so(1+α)t-t0 (1)
The flow of REEs from end-of-life (EOL) products at time “t” is equal to supply at time “t-LT”, where LT
is the lifetime of the products in the economy (assumed here to be homogeneous for the sake of
simplicity):
EOL(t) = so(1+α)t-t0-LT (2)
The flow of recycled metal (Rec) takes into account the recycling rate (noted β):
Rec(t) = β so(1+α)t-t0-LT (3)
Therefore the relative contribution of recycled materials to supply at time t is (RC):
RC(t) = Rec(t) / S(t) = β / (1 + α)LT (4)
8Equation (4) depends only on the recycling rate, the supply growth-rate and the lifetime of products
in the economy. It is illustrated in Figure 6 for a supply annual growth rate of 6% and for end-of-life
recycling rates indicated along the y-axis (product lifetime = 0). Figure 6 shows for example that if the
product lifetime is 20 years (as for, e.g., wind turbines; Rademaker et al., 2013), then the maximum
contribution from recycling these end-of-life products cannot exceed around 40% of supply, even
assuming a 100% recycling rate (which is unrealistic). The other 60% required for supply can only come
from primary (extracted) sources, either produced domestically or else imported.
120%
Max contribution of recycling to supply
EOL recycling rates
100%
Supply annual growth rate: 6%
80%
60%
40%
20%
0%
0 5 10 15 20 25 30 35 40
Product lifetime in the economy (years)
Figure 6 Maximum contribution of recycling to demand, as a function of EOL-RR and product lifetime, for a
fixed demand annual growth rate of 6%
This effect of lifetime in the economy explains why the potential supply of Neodymium from recycled
sources in Europe is expected to “pick-up” only after 2030, with the magnets from wind power
generators entering end-of-life streams (Rademaker et al., 2013).
Conclusions
While rare earths are essential for certain high-tech products, a distinction should be introduced to
distinguish those rare earths that enter the composition of permanent NdFeB magnets. In that respect
the most important rare earths today are Nd, Pr and Dy. Terbium can be used in place of Dysprosium,
but the current price of Tb is nearly 3 times higher than that of Dy. While future technologies may
generate an increased demand for other rare earths, it should be reminded that industry adapts to
scarcity and to high prices by reducing its needs and by substituting one element for another. For
example, Gadolinium would be in high demand if there were a market for Gd-magnet refrigerators.
But because of the low-level of Gd global supply (on the order of a couple of thousand tonnes per
year), such technology is very unlikely to “take off”, despite its efficiency.
With respect to recycling, significant progress is needed in order to increase the recycled content
of magnets above a few percent, as is currently the case. But whatever the progress in this area, the
extraordinary increase in demand for rare earth magnets (associated with, e.g., the energy transition),
combined with the lifetime of products in-use, implies that European supply will necessarily have to
9rely on primary raw materials (extracted). These materials will either be extracted from European
sources, as suggested by the 2nd pillar of the European Raw Materials Initiative (EC, 2008), or else
imported; often from countries that apply much lower environmental standards than in Europe. The
latter is in contradiction with the principles of the Circular Economy (Figure 7), which highlight the
importance of sustainable supply as part of the action-area “Supply from economic actors”. This
stresses the importance of responsible mining; in particular of environmental management all along
the mine life cycle. The latter is one of the focuses of the EIT (European Institute of Technology) on
Raw Materials.
Figure 7 Principles of the circular economy according to the French Environmental Agency (ADEME, 2014): 3
action-areas and 7 pillars.
Conclusions:
The analysis presented above suggests the following:
► In the foreseeable future, the consumption of rare earths will be driven by demand for rare earth
permanent magnets. These magnets are essential in the context of the energy transition.
► In terms of supply risks, the issue is “access to rare earths” rather than “geological scarcity”. Access
is influenced by a variety of factors that are primarily geopolitical, economic and social (the
extractive industry’s social license to operate).
► While it is essential to recycle in the context of the circular economy, it should be more widely
recognized that if demand is increasing, as is the case for rare earths but also for a wide variety of
other specialty and base metals, recycling can only provide part of the solution. The reliance on
primary (extracted) mineral resources is inevitable (whether from domestic extraction or from
imports).
Recommendations:
► Europe should take more responsibility for its own requirements in terms of mineral resources.
Progress is required with respect to the sustainable supply of mineral raw materials. The particular
issue of mining waste management remains extremely sensitive.
10Selected references
ADEME, 2014. The circular economy (in French). http://www.ademe.fr/expertises/economie-
circulaire/leconomie-circulaire
Binnemans, K., Jones, P.T., Blanpain, B., Van Gerven, T., Yang, Y., Walton, A., Buchert, M. 2013.
Recycling of rare earths: a critical review. J. Clean. Prod. 51, 1-22.
Bru, K., Christmann, P., Labbé, J.-F., Lefebvre, G. 2015. Panorama 2014 du marché des Terres Rares.
Rapport public BRGM/RP-64330-FR. 193 pp. (in French).
Castilloux, R. 2014. Rare earth market outlook: supply, demand, and pricing from 2014 – 2020. Adamas
Intelligence, 573, October 2014.
DERA, 2016. Rohstoffe für Zukunftstechnologien 2016.
EC, 2008. The raw materials initiative - meeting our critical needs for growth and jobs in Europe.
Communication from the Commission to the European Parliament and the Council. COM(2008) 699
final.
EC, 2016. Raw materials scoreboard. Report of the European Commission, Brussels.
EC, 2017. Study on the review of the list of Critical Raw Materials. Criticality Assessments. European
Commission, Brussels.
Guyonnet, D., Planchon, M., Rollat, A., Escalon, V., Tuduri, J., Charles, N., Vaxelaire, S., Dubois, D.,
Fargier, H. 2015. Material flow analysis applied to rare earth elements in the EU-28. Journal of
Cleaner Production, 107: 215-228.
Marscheider-Weidemann, F., Langkau, S., Hummen, T., Erdmann, L., Tercero Espinoza, L., Angerer, G.,
Marwede, M. & Benecke, S. 2016. Rohstoffe für Zukunftstechnologien 2016. DERA
Rohstoffinformationen, 28:353 S., Berlin.
Menad, N., Seron, A., Save, M., Ménard, Y., Maat, N., Le Breton, J.-M., Nachbaur, V., Bizouard, A.,
Delain, M., Waignein, L., Hennion, R., François, O., Von der Weid, F. 2016. Recovery of permanent
magnets type NdFeB from WEEE. 6th International Conference on Engineering for Waste and
Biomass Valorisation, May 2016, Albi, France.
Rademaker, J.H., Kleijn, R., Yang, Y. 2013. Recycling as a strategy against rare earth element criticality:
a systemic evaluation of the potential yield of NdFeB magnet recycling. Environmental Science &
Technology, 47, 10129-10136.
Rollat, A., Guyonnet, D., Planchon, M., Tuduri, J. 2016. Prospective analysis of the flows of certain rare
earth flows in Europe at the 2020 horizon. Waste Management, 49: 427-436.
Seron, A. and Menad, N. 2017. Method for extraction of rare earth elements contained in magnets.
Patent WO 2017/207947 A1.
Zepf, V. 2013. Rare Earth Elements. A NewApproach to the Nexus of Supply, Demand and Use:
Exemplified along the Use of Neodymium in Permanent Magnets (Ph.D. thesis of the University of
Augsburg, Germany). Springer Publisher, p. 157.
11You can also read