Reaching New Heights
 as a Global Company
←
→
Page content transcription
If your browser does not render page correctly, please read the page content below
Reaching New Heights as a Global Company
Profile

Sumitomo Chemical is one of Japan’s leading chemical companies, offering a diverse

range of products in the fields of basic chemicals, petrochemicals, fine chemicals, IT-

related chemicals and materials, agricultural chemicals, and pharmaceuticals.

We continue our efforts to expand our business globally and achieve higher prof-

itability in order to enhance value for our shareholders and other stakeholders. At

the same time, we remain dedicated to the sustainable development of society by

continually delivering innovative products and technologies and committing our-

selves to quality, health, safety and the environment in all aspects of business.

Forward-looking Statements

Statements made in this annual report with respect to plans, strategies and future performance that are not historical facts are forward-looking state-
ments involving risks and uncertainties. Sumitomo Chemical cautions that a number of factors could cause actual results to differ materially from such
statements including, but not limited to, general economic conditions in Sumitomo Chemical’s markets; demand for, and competitive pricing pressure
on, Sumitomo Chemical’s products in the marketplace; Sumitomo Chemical’s ability to continue to win acceptance for its products in these highly
competitive markets; and movements of currency exchange rates.
Contents

 2 Consolidated Financial Highlights

 4 To Our Shareholders, Customers and Partners

 7 Special Feature: The Rabigh Project

12   Sumitomo Chemical at a Glance
14   Business Sector Highlights
16   Basic Chemicals
18   Petrochemicals & Plastics
20   Fine Chemicals
22   IT-related Chemicals
24   Agricultural Chemicals
26   Pharmaceuticals

30 Research and Development

34   Corporate Social Responsibility
38   Corporate Governance
40   Compliance
42   Board of Directors & Corporate Auditors

43 Financial Section

80 Subsidiaries and Affiliates
85 Investor Information and Corporate Information

                                                    1   Annual Report 2009
Consolidated Financial Highlights
Sumitomo Chemical Company, Limited and Subsidiaries
*Unless otherwise specified
Billions of yen* Thousands of
US dollars*
Years ended March 31 2005 2006 2007 2008 2009 2009
Income statement
Net sales ¥ 1,296.3 ¥ 1,556.6 ¥ 1,790.0 ¥ 1,896.5 ¥ 1,788.2 $18,204,449
Net sales from overseas operations 486.2 611.0 747.8 788.8 749.8 7,633,218
Operating income (loss) 105.2 120.8 139.6 102.4 2.1 21,521
Net interest expenses (3.0) (2.2) (3.9) (2.8) (2.7) (27,212)
Equity in earnings of affiliates 26.7 26.8 23.6 11.2 (12.8) (130,418)
Net income (loss) 64.5 90.7 93.9 63.1 (59.2) (602,301)
Depreciation and amortization expenses 88.2 104.9 113.9 125.0 140.7 1,432,424
Research and development expenses 78.2 91.9 97.7 105.4 131.1 1,334,857
Cash flows
Cash flows from operating activities 159.8 122.8 142.9 156.6 78.4 798,412
Cash flows from investing activities (118.0) (180.7) (164.2) (182.7) (206.2) (2,099,532)
Free cash flows 41.8 (57.9) (21.3) (26.1) (127.8) (1,301,120)
Cash flows from financing activities (31.2) 70.6 35.6 7.1 112.5 1,145,668
Balance sheet
Total assets 1,648.8 2,178.4 2,324.9 2,358.9 2,022.6 20,589,973
Total net assets 569.6 719.8 1,030.5 1,006.0 775.6 7,896,040
Interest-bearing liabilities 470.7 578.6 641.0 673.9 795.4 8,096,987
Others
Capital expenditures 125.8 124.9 159.8 142.5 134.1 1,365,163
Number of employees 20,195 24,160 24,691 25,588 26,902 —
Per share (yen, US dollars)
Earnings 38.9 54.8 56.8 38.2 (35.8) (0.365)
Book-value 344.6 435.5 479.9 465.2 329.7 3.357
Dividends 8.0 10.0 12.0 12.0 9.0 0.092
Ratios
ROA (%) 6.6 6.3 6.2 4.4 0.1 —
ROE (%) 12.0 14.1 12.4 8.1 (9.0) —
Debt equity ratio (times) 0.70 0.61 0.62 0.67 1.03 —
Shareholders’ equity ratio (%) 34.5 33.0 34.1 32.6 26.9 —
Note: US dollar amounts are translated from yen, for convenience only, at ¥98.23 = $1, the rate prevailing on March 31, 2009.
ROA = operating income / average of total assets as of the begining and the end of each fiscal year
ROE = net income / average of total net assets less minority interests as of the begining and the end of each fiscal year
Sumitomo Chemical Company, Limited 2Net Sales & Operating Margin Debt Equity Ratio
Financial Highlights
(Billions of yen) (Times)
0 500 1,000 1,500 2,000 0 0.2 0.4 0.6 0.8 1.0
Consolidated
’02/3 1,018.4 6.8 ’02/3 0.9
’03/3 1,111.1 6.6 ’03/3 0.9
’04/3 1,158.4 5.8
’04/3 0.8
’05/3 1,296.3 8.1
’05/3 0.7
’06/3 1,556.6 7.8
’06/3 0.6
’07/3 1,790.0 7.8
’07/3 0.6
’08/3 5.4 1,896.5
’09/3 0.1 1,788.2 ’08/3 0.7
’09/3 1.0
0 2.5 5.0 7.5 10.0
Net sales (Top axis) Operating margin (Bottom axis) (%)
Earnings Per Share (Yen) Dividends Per Share (Yen)
-40 -20 0 20 40 60 0 3 6 9 12
’02/3 18.3 ’02/3 6.0
’03/3 18.7 ’03/3 6.0
’04/3 20.7 ’04/3 6.0
’05/3 38.9 ’05/3 8.0
’06/3 54.8 ’06/3 10.0
’07/3 56.8 ’07/3 12.0
’08/3 38.2 ’08/3 12.0
’09/3 -35.8 ’09/3 9.0
Capital Expenditures (Billions of yen) Research and Development Expenses (Billions of yen)
0 50 100 150 200 0 20 40 60 80 100 120 140
’02/3 73.0 ’02/3 66.7
’03/3 152.0 ’03/3 72.8
’04/3 110.2 ’04/3 75.2
’05/3 125.8 ’05/3 78.2
’06/3 124.9 ’06/3 91.9
’07/3 159.8 ’07/3 97.7
’08/3 142.5 ’08/3 105.4
’09/3 134.1 ’09/3 131.1
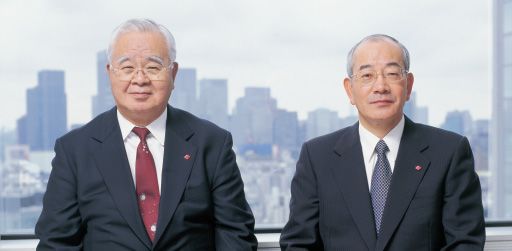
3 Annual Report 2009To Our Shareholders, Customers and Partners
Hiromasa Yonekura Hiroshi Hirose
Chairman President
Performance for Fiscal 2008 sales volumes and prices, in addition to the impact of inven-
tory write-downs resulting from the valuation by the lower-
Amid a global economic crisis that is being called a “once-in-a- of-cost-or-market method in view of the deterioration of
century tsunami,” the Sumitomo Chemical Group experienced market prices toward the end of fiscal 2008. Ordinary
a challenging year in fiscal 2008. We posted net sales of income decreased to a loss of ¥32.6 billion because of a
¥1,788.2 billion, ¥108.3 billion lower than the previous year and decline in equity in earnings of affiliates by ¥24.0 billion
the first time in seven years that we have recorded a decrease from a year earlier, owing to lower earnings of
in net sales. Sales for the Basic Chemicals and Petrochemicals Petrochemical Corporation of Singapore, and an increase in
& Plastics Sectors significantly decreased because of a sharp foreign exchange losses by ¥7.6 billion, in addition to lower
fall in demand and a decline in selling prices in the second operating income. We also posted extraordinary items such
half of fiscal 2008, while we achieved higher sales in the IT- as impairment losses of ¥20.8 billion and expenses of ¥19.6
related Chemicals and Agricultural Chemicals Sectors. billion for reversal of deferred tax assets. As a result, we
reported a net loss of ¥59.2 billion for fiscal 2008, compared
Our operating income fell to ¥2.1 billion, compared to to net income of ¥63.1 billion for the previous year.
¥102.4 billion for the previous year. The Basic Chemicals,
Petrochemicals & Plastics, and Fine Chemicals Sectors report- Given these results, we have declared a year-end dividend of ¥3
ed significant declines in operating income due to lower per share. When the interim dividend of ¥6 per share is included,
Sumitomo Chemical Company, Limited 4Naphtha Price Foreign Exchange Rate
(¥/KL) (¥/$US)
90,000 140
120
60,000
100
Customers and Partners
To Our Shareholders,
30,000
80
0 0
’04/2Q ’05/2Q ’06/2Q ’07/2Q ’08/2Q ’09/1Q ’04/4 ’05/4 ’06/4 ’07/4 ’08/4 ’09/3
the annual dividend for fiscal 2008 is ¥9 per share. Although the tiveness, making for a robust and resilient business in the
business environment remains difficult, we are determined to face of an increasingly volatile market environment.
turn around our performance during fiscal 2009 by thoroughly
streamlining operations and achieving greater efficiency across In the same month as Petro Rabigh began its operation,
all Sectors while strictly controlling expenditures and to Sumitomo Chemical, Saudi Aramco and Petro Rabigh signed
enhance value for our shareholders and other stakeholders. a Memorandum of Understanding to commence a feasibility
study for developing the Rabigh Phase II Project, an expan-
Progress on Initiatives under sion of the Rabigh complex. The Phase II Project is designed
the Three-Year Corporate Business Plan to expand Petro Rabigh’s existing ethane cracker and con-
struct new production facilities for aromatics and various
During fiscal 2008, we made further progress in the major other petrochemicals. We will complete the study by the
initiatives under our Corporate Business Plan for the three third quarter of 2010, and once its viability is confirmed, the
years from fiscal 2007 through 2009. Phase II Project will be implemented with a targeted start up
by the third quarter of 2014.
The Rabigh Project
Progress on Major Research and
The Rabigh Project, our joint undertaking with Saudi Development Projects
Aramco, the world’s largest oil company, to build a world-
scale integrated oil refining and petrochemical complex in We at Sumitomo Chemical have a strong conviction that
Rabigh, Saudi Arabia, started up its operation in April 2009. research and development is the major engine of our future
Our subsidiary Sumitomo Chemical Asia, which is in charge business growth. We are concentrating R&D resources on our
of marketing the petrochemical products produced in the priority areas of IT-related materials, energy-related materials
Rabigh complex, is expecting its sales to get into full swing and life sciences. Our primary focus in the field of IT-related
in the third quarter of 2009. We are confident that, fortified materials is on the development of polymer organic light emit-
by a stable supply of feedstock with a significant cost advan- ting diodes (PLEDs), which are gaining global attention as a next-
tage, this flagship project will deliver outstanding competi- generation display technology. During fiscal 2008, we
5 Annual Report 2009established our Device Development Center in Japan in order to Turning Challenges into Opportunities
accelerate the development of manufacturing technologies
for PLED display panels. Partnering with display manufactur- According to an old proverb, when a strong wind blows,
ers, we are aiming to commercialize our PLED technology in you can tell which grasses are the strongest. Strong winds
two to three years for large-screen televisions, the applica- are still blowing in all parts of the world, but we are firmly
tion where we expect PLEDs to be best able to demonstrate determined to turn these challenges into opportunities and
their distinctive advantages, such as their competitive pro- propel Sumitomo Chemical to new heights as a global com-
duction cost and excellent picture quality. In addition, we are pany. In addition to taking bold steps to restore our short-
developing flexible displays and interior lighting devices, cap- term performance during fiscal 2009, we are also working to
italizing on the characteristics of PLEDs that make possible formulate our new long-term corporate strategy that sets
the production of thin, light and flexible panels. out where we aim to go in ten to twenty years’ time beyond
this current storm. Based on this long-term strategy, we will
In the area of energy-related materials, we have commercial- develop our corporate business plan for fiscal 2010 through
ized high-performance separators for lithium-ion secondary 2012 as well as business strategies that will enable us to
batteries. Our separator, Pervio , which demonstrates greater
®
achieve sustainable growth and greater value for our share-
heat resistance than conventional products and has received holders and other stakeholders.
high praise from battery manufacturers for its reliability, is
enjoying growing demand for use in mobile devices. We are We would like to express our heartfelt gratitude to you for
currently accelerating the development of heat-resistant sep- all of the encouragement and support you have shown dur-
arators for lithium-ion secondary batteries for use in hybrid ing this challenging time, and would greatly appreciate your
vehicles. We are also developing cathode materials for lithi- continued assistance and cooperation.
um-ion secondary batteries. Compared to conventional mate-
rials, our cobalt-free cathode material has achieved higher
output and an equivalent level of capacity without using
cobalt, a rare metal that is in short supply worldwide. Our July 2009
cobalt-free cathode material is currently being evaluated by
automobile and battery manufacturers for commercial use in
hybrid vehicles and industrial applications.
Hiromasa Yonekura
In the life science field, the development of lurasidone, an Chairman
agent for the treatment of schizophrenia and bipolar disor-
der, has made remarkable advances. Our subsidiary
Dainippon Sumitomo Pharma (DSP) has been working on
Phase III clinical trials of lurasidone in the US, Europe, Japan Hiroshi Hirose
President
and other countries. In May 2009, DSP announced that
lurasidone achieved positive results in its first Phase III clinical
trial for the treatment of patients with schizophrenia.
Lurasidone has the potential to achieve higher efficacy and
fewer side effects than current major schizophrenia drugs on
the market, and DSP is planning to launch lurasidone in 2011
in the US, the world’s largest schizophrenia drug market.
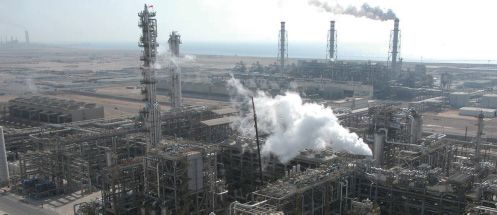
Sumitomo Chemical Company, Limited 6Special Feature: The Rabigh Project
7 Annual Report 2009Special Feature: The Rabigh Project
The Rabigh Project—our joint undertaking in Saudi
Arabia with Saudi Aramco, the world’s largest oil compa-
ny, to establish a world-scale integrated oil refining and
petrochemical complex—started operations in April 2009.
Rabigh
This massive project not only considerably strengthens Saudi
Arabia
the competitiveness of our petrochemical business, but
also represents a major step in the further globalization
of the Sumitomo Chemical Group.
Rabigh complex
History of the Rabigh Project Construction commenced in March 2006, with a planned invest-
ment totaling US$9.8 billion—approximately 60% of which, or
Sumitomo Chemical and Saudi Aramco started the Rabigh US$5.8 billion, was procured through project finance.
Project with the aim of building integrated oil refining and petro- In January 2008, Petro Rabigh had its initial public offering
chemical operations by upgrading Saudi Aramco’s oil refinery (IPO) on the Saudi Arabian stock exchange, and this changed
and constructing a new petrochemical complex. We concluded a the ownership of the company by Sumitomo Chemical and
joint venture agreement with Saudi Aramco in August 2005 and Saudi Aramco to 37.5% each. In October 2008, Saudi Aramco
established Petro Rabigh, an equally-owned joint venture to run transferred its oil refinery to Petro Rabigh, and the newly com-
the Rabigh complex, in September of the same year. pleted Rabigh complex began operations in April 2009.
Sumitomo Chemical Company, Limited 8Overview of the Rabigh Complex
Crude Oil Topper Naphtha Easy Processing PE
(2,900,000 tons/year) (250,000 tons/year)
400,000 barrels/day C4 LLDPE
Kerosene (350,000 tons/year)
HDPE
Residual Oil Gas Oil (300,000 tons/year)
Butane Gasoline MEG
(2,800,000 tons/year) (600,000 tons/year)
Fuel Oil Products, etc. PP[Homo]
HOFCC (350,000 tons/year)
Ethane Ethylene PP[Block]
Ethane Cracker (1,300,000 tons/year) (350,000 tons/year)
1,200,000 tons/year Propylene PO
(900,000 tons/year) (200,000 tons/year)
Major feedstock Refined petroleum products Petrochemical products
The Rabigh Project
Special Feature:
Overview of Complex and Main Products We expect the Rabigh complex to achieve significant opera-
tional efficiency and realize economies of scale through the
The Rabigh complex utilizes 400,000 barrels per day of crude full integration of its oil refining and petrochemical operations.
oil and 1.2 million tons per year of ethane as primary feed- Its ethane feedstock, procured at the official price under an
stocks to produce a variety of refined petroleum products and agreement concluded with the Saudi government, has a sig-
petrochemical products. The refinery transferred from Saudi nificant cost advantage over naphtha or ethane available on
Aramco to Petro Rabigh has mainly been producing 8 million US and European markets. This complex also takes full advan-
tons of heavy oil, 5.3 million tons of light oil, 3 million tons of tage of the expertise and cutting-edge technologies for petro-
naphtha and 2.6 million tons of kerosene annually. This refin- chemical production and oil refining that Sumitomo Chemical
ery was upgraded to include a high olefin fluid catalytic crack- and Saudi Aramco have cultivated over many years.
ing unit (HOFCC) for converting heavy and light oils to Capitalizing on these strengths, the complex promises out-
gasoline and other distillates, which added new annual capac- standing competitiveness and resilience in the face of increas-
ities of 2.8 million tons of gasoline and 900,000 tons of ing market fluctuations.
propylene, a feedstock for petrochemical products.
Petro Rabigh converts ethane gas with its world-scale Logistics and Marketing Network
ethane cracker to 1.3 million tons of ethylene per year. It then
uses this ethylene to produce easy processing polyethylene Petro Rabigh’s refined petroleum products are marketed by
(EPPE), linear low-density polyethylene (LLDPE), high-density Saudi Aramco, and Petro Rabigh’s petrochemical products are
polyethylene (HDPE) and mono ethylene glycol (MEG). In addi- marketed mainly by Sumitomo Chemical Asia. In addition to its
tion, homo polypropylene (PP), block PP, and propylene oxide home base in Singapore, Sumitomo Chemical Asia has estab-
(PO), a raw material for urethane, are produced from propy- lished a total of 5 sales offices in China, Belgium, India and
lene made by the HOFCC. Vietnam and has engaged a staff of approximately 100 people
9 Annual Report 2009to market these petrochemical products in Asia and Europe. East Asia. We have established stock points for PE and PP in
Furthermore, in order to support the marketing, we have Singapore, Belgium, the Netherlands, Italy and Turkey and stor-
built a new, broad logistics network extending from Europe to age tanks for MEG and PO in Singapore and China.
Logistics and Marketing Network
Sales office
Rabigh Polymer stock point
Monomer tank
The Rabigh Project’s Position while we are also increasing our marketing efforts in
in Our Petrochemical Business European markets. In our Singapore and US bases, we are
producing premium products, such as PP for the automotive
We have been producing petrochemical products at our industry, that are tailored to the needs of local customers in
bases of operation in Japan, Singapore and North America. the markets of Asia and North America. In the field of pre-
The establishment of our new base in Saudi Arabia with best- mium products, we are working to effectively meet local
in-class cost competitiveness has enabled us to tremendously customers’ exacting needs by utilizing our robust product
strengthen our petrochemical business. development capabilities and advanced production tech-
Each of our four bases of operation serves markets by uti- nologies, thus differentiating ourselves from newly built
lizing its own distinctive competitive advantage. The Rabigh petrochemical plants in the Middle East and China. In
complex in Saudi Arabia takes full advantage of its over- Japan, we will continue to focus on the development and
whelming cost competitiveness to produce large volumes of production of innovative, high-end functional products and
commodity petrochemicals. These products are being mar- make full use of our R&D capabilities cultivated through
keted primarily in China and other Asian markets where many years of efforts to satisfy the sophisticated needs of
strong medium- to long-term demand growth is expected, local customers.
Sumitomo Chemical Company, Limited 10Feasibility Study for Phase II of
Sumitomo Chemical’s Production Capacity by Area
(Unit: Thousand tons) the Rabigh Project
Japan
Japan 316 In April 2009, Sumitomo Chemical, Saudi Aramco and Petro
Saudi
355
Saudi Arabia
700 Rabigh signed a Memorandum of Understanding to launch a
Arabia Singapore Singapore
900 255 630 feasibility study for development of the Rabigh Phase II
US
360 Project. The Phase II Project will include expansion of Petro
Rabigh’s ethane cracker for processing an additional 30 mil-
Polyethylene Polypropylene
(PE) (PP) lion standard cubic feet per day of ethane feedstock; con-
Saudi struction of a new aromatics complex using approximately 3
Arabia
200 Japan million tons of naphtha annually; and construction of new
381
facilities for production of various petrochemical products,
including ethylene propylene rubber (EPR), thermoplastic
The Rabigh Project
Special Feature:
Propylene olefin (TPO), methyl methacrylate monomer and polymer
Oxide (PO)
(MMA and PMMA), low-density polyethylene (LDPE), ethyl-
ene vinyl acetate (EVA), caprolactam, polyols, cumene, phe-
Structure of Sumitomo Chemical’s nol, acetone, acrylic acid, superabsorbent polymer (SAP)
Petrochemical Business
and nylon 6. Saudi Aramco and Sumitomo Chemical will
Highly functional products complete the feasibility study by the third quarter of 2010.
TPE, Acryft, terpolymer PP,
random PP, plastomer Once its viability is confirmed, the Rabigh Phase II Project
will be implemented with a targeted start up by the third
Premium products
PP automotive materials,
quarter of 2014.
EPPE, EVA, PG
Commodity products
Homo-PP, LDPE, LLDPE, PO
The Conversion Industry
In order to further enhance the resilience and competitiveness of Petro Rabigh’s operations in an increasingly volatile busi-
ness environment, Sumitomo Chemical and Saudi Aramco are developing an industrial park on the land adjacent to the
Rabigh complex and working to attract plastics-processing and other conversion industry businesses. Currently, an indus-
trial site that includes facilities for electrical power, water supply and drainage, and communications is being built on the
240-hectare site. This industrial park offers several unique advantages, such as a stable supply of resins from Petro
Rabigh, low-cost electrical power, and easy access to the markets of the Middle East and North Africa, where robust
growth is expected, as well as Europe. Furthermore, we plan to establish a technical center to provide technical support
for the tenants in the industrial park, some of whom are expected to start commercial operations as early as 2010.
11 Annual Report 2009Sumitomo Chemical at a Glance
Net Sales Operating Income
FY2008 FY2008
¥240.0 Billion -¥15.3 Billion
Basic Chemicals
13% ¥0
[ FY2007 ¥314.7 Billion ] [ FY2007 ¥10.6 Billion ]
FY2008 FY2008
¥553.0 Billion -¥30.3 Billion
Petrochemicals
& Plastics 31% ¥0
[ FY2007 ¥603.3 Billion ] [ FY2007 ¥4.5 Billion ]
FY2008 FY2008
¥80.8 Billion ¥1.6 Billion
Fine Chemicals
5% ¥0
[ FY2007 ¥92.9 Billion ] [ FY2007 ¥11.4 Billion ]
FY2008 FY2008
¥307.1 Billion -¥1.0 Billion
IT-related
Chemicals 17% ¥0
[ FY2007 ¥297.5 Billion ] [ FY2007 ¥6.3 Billion ]
FY2008 FY2008
¥222.2 Billion ¥24.4 Billion
Agricultural
Chemicals
12% ¥0
[FY2007 ¥200.4 Billion ] [ FY2007 ¥20.9 Billion ]
FY2008 FY2008
¥235.6 Billion ¥32.4 Billion
Pharmaceuticals
13% ¥0
[ FY2007 ¥237.6 Billion ] [FY2007 ¥46.5 Billion ]
Sumitomo Chemical Company, Limited 12Research and
Capital Expenditures Development Expenses Major Products Page
FY2008 FY2008
¥14.7 Billion ¥6.4 Billion Acrylonitrile, Caprolactam, Aniline, Methanol,
Methyl methacrylate monomer and polymer, ▼
Nitric acid, Caustic soda, Aluminum hydroxide,
Alumina, High-purity aluminum, Aluminum
P 16
11% 5%
[ FY2007 ¥27.6 Billion ] [ FY2007 ¥6.1 Billion ]
Ethylene, Propylene, Styrene monomer,
FY2008 FY2008
Propylene oxide, Polyethylene, Polypropylene,
¥17.6 Billion ¥12.0 Billion Ethylene-vinyl acetate copolymer,
Thermoplastic elastomer, ▼
Ethylene-propylene rubber,
Acrylonitrile butadiene styrene copolymer,
P 18
13% 9% Polycarbonate, Agricultural films,
[ FY2007 ¥21.2 Billion ] [ FY2007 ¥11.1 Billion ] Polypropylene sheets
FY2008 FY2008
Organic intermediates,
¥7.7 Billion ¥4.2 Billion Active pharmaceutical ingredients,
Pharmaceutical intermediates, Polymer additives, ▼
Photo and imaging chemicals,
Organic rubber chemicals, Dyestuffs,
P 20
6% 3% Ethylene-vinylacetate copolymer emulsions
[ FY2007 ¥6.9 Billion ] [ FY2007 ¥4.1 Billion ]
Business Sector
FY2008 FY2008 Optical functional films,
¥50.6 Billion ¥21.2 Billion Pigment dispersed color filters,
Light diffusion plates, Light guide plates,
Photoresists, High-purity chemicals,
▼
Sputtering targets, Super engineering plastics, P 22
38% 16% MOEPI wafers, Metal organics,
High-purity gallium
[ FY2007 ¥33.4 Billion ] [ FY2007 ¥13.7 Billion ]
FY2008 FY2008
Crop protection products (Insecticides,
¥11.3 Billion ¥20.7 Billion Fungicides, Herbicides and Plant growth
regulators), Household insecticides, ▼
Public hygiene insecticides,
Long-lasting insecticidal nets, Animal health
P 24
8% 16% products, Feed additives, Fertilizers
[FY2007 ¥8.5 Billion ] [ FY2007 ¥19.4 Billion ]
FY2008 FY2008
¥12.7 Billion ¥55.0 Billion
Ethical pharmaceuticals,
Radiopharmaceuticals,
▼
Radiation therapy equipment P 26
9% 42%
[FY2007 ¥18.3 Billion ] [FY2007 ¥47.7 Billion ]
13 Annual Report 2009Business Sector Highlights
*Unless otherwise specified
Thousands of
Billions of yen* US dollars*
Years ended March 31 2005 2006 2007 2008 2009 2009
Net sales
Basic Chemicals ¥ 225.8 ¥ 252.4 ¥ 314.0 ¥ 314.7 ¥ 240.0 $ 2,443,551
Petrochemicals & Plastics 412.6 486.1 539.1 603.3 553.0 5,629,380
Fine Chemicals 84.1 79.0 90.9 92.9 80.8 822,183
IT-related Chemicals 174.8 229.2 266.4 297.5 307.1 3,126,550
Agricultural Chemicals 171.6 186.2 198.3 200.4 222.2 2,262,058
Pharmaceuticals 170.7 233.1 234.5 237.6 235.6 2,398,351
Others 56.7 90.6 146.8 150.1 149.5 1,522,376
Total 1,296.3 1,556.6 1,790.0 1,896.5 1,788.2 18,204,449
Operating income (loss)
Basic Chemicals 5.2 10.0 13.5 10.6 (15.3) (156,103)
Petrochemicals & Plastics 15.0 17.9 23.6 4.5 (30.3) (308,836)
Fine Chemicals 11.5 9.8 13.1 11.4 1.6 16,583
IT-related Chemicals 18.7 21.7 3.5 6.3 (1.0) (10,139)
Agricultural Chemicals 14.8 16.6 23.3 20.9 24.4 248,692
Pharmaceuticals 34.4 38.3 56.2 46.5 32.4 329,329
Others 5.7 5.8 8.0 3.7 (7.9) (80,331)
Elimination (0.1) 0.7 (1.5) (1.5) (1.7) (17,674)
Total 105.2 120.8 139.6 102.4 2.1 21,521
Capital expenditures
Basic Chemicals 18.2 20.7 24.6 27.6 14.7 149,628
Petrochemicals & Plastics 13.7 16.1 16.9 21.2 17.6 178,662
Fine Chemicals 7.5 7.0 4.6 6.9 7.7 78,774
IT-related Chemicals 40.2 44.0 72.0 33.4 50.6 515,372
Agricultural Chemicals 18.0 8.8 10.1 8.5 11.3 114,782
Pharmaceuticals 19.1 10.6 12.5 18.3 12.7 128,861
Others 9.1 17.7 19.1 26.7 19.6 199,084
Total 125.8 124.9 159.8 142.5 134.1 1,365,163
Research and development expenses
Basic Chemicals 5.1 5.3 5.7 6.1 6.4 64,868
Petrochemicals & Plastics 10.9 11.4 11.3 11.1 12.0 122,386
Fine Chemicals 4.4 4.4 4.2 4.1 4.2 42,991
IT-related Chemicals 9.7 12.8 12.6 13.7 21.2 215,800
Agricultural Chemicals 18.6 19.4 18.7 19.4 20.7 210,832
Pharmaceuticals 28.1 36.7 42.5 47.7 55.0 559,666
Others 1.4 1.9 2.6 3.3 11.6 118,314
Total 78.2 91.9 97.7 105.4 131.1 1,334,857
Note: US dollar amounts are translated from yen, for convenience only, at ¥98.23 = $1, the rate prevailing on March 31, 2009.
Sumitomo Chemical Company, Limited 14Net Sales Operating Income
(Billions of yen) (Billions of yen)
0 500 1,000 1,500 2,000 -60 -30 0 30 60 90 120 150
’02/3 1,018.4 ’02/3 68.8
’03/3 1,111.1 ’03/3 73.5
’04/3 1,158.4 ’04/3 66.6
’05/3 1,296.3 ’05/3 105.2
’06/3 1,556.6 ’06/3 120.8
’07/3 1,790.0 ’07/3 139.6
’08/3 1,896.5 ’08/3 102.4
’09/3 1,788.2 ’09/3 2.1
Basic Chemicals Petrochemicals & Plastics Fine Chemicals IT-related Chemicals
Agricultural Chemicals Pharmaceuticals Others
Business Sector
Capital Expenditures Research and Development Expenses
(Billions of yen) (Billions of yen)
0 60 120 180 0 30 60 90 120 150
’02/3 73.0 ’02/3 66.7
’03/3 152.0 ’03/3 72.8
’04/3 110.2 ’04/3 75.2
’05/3 125.8 ’05/3 78.2
’06/3 124.9 ’06/3 91.9
’07/3 159.8 ’07/3 97.7
’08/3 142.5 ’08/3 105.4
’09/3 134.1 ’09/3 131.1
15 Annual Report 2009Basic Chemicals
Net Sales
FY2008
¥240.0 Billion
13%
[ FY2007 ¥314.7 Billion ]
Net Sales & Operating Margin
(Billions of yen)
-200 -100 0 100 200 300
The Basic Chemicals Sector engages result, sales for this Sector decreased by
’05/3 2.3 225.8 in the development, manufacture ¥74.7 billion compared with the previ-
’06/3 4.0 252.4 and sale of methyl methacrylate ous year to ¥240.0 billion while operat-
’07/3 4.3 314.0
(MMA) monomer and polymer, raw ing income fell by ¥25.9 billion,
’08/3 3.4 314.7
materials for synthetic textile fibers resulting in a loss of ¥15.3 billion.
’09/3 -6.4 240.0
such as caprolactam, and a wide vari-
-10 -5 0 5 10 15
(%)
ety of basic chemicals used in various MMA Business
Net sales (Top axis)
Operating margin (Bottom axis) manufacturing industries, as well as
alumina and other inorganic materi- MMA polymer, which offers outstand-
als and aluminum. ing transparency and weather resist-
Capital Expenditures &
Operating Income before Depreciation We have positioned MMA, capro- ance, is an excellent material for a broad
(Billions of yen)
0 10 20 30 lactam and inorganic materials as the range of uses, such as in optical compo-
core businesses of the Sector. We are nents for liquid crystal displays (LCDs),
’05/3 16.0 18.2
working to strengthen the profitabil- automotive applications, showcases,
’06/3 21.8 20.7
’07/3 27.0 24.6
ity of these businesses and continue and outdoor signboards. Asia’s demand
’08/3 23.9 27.6 expanding them globally with a focus for MMA polymer decreased during fis-
’09/3 1.9 14.7 on Asia, where demand growth is cal 2008 because of lower production
expected to remain high. levels in the LCD panel and automotive
Capital expenditures
Operating income before depreciation segments, but is expected to grow over
the long term by as much as 5% per
Performance for Fiscal 2008 year with economic expansion in Asian
Total Assets & ROA
(Billions of yen)
-300 0 150 300
In fiscal 2008, sales of aluminum and
’05/3
2.8 192.9 raw materials for synthetic fibers
’06/3 4.9 216.5 decreased because of a significant
’07/3 5.7 253.6 decline in demand for building materi-
’08/3 4.1 257.1
als and textiles and a sharp drop in
’09/3 -6.7 200.2
prices in the second half of fiscal 2008.
-10 0 5 10 Meanwhile, sales of methyl methacry-
(%)
Total assets (Top axis)
ROA (Bottom axis) late contracted because of a slowdown
in shipments, primarily in Japan. As a Products made of MMA
Sumitomo Chemical Company, Limited 16countries, particularly China and India. op acrylic sheet products with new func- Inorganic Materials Business
As Asia’s leading MMA producer, we tions by capitalizing on our advanced
continue to enhance the competitive- MMA processing technologies and We provide distinctive high perform-
ness of our entire MMA product chain, expertise accumulated over many years. ance inorganic materials using our
from monomer and polymer to finished advanced technologies for controlling
sheets. During fiscal 2008, our Singa- Caprolactam Business such physical properties as particle size
pore subsidiary completed its Phase III and form. Sumitomo Chemical is the
capacity expansion, increasing its capaci- Caprolactam is a raw material for nylon world’s leading manufacturer of high-
ties for MMA monomer by 90,000 tons 6, which is used in synthetic fibers, films purity alumina. We launched high-purity
to 223,000 tons per year and for MMA and engineering plastics. Demand for alumina in 1981, and we have since
polymer by 50,000 tons to 100,000 tons nylon 6 in Asia, particularly China, is been working to develop high-purity
per year. Our current overall annual very strong for applications in clothing alumina products using our high-purity
MMA capacities, combining our opera- textiles, engineering plastics and tire aluminum to fulfill the needs for
tions in Singapore, Japan and Korea, cords, and demand for caprolactam in advanced applications. In recent years,
totaled 489,000 tons for monomer and the region has been growing at 4% to our alumina products have enjoyed
262,000 tons for polymer. 5% annually in recent years. Demand increasing demand for use in new
for caprolactam declined considerably applications such as sapphire glass for
in the second half of fiscal 2008 due to LED substrates, lithium-ion secondary
the global economic downturn, but is battery materials and high thermal
expected to resume its strong growth conductive fillers for electronic materi-
when the world economy begins to als. We also manufacture and sell fine
recover. We produce caprolactam using alumina for LCD and solar cell glass
the conventional liquid-phase process substrates, as well as aluminum
Basic Chemicals
as well as our proprietary energy- and hydroxide for artificial marble and halo-
resource-efficient vapor-phase process. gen-free flame-retardants. In addition,
MMA plant in Singapore We are working constantly to improve we are working to develop new appli-
both of these processes in order to pro- cations for our ultraviolet-sensitive
In April 2008, we established the vide our customers with cost-competi- photocatalysts for outdoor use and
acrylic sheet sales company Sumika Acryl tive, high quality caprolactam. also for our high-performance visible-
Co., Ltd. in Japan in order to meet the light sensitive photocatalysts, which
needs of our domestic customers in a eliminate odors and dirt by reacting to
more prompt and flexible manner. Also, indoor light.
in January 2009, our Taiwan subsidiary
Sumipex TechSheet Co., Ltd. acquired a
local acrylic sheet business and started
operations. The Taiwan subsidiary gives
us a third base in the Asian region for the
manufacture and sale of acrylic sheets in
addition to Sumitomo Chemical and Caprolactam for nylon 6
Sumika Acryl in Japan and Sumipex
(Thailand) Co., Ltd. in Thailand, estab-
lished in 2002. We will continue to devel- Alumina powder for ceramic products
17 Annual Report 2009Petrochemicals & Plastics
Net Sales
FY2008
¥553.0 Billion
31%
[ FY2007 ¥603.3 Billion ]
Net Sales & Operating Margin
(Billions of yen)
-400 -200 0 200 400 600
The Petrochemicals & Plastics Sector progress in these efforts, and for
’05/3 3.6 412.6 engages in the development, man- polyethylene, we have improved
’06/3 3.7 486.1 ufacture and sale of a wide range productivity of our easy processing
’07/3 4.4 539.1
of petrochemical products, includ- polyethylene (EPPE) and developed
’08/3 0.7 603.3
ing synthetic resins such as polyeth- higher value-added applications for
’09/3 -5.5 553.0
ylene and polypropylene, synthetic this material. For polypropylene,
-10 -5 0 5 10 15
(%)
rubber and organic chemicals such we are developing new materials
Net sales (Top axis)
Operating margin (Bottom axis) as propylene oxide. Positioning and molding technologies that con-
polyethylene, polypropylene and tribute to reducing the weight of
propylene oxide as the core busi- car components.
Capital Expenditures &
Operating Income before Depreciation nesses of this Sector, we are active-
(Billions of yen)
-10 0 10 20 30 40 50 ly investing to expand these
businesses and enhance their prof- Performance for Fiscal 2008
’05/3 13.7 32.8
itability. We are also working to
’06/3 16.1 36.7
’07/3 16.9 42.8
further globalize our petrochemical In fiscal 2008, shipments of petro-
’08/3 21.2 22.9 business by capitalizing on the indi- chemical products, such as styrene
’09/3 -9.4 17.6 vidual strengths of our four bases monomer and propylene oxide, as well
of operation, located in Japan, as synthetic resins fell substantially in
Capital expenditures
Operating income before depreciation Singapore, North America and both Japan and overseas markets
Saudi Arabia. At each of these owing to a downturn in demand in the
bases, we seek to enhance our automotive and other related indus-
Total Assets & ROA
(Billions of yen) competitiveness by increasing our tries in the second half of fiscal 2008.
-600 0 200 400 600
efforts to procure lower-cost feed- As a result, sales for this Sector decreased
’05/3
4.1 386.5 stocks and reduce manufacturing by ¥50.4 billion compared with the pre-
’06/3 4.1 488.3 costs. Meanwhile, in order to shift vious year to ¥553.0 billion. Meanwhile,
’07/3 4.6 539.5 toward higher value-added busi- operating income declined by ¥34.9 bil-
’08/3 0.8 591.2
ness, we are continually improving lion, resulting in a loss of ¥30.3 billion,
’09/3 -5.6 499.2
manufacturing processes, enhanc- due in part to a loss on the write-
-6 0 2 4 6 ing the performance of our existing downs of inventories stemming from
(%)
Total assets (Top axis)
ROA (Bottom axis) materials and developing new lower market prices toward the end of
products. We are making solid fiscal 2008.
Sumitomo Chemical Company, Limited 18Polyethylene Business Arabia that produces 200,000 tons per
year using Sumitomo Chemical’s PO-
We operate polyethylene (PE) manufac- only process. We will continue our
turing facilities in Japan, Singapore and efforts to further consolidate our posi-
Saudi Arabia. With the aim of further tion as the top PO supplier in Asia.
enhancing the profitability of the busi-
ness, we are stepping up marketing
efforts for our EPPE, which combines
high strength and ease of processing. Polypropylene compound plant in France
We are also actively working to expand
our low-density polyethylene (LDPE) prime mortgage problems in the US
business in the area of high value- has had a significant impact on the
added applications, such as waterproof automotive industry, but the industry’s
laminates for paper and surface protec- growth potential remains high. We
tion films for electronic products. therefore started operation of our new Propylene oxide plant
PP compound plants near Atlanta,
Georgia, in the US and near Bangkok,
Thailand, as planned. This gives us a
total of five overseas plants for PP
compound production in five coun-
tries, including our plant in Zhuhai,
China, and our European plants in the
UK and France. In fiscal 2008, we dou-
Petrochemicals &
bled production capacity at the Zhuhai
Plastics
Products made of polyethylene plant, which started operation in
2006, and we are also undertaking
Polypropylene Business studies on capacity expansions for the
European plants.
We have polypropylene (PP) produc-
tion facilities in Japan, Singapore, Propylene Oxide Business
North America and Saudi Arabia. The
start of commercial operations of the Propylene oxide (PO) is used mainly as
new facilities at Petro Rabigh, our affil- a raw material for polyurethanes. In
iate founded with Saudi Aramco in Japan, Sumitomo Chemical has a PO
Saudi Arabia, has brought our global production capacity of 200,000 tons
production capacity for PP to 2 million per year using its PO-only process, and
tons annually. We are redoubling our Nihon Oxirane, our joint venture with
efforts to strengthen our high value- LyondellBasell, has a production capac-
added PP businesses globally, such as ity of 181,000 tons per year utilizing
PP compounds for use in automotive the PO/SM (styrene monomer) process.
components. Since last year, the global In fiscal 2008, our affiliate Petro Rabigh
financial crisis triggered by the sub- completed a new PO plant in Saudi
19 Annual Report 2009Fine Chemicals
Net Sales
FY2008
¥80.8 Billion
5%
[ FY2007 ¥92.9 Billion ]
Net Sales & Operating Margin
(Billions of yen)
0 25 50 75 100
The Fine Chemicals Sector engages in tions. It is also used as a raw material for
’05/3 13.7 84.1 the development, manufacture and such functional chemicals as flame-retar-
’06/3 12.4 79.0 sale of resorcinol, pharmaceutical dants and ultra-violet absorbents. The
’07/3 14.4 90.9
chemicals and polymer additives— worldwide demand for resorcinol in
’08/3 12.3 92.9
which comprise its core businesses— 2008 is estimated at 48,000 tons per
’09/3 2.0 80.8
as well as rubber chemicals and year. Although the market for resorcinol
0 10 20 30 40
(%)
other specialty chemicals. We are is in a temporary downturn owing to
Net sales (Top axis)
Operating margin (Bottom axis) working to expand the scale of the the impact of the global economic crisis,
Sector’s business while maintaining demand is expected to grow by an aver-
high profitability. age of 3% annually over the long term,
Capital Expenditures &
Operating Income before Depreciation supported by an increase in demand for
(Billions of yen)
0 5 10 15 20 automobiles in emerging markets, par-
Performance for Fiscal 2008 ticularly in Asia.
’05/3 7.5 17.8
We are supplying highly cost-competi-
’06/3 7.0 16.5
’07/3 4.6 19.6
In fiscal 2008, sales of pharmaceutical tive resorcinol by taking advantage of
’08/3 6.9 17.5 chemicals and raw materials for adhe- our outstanding manufacturing technol-
’09/3 7.7 7.9 sives declined because of a drop-off in ogy and world-scale production capacity
shipments and the appreciation of the in Chiba, Japan. We aim to expand our
Capital expenditures
Operating income before depreciation yen. Consequently, sales for this Sector resorcinol business and further enhance
contracted by ¥12.2 billion compared its profitability as the main engine of
with the previous year to ¥80.8 billion,
Total Assets & ROA
(Billions of yen) and operating income decreased by
0 50 100 150
¥9.8 billion to ¥1.6 billion.
’05/3
12.5 90.2
’06/3 10.6 95.0 Resorcinol Business
’07/3 13.4 100.7
’08/3 11.2 102.9
Resorcinol is used as a raw material for
’09/3 1.6 101.5
adhesives for bonding tire rubber with
0 10 20 30 reinforcing material and for adhesives
(%)
Total assets (Top axis)
ROA (Bottom axis) for wood used in construction applica- Resorcinol plant
Sumitomo Chemical Company, Limited 20long-term growth for the Sector. intense in recent years, resin manufac-
Anticipating that demand will continue turers are striving to differentiate
to grow, we will start operation of a their products. By providing high-
new resorcinol plant in Oita, Japan, in performance products that satisfy our
early 2010 as planned, using our highly customers’ growing needs for differen-
competitive production process. The tiation, we will continue to expand our
new plant will boost our production polymer additives business.
capacity from 20,000 tons to 30,000
tons annually. Along with these capacity Pharmaceutical Chemicals Pharmaceutical chemical products
expansions, we are stepping up our Business
sales activities in Asia. manufacturing and sales capabilities,
In our pharmaceutical chemicals busi- we are meeting the needs of pharma-
Polymer Additives Business ness, we supply pharmaceutical manu- ceutical manufacturers precisely and
facturers with active pharmaceutical promptly and providing a reliable sup-
Polymer additives are specialty chemicals ingredients (APIs) and pharmaceutical ply of high quality APIs and pharma-
added to synthetic resins and synthetic intermediates. The global market for ceutical intermediates.
rubber to inhibit their deterioration dur- pharmaceuticals is estimated at ¥60 to Working with our subsidiaries Sumi-
ing the manufacture, processing and 70 trillion and is forecast to see sus- tomo Chemical Europe and Sumitomo
use of the resins and rubber. Our main tained solid growth. The global market Chemical America, we are undertaking
products are Sumilizer GP, used in pro- for APIs and pharmaceutical intermedi- various initiatives to seize new business
cessing synthetic resins to improve their ates is estimated at ¥3 trillion. opportunities in the pharmaceutical
stability, and Sumilizer GA-80, used to Facing intense competition, major chemicals business in Europe and the
inhibit the deterioration of synthetic global pharmaceutical manufacturers are US. For example, we are increasing our
Fine Chemicals
resins resulting from oxidation. concentrating their resources on R&D sales force in those regions and
and marketing of new drugs while out- expanding our local GMP-compliant
sourcing non-core activities, in particular warehouses to enhance our logistics
production of APIs and their intermedi- capabilities. We are also collaborating
ates, in order to boost their competitive- more closely with major European and
ness. We expect that this trend will US pharmaceutical manufacturers to
open up more opportunities for our identify promising projects.
pharmaceutical chemicals business.
We are one of the world’s top man-
ufacturers of pharmaceutical chemicals
Polymer additives and possess the current GMP-compli-
ant quality assurance capabilities as
Capitalizing on our outstanding R&D well as advanced organic synthesis
capabilities, we have been providing technologies and expertise in scaling
high-performance polymer additives up processes for industrial production.
that outperform competing products. By building on our accumulated tech-
As competition in the synthetic resin nology and expertise and fully inte-
business has become increasingly grating research and development,
21 Annual Report 2009IT-related Chemicals
Net Sales
FY2008
¥307.1 Billion
17%
[ FY2007 ¥297.5 Billion ]
Net Sales & Operating Margin
(Billions of yen)
-100 0 100 200 300 400
The IT-related Chemicals Sector turers. Operating income decreased by
’05/3 174.8 10.7 engages in the development, manu- ¥7.3 billion to record a loss of ¥1.0 bil-
’06/3 9.5 229.2 facture and sale of polarizing film, lion because of a decline in selling price
’07/3 1.3 266.4
color filters and other materials for and a temporary rise in research and
’08/3 2.1 297.5
liquid crystal displays (LCDs), pho- development expenses in the second
’09/3 -0.3 307.1
toresists used in the manufacture of half of fiscal 2008.
-5 0 5 10 15 20
(%)
semiconductors, super engineering
Net sales (Top axis)
Operating margin (Bottom axis) plastics and other materials for IT- Polarizing Film Business
related products, as well as heat-
resistant separators for lithium-ion Our polarizing film business is the
Capital Expenditures &
Operating Income before Depreciation secondary batteries. mainstay of the Sector’s core LCD-
(Billions of yen)
0 20 40 60 80 The Sector seeks to achieve fur- related materials business. According
ther growth by focusing its business to projections by DisplaySearch, a well-
’05/3 37.1 40.2
resources on the three key areas of known marketing research company, in
’06/3 46.6 44.0
’07/3 35.0 72.0
polarizing film, super engineering spite of the global economic recession,
’08/3 33.4 48.5 plastics, and photoresists. worldwide demand for LCD televisions
’09/3 38.8 50.6 will increase over 20%, from 105 mil-
lion units in 2008 to 127 million units
Capital expenditures
Operating income before depreciation Performance for Fiscal 2008 in 2009.
In fiscal 2008, sales for this Sector
Total Assets & ROA
(Billions of yen) increased by ¥9.6 billion compared
-100 0 100 200 300 400
with the previous year to ¥307.1 bil-
’05/3
10.3 200.8 lion. Sales volumes of polarizing film, a
’06/3 9.3 266.8 key material for LCDs, increased
’07/3 1.2 325.6 backed by production capacity expan-
’08/3 2.0 299.5
sions and productivity improvement in
’09/3 -0.4 220.9
response to demand growth primarily
-5 0 5 10 15 20 in Asia. Toward the end of fiscal 2008, Polarizing film
(%)
Total assets (Top axis)
ROA (Bottom axis) however, this business was affected by
production cutbacks by LCD manufac-
Sumitomo Chemical Company, Limited 22Sumitomo Chemical currently boasts processes. Semiconductor manufactur-
the second largest market share glob- ers are vying to develop new manufac-
ally for polarizing film. We operate turing processes to further miniaturize
production facilities in Japan, Taiwan, circuits, which require more advanced
Korea, China and Poland, and we have lithographic technologies to pattern
forged strategic partnerships as a finer circuit lines. Sumitomo Chemical
prime supplier with major LCD panel has been developing high-perform-
manufacturers in Korea and Taiwan. ance photoresists to satisfy require-
Demand for polarizing films has been Electronic component made of ments for advanced lithographic
liquid crystal polymer
slowing down since the latter half of technologies that continue to rapidly
fiscal 2008 due to the recession, but is evolve. At present, in addition to the
expected to continue to grow in the Super Engineering Plastics conventional dry argon fluoride (ArF)
medium- to long-term, with large- Business exposure process, the semiconductor
screen LCD televisions becoming more industry is beginning to adopt the new
widely used in global markets, espe- Sumitomo Chemical engages in the ArF immersion exposure process.
cially in emerging economies. We will development, manufacture and sale of Through focused R&D efforts, we have
remain committed to promptly and super engineering plastics such as liquid developed a photoresist for this cut-
flexibly meeting the needs of LCD crystal polymer (LCP) and polyethersul- ting-edge semiconductor manufactur-
panel manufacturers worldwide by fone (PES). LCP is a high-strength, heat- ing process. Major industry users have
fully capitalizing on our five manufac- resistant and chemical-resistant resin adopted this product, and we antici-
turing bases. used in such applications as electronics pate broad acceptance of the product
On the development front, we are components and parts for office in the industry. We constructed a new
IT-related Chemicals
working to expand our polarizing film automation equipment. PES is a heat- dedicated production facility in Osaka
product line to satisfy diverse customer resistant, impact-resistant resin with a equipped with devices for perform-
needs. We are developing high-per- high degree of dimensional accuracy and ance evaluation, including the latest
formance materials with high contrast is used in composite materials for aircraft, ArF immersion scanner. We will contin-
and excellent visibility from wider view- components in hard disk drives and other ue to develop and launch advanced
ing angles for high-end LCD televisions, applications. We expect high growth in photoresists, including next-generation
while introducing cost competitive global demand for both LCP and PES for extreme ultra-violet exposure (EUV) pho-
materials for high-volume, low-end use in electronic equipment and aircraft. toresists, in a timely manner in response
LCD televisions. In order to better serve our LCP customers, to further advances in semiconductor
we have not only expanded production manufacturing processes.
Color Filter Business capacity, but have also established a
customer support center in Shanghai,
In our LCD-related materials business, China, which enables us to provide
we are also supplying 5th-generation effective and prompt technical support
color filters from our plant in Korea for directly to major global customers who
displays used in desk-top and note- locate production bases in China.
book computers. We are working vig-
orously for productivity improvement Photoresists Business
and cost reduction in order to enhance
the profitability of this business. Photoresists are photosensitive resins Photoresists
used in semiconductor manufacturing
23 Annual Report 2009Agricultural Chemicals
Net Sales
FY2008
¥222.2 Billion
12%
[ FY2007 ¥200.4 Billion ]
Net Sales & Operating Margin
(Billions of yen)
0 50 100 150 200 250
The Agricultural Chemicals Sector ing new applications for our exist-
’05/3 8.6 171.6 engages in the development, manu- ing products.
’06/3 8.9 186.2 facture and sale of agrochemicals,
’07/3 11.7 198.3
such as insecticides, fungicides, her-
’08/3 10.4 200.4
bicides and plant growth regulators; Performance for Fiscal 2008
’09/3 11.0 222.2
fertilizers; household and public
0 5 10 15 20 25
(%)
hygiene insecticides; long-lasting In fiscal 2008, despite the effects of an
Net sales (Top axis)
Operating margin (Bottom axis) insecticidal mosquito nets for con- appreciating yen, sales of agrochemi-
trolling tropical infectious diseases; cals expanded, bolstered by strong
and feed additives for poultry and demand mainly in overseas markets,
Capital Expenditures &
Operating Income before Depreciation other livestock. and sales of feed additives also
(Billions of yen)
0 10 20 30 40 The Sector has operational bases increased thanks to higher selling
not only in the major markets of prices on the back of growth in world-
’05/3 18.0 26.8
Japan, the US, Europe and Asia, but wide demand. Sales of OLYSET® Net, a
’06/3 8.8 31.8
’07/3 10.1 37.5
also in the growing markets of long-lasting insecticidal mosquito net,
’08/3 8.5 33.7 Africa, South America and Oceania, expanded steadily. Consequently, sales
’09/3 11.3 37.5 and earns more than 60% of its for this Sector increased by ¥21.8 billion
revenues in overseas markets. We over the previous year to ¥222.2 bil-
Capital expenditures
Operating income before depreciation in the Sumitomo Chemical Group lion while operating income rose by
consider R&D to be vital for achiev- ¥3.5 billion to ¥24.4 billion.
ing sustainable business growth.
Total Assets & ROA
(Billions of yen) We have established R&D capabili- Crop Protection Business
0 50 100 150 200 250
ties in the major markets, with our
’05/3 6.9 217.0 Agricultural Research Laboratory in In our crop protection business in
’06/3 7.5 224.3 Takarazuka, Japan, and research cen- Japan, we are aiming to increase our
’07/3 10.2 232.1 ters in the US, France and Malaysia, market share and broaden the scope
’08/3 8.9 240.4
and we are continuing coordinated, of our business by developing attrac-
’09/3 10.5 224.6
long-term efforts to develop inno- tive new products in-house as well as
0 5 10 15 20 25 vative agrochemical products. In by pursuing acquisitions and partner-
(%)
Total assets (Top axis)
ROA (Bottom axis) particular, we are focusing on dis- ships. We are also seeking to strength-
covering and developing novel en our crop protection business as a
agrochemicals as well as develop- total solutions provider for the farming
Sumitomo Chemical Company, Limited 24marking its entry into the home gardening Vector Control Business
business in the US.
Controlling malaria is one of the global
priority issues under the United Nations
Millennium Development Goals. Our
vector control business developed the
OLYSET® Net, a long-lasting insecticidal
bed net for the control of malaria, and
Crop protection products engages in the sale of these nets, pri-
marily in Africa. We established our
community. We support farmers by Vector Control Division in 2008 for the
supplying agrochemicals, fertilizers, and Products using our household insecticides purpose of strengthening our business
agricultural materials such as irrigation in the control of infectious tropical dis-
materials and coated seeds, in addition eases through use of the OLYSET® Net.
to providing various kinds of technical Environmental Health Business
services such as pest management, soil Feed Additives Business
analysis, fertilizer application and Our environmental health business con-
instruction in cultivation techniques. In tributes to healthy living environments Our feed additives business engages in the
2008, we formed a joint venture for through its worldwide businesses in manufacture and sale of DL-methionine
manufacturing controlled release fertil- household insecticides for public hygiene, and methionine hydroxy analog, essential
izers in Japan. Our controlled release professional pest control, pets and other amino acid feed additives used primarily
fertilizers are expected to see growing non-crop applications. In this business, we in poultry farming. Methionine is expect-
Agricultural Chemicals
demand in the future, because they have been actively developing new appli- ed to see continuing high demand
enable Japan’s farmers, facing an aging cations of our active insecticidal ingredient growth in Asia, particularly China. In order
and declining workforce, to save labor Eminence®/SumiOne®. Conventional house- to meet growing demand, we have
in applying fertilizers and improve effi- hold insecticidal products require heating, recently decided to expand our produc-
ciency in farming. using either electricity or flame, to disperse tion capacity from approximately
Our overseas crop protection business insecticidal agents. By contrast, products 100,000 tons per year to 140,000 tons
has continued to face intense competition using our Eminence /SumiOne do not
® ®
per year. The new plant is scheduled to
from multinational majors and generic require the application of heat, because start operation in the first quarter of
manufacturers. Responding to this situa- Eminence /SumiOne evaporates at
® ®
2010. We will continue to consolidate
tion, we are focusing our business resources room temperature. This active insectici- our position as Asia’s top producer by
on product areas and regions where we dal ingredient is seeing an increase in meeting our customers’ needs in a
possess competitive strengths. Our current applications and expanding sales. prompt and flexible manner.
areas of focus are insecticides and fungi-
cides for fruits and vegetables as well as
plant growth regulators. In addition, the
field of non-crop use of agrochemicals is
where we can demonstrate our advantage
of engaging in both the agricultural chem-
icals and environmental health chemicals
businesses. In 2008, our subsidiary Valent
U.S.A. Corp. acquired a US company,
OLYSET® Net DL-methionine
25 Annual Report 2009You can also read