Rebranding NTU Library: A Transmedia Approach - Samantha Seah Siew Cheng Noverinda Bella Ratmelia Thavamalar Mohan
←
→
Page content transcription
If your browser does not render page correctly, please read the page content below

Rebranding NTU Library:
A Transmedia Approach

Samantha Seah Siew Cheng
Noverinda Bella Ratmelia
Thavamalar Mohan

Office of Information, Knowledge
& Library Services
Introductions

     Samantha Seah              Bella Ratmelia           Thavamalar Mohan
         Librarian                 Librarian           Senior Assistant Manger
  Advisory & Consultation   Advisory & Consultation   Communications & Outreach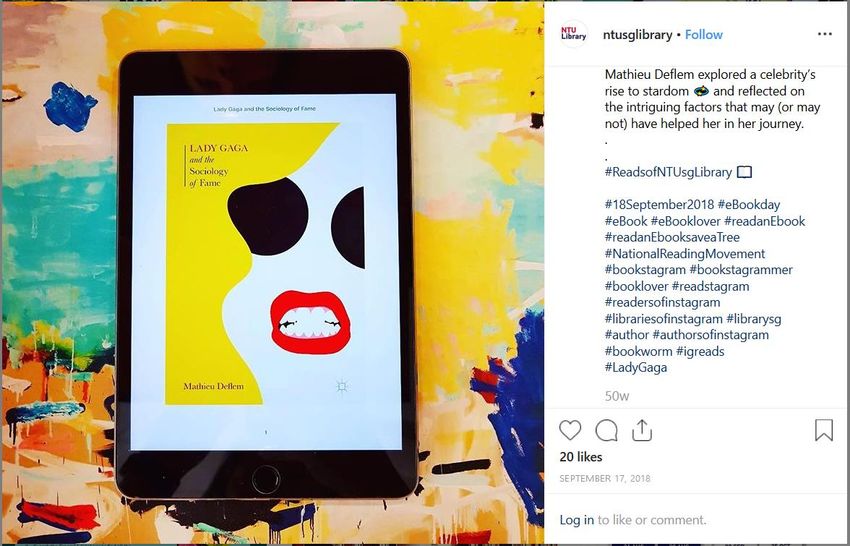
Overview
•   Part 1: Background and some definitions
•   Part 2: Rebranding NTU Library
•   Part 3: Crafting content strategy
•   Part 4: Campaign design and using social media
•   Part 5: Takeaways from the past year

Before NTU Library, we were
• Main strategy: saturation
• Platforms:
   – Physical i.e. posters, in person during orientation
   – Web e.g. Facebook, Twitter, TV screens, Channel NTU, NTU
     Event Calendar, Website Banners, Blogsite
   – Library communal PC wallpapers
   – Emailers
Workflow
• While the Library Promotion Division were the main team in charge
  of library promotion, other teams also had their own ideas and were
  given the freedom to execute
• On the flipside, this meant there wasn’t any standardization across
  the libraries
• In 2016, there was a change in NTU Corporate Communications
  Office which lead to rebranding and stricter control over any
  communications from departments
REBRANDING NTU LIBRARY
Name and identity
                             NAME
                          NTU Library
      Office of Information, Knowledge and Library Services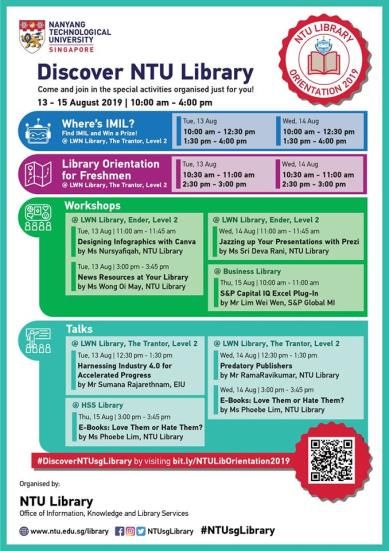
Poster templates

BRANDING SOCIAL MEDIA PLATFORMS
Social Media - Platforms
             Platform                       Branding
             Facebook

 https://www.facebook.com/NTUsgLibrary/

             Instagram

  https://www.instagram.com/ntusglibrary/
Social Media - Platforms
Platform Branding
Twitter
https://twitter.com/NTUsgLibrary
YouTube
https://www.instagram.com/ntusglibrary/CONTENT STRATEGY
Transmedia Storytelling
• Definition of transmedia (Phillips, 2012):
    – Multiple pieces of media that are, by themselves, whole and standalone but
      complement each other and interweave
    – Tightly woven content, spread over various platforms, for a set duration of time.
      Typically heavily reliant on social media

• “Transmedia storytelling is a marriage of various forms of technology
  and media … to invite audiences to connect to a story across
  multiple platforms.” (Thomas, 2015, p.19)
Transmedia Storytelling • In contrast to entertainment, storytelling for marketing purposes refers to use phrases or images to tell stories that are bigger than the sum of their parts and elicit an emotional response • Balance your brand against the story
Decide on your story
• Things to think about:
   – Show don’t tell
   – Values/adjectives you want associated with your brand

• Put yourself in your audience’s shoes
   – Find the heart of your story, why should people care about your
     story
Content Strategy A content strategy was devised to achieve the following with our users: 1. Connect 2. Communicate 3. Collaborate
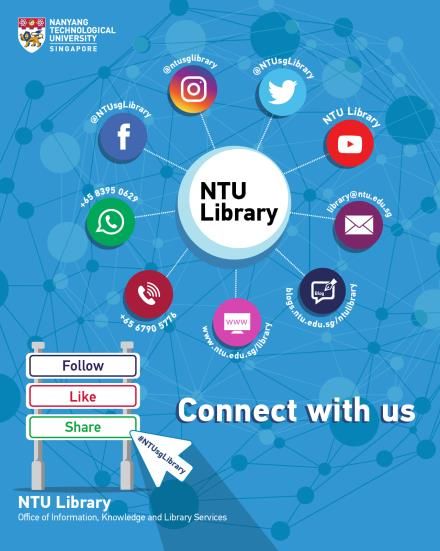
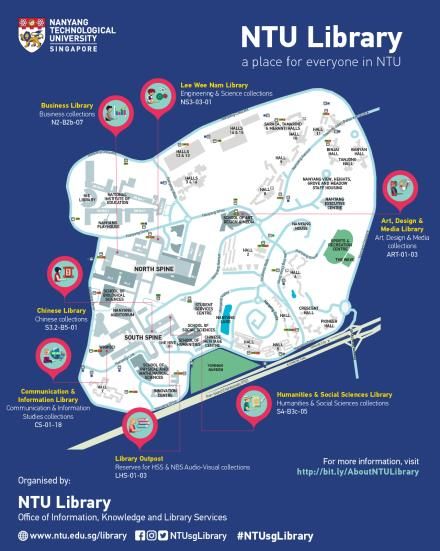
1. Connect
•   Educate users on the various communication platforms they can use to connect with
    NTU Library and the various locations their resources are available at both physically
    and digitally.
1. Connect
• Inform users on the services that can help them with the resources they need and invite
them to our physical spaces to let them experience how the library cares for them.2. Communicate
• Inform users on the various events, workshops, talks, contests and seminars the
library organises and invite them to participate.2. Communicate
• Librarians connect with the users in person at events of all nature to advocate the
value of the library and importantly gather feedback. Some of these feedback are
documented into videos which are produced and uploaded onto the library’s social
media platforms to keep others informed on the experiences they can get with NTU
Library.3. Collaborate
• Seek collaboration opportunities with members of the NTU community and outside the
university to promote their products/services, host their events or partner in their
showcase.3. Collaborate
• To provide effective value propositions for stakeholders and users who will in turn
support the library’s initiatives and campaigns through participation or publicity.SOCIAL MEDIA STRATEGY
Introducing Hashtags

            #NTUsgLibrary
              A hashtag is a label for content.
   It helps others who are interested in a certain topic,
          quickly find content on that same topic.
Introducing Hashtags
Branding Hashtag: #NTUsgLibraryEstablishing Hashtags
Sub-branding hashtags Campaign Hashtags
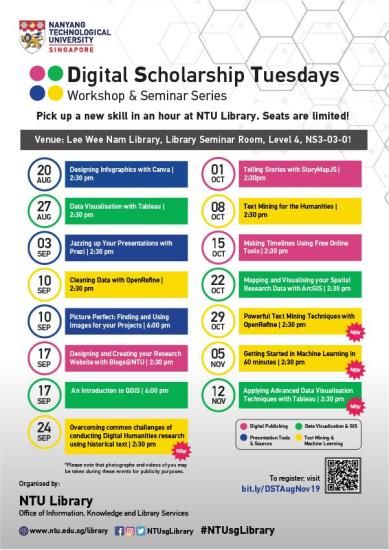
#ReadsofNTUsgLibrary Digital Scholarship Workshop Series
#DiscoverNTUsgLibrary DS: #NTUsgLibraryDS
#CelebratewithNTUsgLibrary Python workshops and consultations: #Python_NTUsgLib
#ResearchatNTUsgLibrary / #PythonProgramming
#ResourcesatNTUsgLibrary Education & Learning Workshop Series
#DatabasesatNTUsgLibrary EndNote workshops and consultations:
#EndNote_NTUsgLib / #EndNote
#WorkshopatNTUsgLibrary
Information & Research Management workshops:
#QuizatNTUsgLibrary #IRM_NTUsgLib
#ContestatNTUsgLibrary Research Talks and Seminars
#TalksatNTUsgLibrary DR-NTU Data: #DataNTUsgLibrary / #DRNTUsgLibrary
#ExhibitionatNTUsgLibrary Open Access talks and seminars: #NTUsgOA / #OAweek /
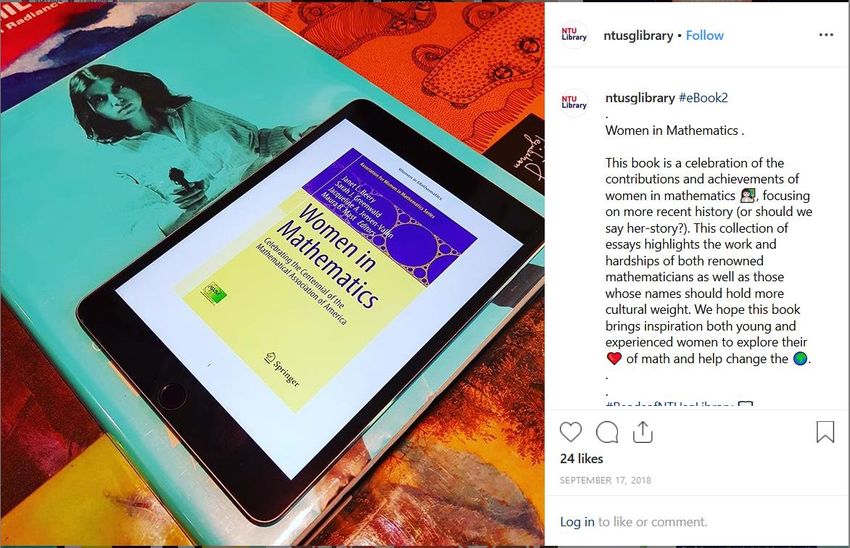
#OpenAccessCampaign #ReadsofNTUsgLibrary • When: July 2018 • Why: Tie-in with National Reading Week and eBook Day • How: – Selected 10 titles, took photos, crafted short synopsis/reviews
Instagram: 20 posts with a total of 360
                                             likes and 23 stories with 845 views.

Facebook: 18 posts with a total of 62
likes and 23 stories (no stats for views).
Campaign: #SpookedatNTUsgLibrary
• When: October 2018
• Why: Tie-in with Halloween and revision period
• How:
– Decorated entrance of Lee Wee Nam Library
– Dressed up in costume on 30 Oct and went around LWNL to give
out sweets to studentsInstagram: 18 posts with 161 likes and
808 video views / 59 stories with
2,660 views.
Facebook: 18 posts, 37 likes with 125
views.Social Media Strategy What? To increase followers across our social media platforms – Facebook & Instagram Why? - To raise awareness and promote the services of NTU Library. How? - Like, Follow and Share @NTUsgLibrary / #NTUsgLibrary - Populate relevant and fun content for our target audience to read, participate in and engage with.
Choosing your platforms
•   Not all platforms are equal; some are more equal than others:
     – Understand who you’re reaching out to, and
     – How best to engage your audience, but
     – Consider what kind of content you can sustainably generate

•   As of Q3 2018, the leading social networks in Singapore are
     –   YouTube (87%)
     –   WhatsApp (86%)
     –   Facebook (82%)
     –   Instagram (59%)
     –   Facebook Messenger (59%)
     –   Twitter (34%)
Instagram
Instagram Users in Singapore WARC Best Practice, August 2019:
• Globally, 87% of Instagram users
have engaged with the business
37.7% after seeing a product
information post on Instagram.
This includes liking, commenting,
62.3% sharing, etc.
• Highlights growing importance of
visual communication
< 35 year old 35 and older
Adapted from Statista’s Share of Instagram users in Singapore as of December 2018, by age and
gender [Graph]. For the original graph, please refer to the appendix.Twitter and Facebook
• Facebook and Twitter users in Singapore have been steadily
increasing and this trend has been projected to continue (Statista
Digital Market Outlook, 2018)
• According to Hootsuite:
– Tweets with videos get 10 times more engagement than those without. They are
also 6 times more likely to be retweeted.
– Tweets with GIFs get 55% more engagement than those without. However, only
2% of Tweets contain GIFs.SOCIAL MEDIA CONTENT & STATISTICS
Social Media Content
•   Any content relevant to academia, knowledge, information sharing
    and promoting NTU Library’s
      - Services
      - Spaces
      - Resources
      - Workshops, talks, events

•   It can be in the form of:
       - Links to articles or other posts
       - Books or articles belonging to the Library
       - Pictures
       - Videos
       - FB / Insta-stories & LIVE Tweets
New approaches to events
• Live-tweeting of scholarly talks
and events
• Live-streaming of OneSearch
event via Instagram, featured
photos of students engaging with
OneSearch booth via Instagram
• Cross-posting between other
media
– E.g. promote library blog posts on
social media
– Sync all posts on three platformsChanges in numbers of followers over the past 12 months
9,000
8,000 7,534 7,718
7,416
7,000
6084 6086 6044
6,000
5,000
4,000
3,000
2,000
879
1,000 409 597
0
Aug-18 Feb-19 Aug-19
Facebook Followers Instagram Followers Twitter FollowersTwitter Stats for the past 6 months
150 138
129
100 89 87.26
61
50 25.4 25 32.5
14.86
12 14.1 19
15 13 14
9
8.09
3 7.41
4 5.05 9.58
9
4 6.02
3
-1 0
-1
0
Mar-19 Apr-19 May-19 Jun-19 Jul-19 Aug-19
-50
-85
-100
Mar-19 Apr-19 May-19 Jun-19 Jul-19 Aug-19
Tweets 89 25 19 13 129 138
Impressions (in thousands) 25.4 14.1 15 87.26 32.5 61
Profile Visits (in hundreds) 14.86 8.09 7.41 5.05 9.58 6.02
New Followers -85 9 -1 -1 9 3
Mentions 12 3 4 0 4 14
Tweets Impressions (in thousands) Profile Visits (in hundreds) New Followers MentionsWhy do these statistics matter? • Likes, shares, and mentions indicate rate of engagement – your “relationship” with your users • Follows indicates interest of users to your library • Transmedia encourages this type of interaction which can add more depth of engagement (Philips, 2012) Note: It is possible to have a high number of likes and shares despite a low number of followers and vice versa
How do you use these statistics?
• Analysing statistics allows you to compare metrics and
  tailor information discovery (McErlean, 2018)
• See how your community responds to your stories and
  work from there
• Collect any statistics you can get but take the time to
  review them, then modify your strategies
Takeaways – what we would do again
• Plan, plan, plan
   –   Be clear on your branding and messages, and how you want to put them across
   –   Do some research on how to effectively use the various social media tools
   –   Come up with a clear set of guidelines
• Use social media!
   –   Think of it as “market research” and “tool testing”.
   –   Impossible to craft an effective message without understanding the
       demographic and the tool
• Have a social media calendar, but also be prepared to be spontaneous
  – some opportunities may appear without much warning
   –   Take advantage of global events/holidays to help with campaign scheduling
Takeaways – what we would do again
• Remember that everyone has their own set of expertise
• For librarians - listen to your comms expert, they can guide you in
how to craft your messages when it comes to communication
strategy
• For comms expert - listen to your librarians, they can provide
context and information about user demographics and happenings
• Be willing to learn from each other!
• Consistency is key – Be sure to have steady stream of
content to continuously engage users
• This is very tedious and can be considered as a full-time job!Takeaways - what we can do better
• Customize the visual assets to suit each platform
– What may suit Instagram may not suit Facebook due to different
optimum sizes/devices from which users are accessing them,
etc.
• Refine the customization of targeted campaign
– Make it more efficient in terms of which platform should be the
main priority for the different kinds of campaignTakeaways – roadmap for the future
• Collaborate with other libraries e.g. commenting on each
other's posts, rotating exhibitions, coordinated campaigns
• Putting a face to the librarians
• Try more new features:
• Reach out more to students via Instagram story and IGTV
• Library event livestreaming via Facebook/Instagram
• Use Twitter Moments
• Leverage on the insights gained from statistics
• Explore other possible tools that can give us more insights from the
collected data of likes, shares, etc.THANK YOU
REFERENCES
McErlean, K. (2018). Interactive Narratives and Transmedia Storytelling (1st
      edition). Focal Press.
Phillips, A. (2012). A Creator’s Guide to Transmedia Storytelling: How to
      Captivate and Engage Audiences across Multiple Platforms (1st edition).
      McGraw-Hill.
Statista. (2019). Social media in Singapore. Retrieved 10 September 2019,
      from https://www.statista.com/study/63698/social-media-in-singapore/
Thomas, V. (2015). Transmedia storytelling. Legacy Magazine, 26(2), p.19-21.
WARC. (2019, August). WARC Best Practice: What we know about marketing
      on Instagram. Retrieved 10 September 2019, from
      https://www.warc.com/content/article/bestprac/what_we_know_about_mar
      keting_on_instagram/110477
APPENDIX
Table 1: Share of Instagram users in Singapore
as of December 2018, by age and gender
                                                                   Females   Males
                       25.0%

                                                           20.3%
                       20.0%
                                                                17.1%
      Share of users

                       15.0%
                                             11.7%                       11.3%
                                                  10.4%
                       10.0%                                                     8.1%
                                                                                        6.3%
                                                                                               4.5%
                       5.0%                                                                            3% 2.3%
                               1.5% 1.3%                                                                            1.2% 1.1%
                       0.0%
                               13-17 years   18-24 years   25-34 years   35-44 years    45-54 years   55-64 years   65 years and
                                                                                                                        older
Note: Singapore; December 2018
Source(s): NapoleonCat; ID 952815
Table 2: Number of Facebook users in
Singapore from 2017 to 2023 (in millions)
5
4.4 4.5
4.5 4.2 4.3
4 4.1 4.1
Number of users in millions
4
3.5
3
2.5
2
1.5
1
0.5
0
2017 2018 2019* 2020* 2021* 2022* 2023*
Note: Singapore; 2017 to 2018; Internet users who access their Facebook account via any device at least once per month
Source(s): Statista; Statista Digital Market Outlook; ID 490492Table 3: Number of Twitter users in Singapore
from 2014 to 2019 (in millions)
0.7
Number of active Twitter users in
0.6
0.5
millions
0.4
0.3
0.2
0.1
0
2014 2015 2016* 2017* 2018* 2019*
Note: Singapore; 2014 to 2015
Source(s): eMarketer; ID 490600You can also read